 Products Home / Custom Solutions & Manufacturing Capabilities / Optics Capabilities / Optical Substrates
Optical Substrates

Please Wait
Click on the bars in the graph above to view the transmission plot for each optical material.
Thorlabs offers a wide variety of optical substrates that are ideal for use in various applications. The graph to the right compares the transmission ranges of some of the most common substrates we offer. This page details optical properties for these substrates, as well as the substrates used in our aspheric and achromatic lenses. To quickly navigate through these substrates, use the Table of Contents listed below or click on the tabs above.
For more information about the properties listed throughout this page, please see the Tutorial tab above. If you have questions about a substrate not described on this page, please contact Tech Support.
Table of Contents
- Other Tabbed Content
This tab details the key crystalline, optical, physical, and thermal properties provided for the substrates featured on the rest of the tabs on this page. Please contact Tech Support if you have any further questions concerning these properties.
Table of Contents
Optical Properties
Index of Refraction
Index of refraction, n, is an optical property that describes how light propagates through a material. It is defined as
where c is the speed of light in a vacuum, and v is the speed of light through the material. The index of refraction of a material varies with both temperature and wavelength. The change of index of refraction with temperature is discussed in more detail in the Thermal Properties section below. The change in index of refraction with wavelength is known as dispersion and can be clearly seen in the graph to the right, which shows the variation in n for N-BK7.
Attenuation Coefficient
The attenuation coefficient, α, is a material property that characterizes the degree of transparency of a medium. The intensity transmitted through a material is described by the Beer-Lambert law:
where I is the transmitted intensity, I0 is the incident intensity, and l is the thickness of the material. Losses described by the attenuation coefficient include both scattering and absorption by the material. Like index of refraction, the attenuation coefficient of a material varies with wavelength.
Sellmeier Equation
The Sellmeier equation is used to characterize the dispersion of light with respect to wavelength and is written in the form

where λ is wavelength in μm and B1 , B2 , B3 , C1 , C2 , and C3 are constants unique to the material being tested. The Sellmeier equation used to plot N-BK7's index of refraction as a function of wavelength can be seen by clicking on the hyperlink in the footnote under the graph.
Abbe Number
Also known as the V-number, the Abbe number is an optical property that quantifies a material's dispersion, or variation in refractive index with respect to wavelength. It is defined by the equation
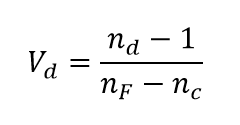
where Vd is the Abbe number, and nd , nF , and nC are the refractive indexes of the material at 587.6 nm, 486.1 nm, and 656.3 nm, respectively. A high Abbe number is indicative of low dispersion whereas a low Abbe number indicates high dispersion.
Fresnel Reflectance and Transmittance
The Fresnel equations describe the reflection and transmission of light at an interface between two materials with different indices of refraction. These equations provide reflectance and transmittance values, which give the ratio of the reflected and transmitted light intensity, respectively, to the incident intensity. This can be written as
where R is the reflectance, T is the transmittance, I0 is the incident intensity, Ir is the reflected intensity, and It is the transmitted intensity. The Fresnel values given on this page are for normal incidence.
Physical Properties
Figure 1. Knoop Hardness Test
Knoop Hardness
Knoop hardness (HK) is a measure of a material's mechanical hardness and is most commonly given for brittle materials. Knoop hardness is tested by pressing a pyramidal diamond-shaped indenter into a material sample and analyzing the resulting indentation in the material. The process is shown in the animation denoted as Figure 1 to the right. The Knoop Hardness is then calculated using
where HK is the Knoop hardness, K is a constant related to the indenter's geometry, P is the test load, and L is the longest diagonal length of the diamond-shaped indentation.
Moduli: Young, Shear, and Bulk
Young's modulus, shear modulus, and bulk modulus are all measures of how a material deforms, or strains, under different stresses. Stress is the term used to describe the amount of force applied to a sectional area of a sample. Stress is mathematically calculated using the following equation:
where σ is stress and F is the force applied on the cross-sectional area, A, of a sample. The term strain is used to describe the deformation of a sample as a result of a stress and is mathematically calculated using
where ε is strain, Δx is the change in size of a sample, and x is the original size of a sample.
Young's modulus, shear modulus, and bulk modulus are useful in quantifying the stiffness of materials. A stiffer material has higher moduli than a more flexible material.
Figure 2. Measurement of Young's Modulus
Young's Modulus
Young's modulus (E ), also known as elastic modulus, describes how a material deforms under a normal, or tensile, stress. To measure Young's modulus, a material is either pulled or compressed along its length, and the resulting change in length is measured. The animation in Figure 2 demonstrates one method of measuring Young's modulus. Mathematically, Young's modulus is calculated by dividing a sample's normal stress over its normal strain. In Figure 2 and in the equation below, E is Young's modulus, L is the original length of the sample, ΔL is the change in the length of the sample, and F is the force applied normal to the face of the sample with surface area, A.
Figure 3. Measurement of Shear Modulus
Shear Modulus
Shear modulus (G ) is the measure of how a sample deforms when it is sheared (i.e., when a force is applied parallel to one surface of the sample and an opposing force is applied to the opposite face, as shown in Figure 3). Mathematically, shear modulus is calculated by dividing a sample's shear stress by its shear strain. Shear stress and strain are demonstrated in the Figure 3 animation. Within the animation and in the following equation, G is the shear modulus, h is the height of the test sample, Δx is the change in shape due to the shear force, F , applied to the sample, and A is the surface area of the face to which the force is applied.
Figure 4. Measurement of Bulk Modulus
Bulk Modulus
Bulk modulus (K ) describes a material's volumetric stiffness when exposed to increased uniform pressure. When a material is exposed to high, uniform, external pressure, it tends to shrink. Bulk modulus is the measure of how much a material resists this shrinking. Mathematically, bulk modulus is calculated by dividing a sample's bulk stress by its bulk strain. In the Figure 4 animation and the equation below, K is the bulk modulus, V represents the original volume of the sample, and V′ is the volume of a sample after it is exposed to change in uniform pressure, ΔP.
Figure 5. Measurement of Poisson's Ratio
Poisson's Ratio
Poisson's ratio, ν (nu), is a measure of how much a material contracts in the perpendicular direction due to stretching, or conversely, how much a material expands in the direction perpendicular to the applied force due to its compression. Imagine stretching a rubber band and watching the band become thinner; as you continue to stretch it farther, the thinness also increases. Poisson's ratio can also be measured by compressing a material and measuring how much thicker it gets, as shown in the Figure 5 animation. Mathematically, Poisson's ratio is defined as the negative change in transverse strain divided by the change in axial strain. In Figure 5 and the equation below, εtrans is transverse strain (i.e., the strain perpendicular to the applied force, F) and εaxial is axial strain (i.e., the strain parallel to the applied force). dεaxial and dεtrans are the changes in strain on the sample due to an applied force.
Relationship between Poisson's Ratio and the Young's, Shear, and Bulk Moduli
In isotropic materials, there is a linear relationship between Poisson's ratio, Young's modulus, shear modulus, and bulk modulus. This makes it possible to calculate any unknown moduli of certain materials using only two known values. Isotropic materials have identical physical properties in every orientation. In other words, their properties do not vary as the axis along which the force is applied varies. Many optical glasses, such as N-BK7 or N-SF11, are isotropic and thus have moduli values calculated from the equations
where E is Young's modulus, G is shear modulus, K is bulk modulus, and ν is Poisson's ratio. These relationships are not true for anisotropic materials. Most crystalline materials, such as Thorlabs' fluoride optics, are anisotropic, and hence, each modulus must be measured separately. Moduli that were calculated rather than measured are noted in the specification table for every applicable substrate.
Thermal Properties
Coefficient of Thermal Expansion
The coefficient of thermal expansion (CTE) describes a material’s tendency to expand or contract with a change in temperature. A positive CTE would describe a material that expands with increases in temperature, and a negative CTE describes a material that contracts with increases in temperature. Specifically, the coefficient of linear thermal expansion (aL ) is the numerical description of how much the length of a material changes with temperature and can be expressed as
 Click to Enlarge
where aL is the coefficient of linear thermal expansion, L is the original length of the sample, dL is the change in length of the sample, and dT is the change in temperature.
Change in Index of Refraction with Temperature
The index of refraction of a material is not only dependent on the wavelength of light passing through it; it is also dependent on the temperature, as shown in the graph to the right. This change in index of refraction with temperature is also known as the thermo-optic coefficient and is commonly written as dn/dT. Because the thermo-optic coefficient varies both with temperature range and wavelength, a standard temperature range and test wavelength are selected when reporting this specification for a material.
Crystalline Properties
Parallel versus Perpendicular
Crystalline material data is often given for both the parallel and perpendicular axes of the crystal to ensure accuracy. The crystalline structure of some materials results in a difference between the properties along the optical axis and those along the perpendicular axis. The parallel, or extraordinary, axis is the axis along which transmitted light will suffer no birefringence. It is parallel to the optical axis of the crystal. The perpendicular, or ordinary, axis is perpendicular to the optical axis.
| Alpha-BBO Specifications | |
|---|---|
| Index of Refractiona |
 |
| Index of Refraction at d-Line (587.6 nm)a | ne = 1.533 no = 1.673 |
| Sellmeier Equation, Extraordinarya | 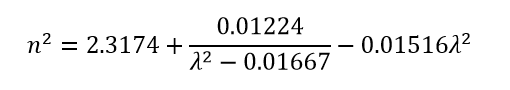 |
| Sellmeier Equation, Ordinarya | 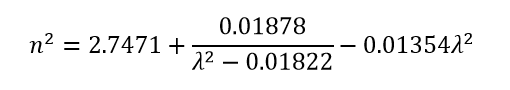 |
| Abbe Number (Vd), Extraordinary | 56.18 |
| Abbe Number (Vd), Ordinary | 52.23 |
| Transmission Range | 190 nm - 3.5 µm |
| Fresnel Reflectance and Transmittance, Extraordinary (Calculated) |
 |
| Fresnel Reflectance and Transmittance, Ordinary (Calculated) |
 |
| Density | 3.85 g/cm3 |
| Knoop Hardness | - |
| Young's Modulus | 39 GPa |
| Shear Modulus | 12.3 GPa |
| Bulk Modulusb | - |
| Poisson's Ratio | 0.58 |
| Coefficient of Thermal Expansion | 36 x 10-6 /°C (Parallel) 4 x 10⁻⁶ /°C (Perpendicular) |
| Heat Capacity | 0.49 J/(g*K) |
| Melting Point | 1095 °C |
| Change in Index of Refraction with Temperature |
-9.3 x 10⁻⁶ /°C (Parallel) -16.6 x 10⁻⁶ /°C (Perpendicular) |
| Alpha-BBO Optics Selection |
|---|
Click to Enlarge
Click Here for Raw Data
This data was gathered through a GLB5 Glan-Laser Polarizer of thickness
8.2 mm and is indicative of the material's properties..
Alpha-BBO (α-BBO, α-BaB2O4) is a negative uniaxial crystal, which is the high temperature form of β-BBO, and exhibits many of the same physical and optical properties. Alpha-BBO’s high birefringent structure makes it a useful substrate in the fabrication of polarization optics. Since α-BBO is a soft crystal that is easily damaged, all of our α-BBO polarizers are offered in metal housings. With convenient threadings and adapters, these housings can easily be mounted into our optomechanical products. Alpha-BBO has a transmission range from 190 nm to 3.5 µm. It has an ordinary refractive index of 1.673 and an extraordinary refractive index of 1.533 at 587.6 nm.
Click on the images below or open the table to the right to see Thorlabs’ complete selection of optics made from α-BBO.
| Barium Fluoride Specifications | |
|---|---|
| Index of Refractiona |
|
| Index of Refraction at Nd:YAG (1.064 µm)a | 1.468 |
| Sellmeier Equationa | 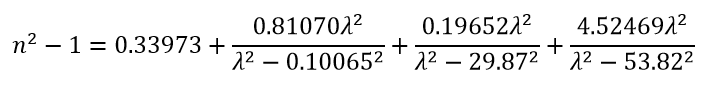 |
| Abbe Number (Vd) | 81.78 |
| Transmission Range | 200 nm - 11 µm |
| Fresnel Reflectance and Transmittance (Calculated) |
 |
| Density | 4.893 g/cm3 |
| Knoop Hardness | 82 kg/mm2 |
| Young's Modulus | 53.07 GPa |
| Shear Modulus | 25.4 GPa |
| Bulk Modulus | 56.4 GPa |
| Poisson's Ratio | 0.343 |
| Coefficient of Thermal Expansion | 18.4 x 10⁻⁶ /°C |
| Heat Capacity | 0.41 J/(g*K) |
| Melting Point | 1368 °C |
| Change in Index of Refraction with Temperature (+20/+40 °C @ 1060 nm) |
-15.2 x 10⁻⁶ /°C |
| Barium Fluoride Optics Selection |
|---|

Barium Fluoride (BaF2) is transparent from the UV to the IR (200 nm - 11 µm) and has an index of refraction of 1.468 at 1.064 µm. Barium fluoride's properties are similar to those of calcium fluoride, but it is more resistant to high-energy radiation. It is, however, less resistant to water damage. Pronounced degradation of the BaF2 substrate occurs at 500 °C when exposed to water, but in dry environments, it can be used in applications requiring exposure to temperatures up to 800 °C.
When handling optics, one should always wear gloves. This is especially true when working with barium fluoride as it is a hazardous material. For your safety, please wear gloves whenever handling BaF2 and thoroughly wash your hands afterwards. Click here to download a pdf of the MSDS for BaF2.
Click on the images below or open the table to the right to see Thorlabs’ complete selection of optics made from BaF2.
| Calcite Specifications | |
|---|---|
| Index of Refractiona |
 |
| Index of Refraction at Nd:Yag (1.064 µm)a | ne = 1.480 no = 1.642 |
| Sellmeier Equation, Extraordinarya | 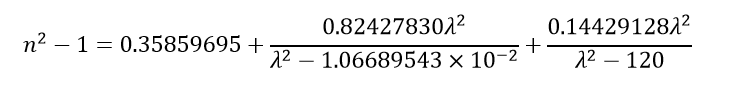 |
| Sellmeier Equation, Ordinarya | 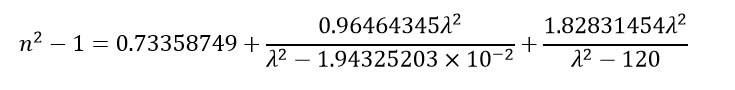 |
| Abbe Number (Vd), Extraordinary | 79.17 |
| Abbe Number (Vd), Oridinary | 49.91 |
| Transmission Rangeb | 300 nm - 2.3 μm |
| Fresnel Reflectance and Transmittance, Extraordinary (Calculated) |
 |
| Fresnel Reflectance and Transmittance, Ordinary (Calculated) |
 |
| Density | 2.71 g/cm3 |
| Knoop Hardness | 155 kg/mm2 |
| Young's Modulus | 88.19 GPa (Parallel) 72.35 GPa (Perpendicular) |
| Shear Modulus | 35 GPa |
| Bulk Modulus | 129.53 GPa |
| Poisson's Ratio | 0.85 |
| Coefficient of Thermal Expansion (@ 0°C) |
25 x 10-6 /°C (Parallel) 5.8 x 10⁻⁶ /°C (Perpendicular) |
| Heat Capacity | 0.852 J/(g*K) |
| Melting Point | 825 °C |
| Change in Index of Refraction with Temperature (@ 500 nm) |
3 x 10⁻⁶ /°C (Parallel) 13 x 10-6 /°C (Perpendicular) |
| Calcite Optics Selection |
|---|
Calcite (CaCO3), or Iceland Spar, is a useful crystalline substrate most commonly used in polarization optics. A calcite polarizer can be designed as either a polarization splitter/combiner or as a polarizer element that removes the angled, orthogonally polarized component of a beam. Since calcite is a soft crystal that is easily damaged, almost all of our calcite polarizers are offered in metal housings. With convenient threadings and adapters, these housings can easily be mounted into our optomechanical products. The transmission data above was taken through an uncoated Glan-Laser calcite polarizer. Calcite has a transmission range from 300 nm to 2.3 μm. It has an ordinary refractive index of 1.642 and an extraordinary refractive index of 1.480 at 1.064 µm. It is not recommended to use these polarizers for input beams with wavelengths greater than 2.3 µm, as calcite has different absorption coefficients for the ordinary and extrarodinary rays that diverge past this point.
Click on the images below or open the table to the right to see Thorlabs’ complete selection of optics made from calcite.
| Calcium Fluoride Specifications | |
|---|---|
| Index of Refractiona |
 |
| Index of Refraction at Nd:YAG (1.064 µm)a | 1.428 |
| Sellmeier Equationa | 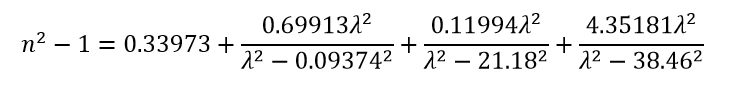 |
| Abbe Number (Vd) | 95.31 |
| Transmission Range | 180 nm - 8.0 µm |
| Fresnel Reflectance and Transmittance (Calculated) |
 |
| Density | 3.18 g/cm3 |
| Knoop Hardness | 158.3 kg/mm2 |
| Young's Modulus | 75.8 GPa |
| Shear Modulus | 33.77 GPa |
| Bulk Modulus | 82.71 GPa |
| Poisson's Ratio | 0.26 |
| Coefficient of Thermal Expansion | 18.85 x 10⁻⁶ /°C |
| Heat Capacity | 0.854 J/(g*K) |
| Melting Point | 1418 °C |
| Change in Index of Refraction with Temperature (+20/+40 °C @ 1060 nm) |
-10.6 x 10⁻⁶ /°C |
| Calcium Fluoride Optics Selection |
|---|
Calcium Fluoride (CaF2) is transparent from the UV to the IR (180 nm - 8.0 µm). It has a refractive index of 1.428 at 1.064 µm and is mechanically and environmentally stable. CaF2 is ideal for any demanding applications where its high damage threshold, low fluorescence, and high homogeneity are beneficial. It is popular in excimer laser applications and frequently used in spectroscopy and cooled thermal imaging.
Click on the images below or open the table to the right to see Thorlabs’ complete selection of optics made from CaF2.
| F2 Specifications | |
|---|---|
| Index of Refractiona |
|
| Refractive Index at d-Line (587.6 nm)a | 1.620 |
| Sellmeier Equationa | 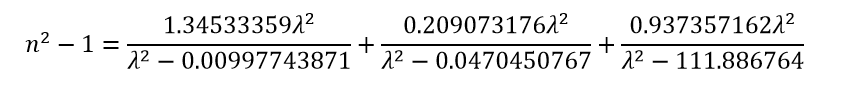 |
| Abbe Number (Vd) | 36.37 |
| Attenuation Coefficient |  |
| Transmission Range | 385 nm - 2 µm |
| Fresnel Reflectance and Transmittance (Calculated) |
 |
| Density | 3.6 g/cm3 |
| Knoop Hardness (100 g Load) | 420 kg/mm2 |
| Young's Modulus | 57 GPa |
| Shear Modulus (Calculated Value) | 23.4 GPa |
| Bulk Modulus (Calculated Value) | 33.9 GPa |
| Poisson's Ratio | 0.22 |
| Coefficient of Thermal Expansion | 8.2 x 10⁻⁶ /°C |
| Heat Capacity | 0.557 J/(g*K) |
| Softening Point | 434 °C |
| Change in Index of Refraction with Temperature (+20/+40 ºC @ 1060 nm) |
2.7 x 10⁻⁶ /°C |
| F2 Optics Selection |
|---|
F2 is a flint glass that offers excellent performance in the visible and NIR spectral ranges. It is is characterized by a high refractive index and low Abbe number, making it excellent for use as an equilateral dispersive prism. Compared to N-SF11, it offers superior chemical resistance and slightly higher transmission. F2 has a transmission range from 385 nm to 2 µm and a refractive index of 1.620 at 587.6 nm.
Click on the images below or open the table to the right to see Thorlabs’ complete selection of optics made from F2.

| Germanium Specifications | |
|---|---|
| Index of Refractiona |
 |
| Index of Refraction at CO2 Line (10.6 µm)a | 4.004 |
| Sellmeier Equationa | 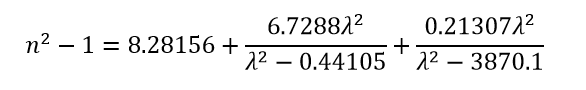 |
| Abbe Number (Vd) | Not Defined |
| Transmission Range | 2.0 - 16 µm |
| Fresnel Reflectance and Transmittance (Calculated) |
 |
| Density | 5.33 g/cm3 |
| Knoop Hardness | 780 kg/mm2 |
| Young's Modulus | 102.7 GPa |
| Shear Modulus | 67.04 GPa |
| Bulk Modulus | 77.2 GPa |
| Poisson's Ratio | 0.278 |
| Coefficient of Thermal Expansion | 6.1 x 10⁻⁶ /°C |
| Heat Capacity | 0.310 J/(g*K) |
| Melting Point | 936 °C |
| Change in Index of Refraction with Temperature (@ 10.6 μm) |
277 x 10-6 /°C |
| Germanium Optics Selection |
|---|
Due to its broad transmission range (2.0 - 16 µm) and opacity in the visible portion of the spectrum, Germanium (Ge) is well suited for IR laser applications. This makes it an ideal choice for biomedical and military imaging applications. In addition, Ge is inert to air, water, alkalis, and acids (except nitric acid). Germanium's transmission properties are highly temperature sensitive; in fact, the absorption becomes so large that germanium is nearly opaque at 100 °C and completely non-transmissive at 200 °C. Ge has an index of refraction of 4.004 at 10.6 µm.
When handling optics, one should always wear gloves. This is especially true when working with germanium, as dust from the material is hazardous. For your safety, please follow all proper precautions, including wearing gloves when handling this material and thoroughly washing your hands afterward. Click here to download a pdf of the MSDS for germanium.
Click on the images below or open the table to the right to see Thorlabs’ complete selection of optics made from germanium.

| Magnesium Fluoride Specifications | |
|---|---|
| Index of Refractiona |
 |
| Index of Refraction at d-Line (587.6 nm)a | ne = 1.390 no = 1.378 |
| Sellmeier Equation, Extraordinarya | 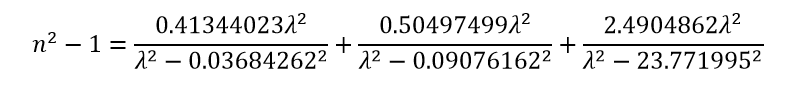 |
| Sellmeier Equation, Ordinarya | 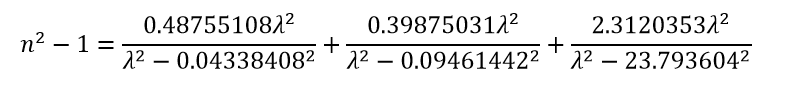 |
| Abbe Number (Vd), Extraordinary | 104.86 |
| Abbe Number (Vd), Ordinary | 106.22 |
| Transmission Range | 200 nm - 6.0 µm |
| Fresnel Reflectance and Transmittance, Extraordinary (Calculated) |
 |
| Fresnel Reflectance and Transmittance, Ordinary (Calculated) |
 |
| Density | 3.177 g/cm3 |
| Knoop Hardness | 415 kg/mm2 |
| Young's Modulus | 138.5 GPa |
| Shear Modulus | 54.66 GPa |
| Bulk Modulus | 101.32 GPa |
| Poisson's Ratio | 0.276 |
| Coefficient of Thermal Expansion | 13.70 x 10⁻⁶ /°C (Parallel) 8.48 x 10⁻⁶ /°C (Perpendicular) |
| Heat Capacity | 1.003 J/(g*K) |
| Melting Point | 1255 °C |
| Change in Index of Refraction with Temperature (@ 400 nm) |
2.3 x 10⁻⁶ /°C (Parallel) 1.7 x 10⁻⁶ /°C (Perpendicular) |
| Magnesium Fluoride Optics Selection |
|---|
Magnesium Fluoride (MgF2) is a synthetic crystalline substrate, transparent over a wide range of wavelengths. Transmitting from 200 nm to 6.0 µm, magnesium fluoride is well suited for applications ranging from the UV to the IR. MgF2 is very rugged and durable, making it useful in high-stress environments. It is commonly used in machine vision, microscopy, and industrial applications. Magnesium fluoride has an ordinary refractive index of 1.378 and an extraordinary refractive index of 1.390 at 587.6 nm.
Click on the images below or open the table to the right to see Thorlabs’ complete selection of optics made from MgF2.
| N-BK7 Specifications | |
|---|---|
| Index of Refractiona |
 |
| Index of Refraction at d-Line (587.6 nm)a | 1.517 |
| Sellmeier Equationa | 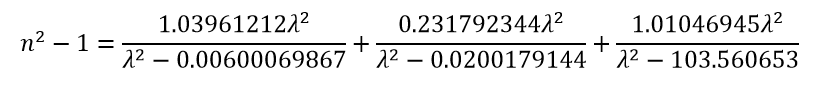 |
| Abbe Number (Vd) | 64.17 |
| Attenuation Coefficient |  |
| Transmission Range | 350 nm - 2.0 µm |
| Fresnel Reflectance and Transmittance (Calculated) |
 |
| Density | 2.51 g/cm3 |
| Knoop Hardness | 520 kg/mm2 |
| Young's Modulus | 82 GPa |
| Shear Modulus (Calculated Value) | 34.0 GPa |
| Bulk Modulus (Calculated Value) | 46.5 GPa |
| Poisson's Ratio | 0.206 |
| Coefficient of Thermal Expansion | 7.1 x 10⁻⁶ /°C |
| Heat Capacity | 0.858 J/(g*K) |
| Softening Point | 550 °C |
| Change in Index of Refraction with Temperature (+20/+40 °C @ 1060 nm) |
2.4 x 10⁻⁶ /°C |
| N-BK7 Optics Selection |
|---|
N-BK7 is a RoHS-compliant borosilicate crown glass. It has excellent transmission in the visible and near IR portions of the spectrum (350 nm - 2.0 µm). N-BK7 is probably the most common optical glass used in high-quality optical components. N-BK7 is a hard glass that can withstand a variety of physical and chemical stressors. It is relatively scratch and chemical resistant. It also has a low bubble and inclusion content, making it a useful glass for precision lenses. The index of refraction of N-BK7 is 1.517 at 587.6 nm.
Click on the images below or open the table to the right to see Thorlabs’ complete selection of optics made from N-BK7.
| N-F2 Specifications | |
|---|---|
| Index of Refractiona |
|
| Refractive Index at d-Line (587.6 nm)a | 1.620 |
| Sellmeier Equationa |  |
| Abbe Number (Vd) | 36.43 |
| Attenuation Coefficient |  |
| Transmission Range | 420 nm - 2 µm |
| Fresnel Reflectance and Transmittance (Calculated) |
 |
| Density | 2.65 g/cm3 |
| Knoop Hardness (100 g Load) | 600 kg/mm2 |
| Young's Modulus | 82 GPa |
| Shear Modulus (Calculated Value) | 33.4 GPa |
| Bulk Modulus (Calculated Value) | 50.2 GPa |
| Poisson's Ratio | 0.228 |
| Coefficient of Thermal Expansion | 7.8 x 10⁻⁶ /°C |
| Heat Capacity | 0.810 J/(g*K) |
| Softening Point | 569 °C |
| Change in Index of Refraction with Temperature (+20/+40 ºC @ 1060 nm) |
2.1 x 10⁻⁶ /°C |
| N-F2 Optics Selection |
|---|
N-F2 is a RoHS compliant flint glass that has been engineered to have nearly identical optical properties as F2 and offers excellent performance in the visible and NIR spectral ranges. It is is characterized by a high refractive index and low Abbe number, making it excellent for use as an equilateral dispersive prism. N-F2 has a transmission range from 420 nm to 2 µm and a refractive index of 1.620 at 587.6 nm.
Click on the images below or open the table to the right to see Thorlabs’ complete selection of optics made from N-F2.
| N-SF11 Specifications | |
|---|---|
| Index of Refractiona |
 |
| Index of Refraction at d-Line (587.6 nm)a | 1.785 |
| Sellmeier Equationa | 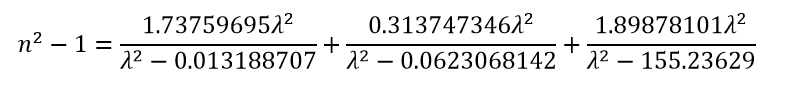 |
| Abbe Number (Vd) | 25.68 |
| Attenuation Coefficient |  |
| Transmission Range | 420 nm - 2.3 µm |
| Fresnel Reflectance and Transmittance (Calculated) |
 |
| Density | 3.22 g/cm3 |
| Knoop Hardness | 615 kg/mm2 |
| Young's Modulus | 92 GPa |
| Shear Modulus (Calculated Value) | 36.6 GPa |
| Bulk Modulus (Calculated Value) | 63.1 GPa |
| Poisson's Ratio | 0.257 |
| Coefficient of Thermal Expansion | 8.5 x 10⁻⁶ /°C |
| Heat Capacity | 0.710 J/(g*K) |
| Softening Point | 592 °C |
| Change in Index of Refraction with Temperature (+20/+40 °C @ 1060 nm) |
0.1 x 10⁻⁶ /°C |
| N-SF11 Optics Selection |
|---|
| Spherical Lenses | Plano-Concave | Uncoated |
| A Coated (350-700 nm) | ||
| B Coated (650-1050 nm) | ||
| C Coated (1050-1700 nm) | ||
| Bi-Concave | ||
| Prisms | Anamorphic Pairs | |
| Equilateral Dispersing | ||
N-SF11 is a RoHS-compliant dense-flint glass that is transparent from 420 nm to 2.3 µm. This glass exhibits higher dispersion than N-BK7 but many of its other properties are comparable. With a high index of refraction and a low Abbe number, N-SF11 has high dispersive power and is ideal for applications in the visible range that require high dispersion. Its index of refraction is 1.785 at 587.6 nm.
Click on the images below or open the table to the right to see Thorlabs’ complete selection of optics made from N-SF11.
| Potassium Bromide Specifications | |
|---|---|
| Index of Refractiona |
 |
| Index of Refraction at CO2 Line (10.6 µm)a | 1.525 |
| Sellmeier Equationa |  |
| Abbe Number (Vd) | 33.64 |
| Transmission Range | 250 nm - 26 µm |
| Fresnel Reflectance and Transmittance (Calculated) |
 |
| Density | 2.75 g/cm3 |
| Knoop Hardness | 7 kg/mm2 |
| Young's Modulus | 26.8 GPa |
| Shear Modulus | 5.08 GPa |
| Bulk Modulus | 15.03 GPa |
| Poisson's Ratio | 0.3 |
| Coefficient of Thermal Expansion | 43 x 10-6 /°C |
| Heat Capacity | 0.435 J/(g*K) |
| Melting Point | 730 °C |
| Change in Index of Refraction with Temperature (+20/+40 °C @ 1060 nm) |
-40.83 x 10⁻⁶ /°C |
| Potassium Bromide Optics Selection |
|---|
Potassium Bromide (KBr) is transparent from the UV to the IR (250 nm - 26 µm). It has a refractive index of 1.525 at 10.6 µm and is mechanically stable. KBr is commonly used in infrared optical windows as well as InGaAs and liquid sample cells. Common applications include infrared and FTIR spectrophotometry. KBr is soft and hygroscopic, so optical components should be protected from excess moisture such as high humidity environments.
Click on the images below or open the table to the right to see Thorlabs’ complete selection of optics made from KBr.

| PTFE Specifications | |
|---|---|
| Index of Refractiona | 1.4 |
| Sellmeier Equation | - |
| Abbe Number (Vd) | Not Defined |
| Transmission Range | 30 µm - 1 mm |
| Density | 2.2 g/cm3 |
| Knoop Hardness | - |
| Young's Modulus | 1.8 GPa |
| Shear Modulus (Calculated Value) | 0.62 GPa |
| Bulk Modulus (Calculated Value) | 7.5 GPa |
| Poisson's Ratio | 0.46 |
| Coefficient of Thermal Expansion at 20°C | 135 x 10-6 /°C |
| Heat Capacity | 1.3 J/(g*K) |
| Melting Point | 327 °C |
| Change in Index of Refraction with Temperature | - |
| PTFE Optics Selection |
|---|
Thorlabs provides plastic plano-convex lenses made with Polytetrafluoroethylene (Virgin White PTFE), which has a low dielectric constant of approximately 1.96 at 520 GHz and an index of refraction of 1.4. The low dielectric constant of PTFE ensures that the insertion loss is reasonably low.
PTFE is especially useful for application in the Terahertz range, which is defined as the frequency range from 300 GHz to 10 THz, or the wavelength range of 30 μm to 1 mm. The THz band has been gaining popularity in applications such as spectroscopy, astronomy, remote sensing, and in security (THz imaging). The THz band is situated between microwaves and optics on the electromagnetic spectrum. This location influences the mixture of microwave and optical technologies used in the THz band.
Click on the image below or open the table to the right to see Thorlabs’ complete selection of optics made from PTFE.

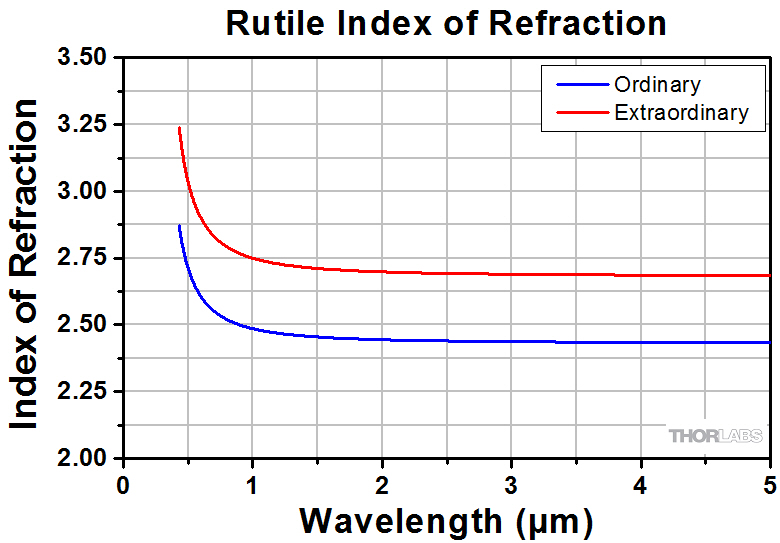
| Rutile Specifications | |
|---|---|
| Index of Refractiona | |
| Index of Refraction at Nd:YAG (1.064 µm)a |
ne = 2.734 no = 2.482 |
| Sellmeier Equation, Extraordinarya |  |
| Sellmeier Equation, Ordinarya | 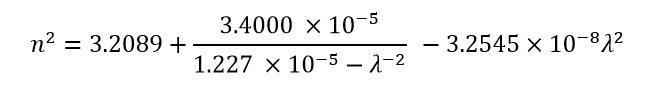 |
| Abbe Number (Vd), Extraordinary | Not Defined |
| Abbe Number (Vd), Ordinary | Not Defined |
| Transmission Range | 500 nm - 4.5 µm |
| Fresnel Reflectance and Transmittance, Extraordinary (Calculated) |
 |
| Fresnel Reflectance and Transmittance, Ordinary (Calculated) |
|
| Density | 4.25 g/cm3 |
| Knoop Hardness | 879 kg/mm2 |
| Young's Modulusb | - |
| Shear Modulus | 112.4 GPa |
| Bulk Modulus | 215.5 GPa |
| Poisson's Ratio | 0.28 |
| Coefficient of Thermal Expansion | 9.2 x 10⁻⁶ /°C (Parallel) 7.1 x 10⁻⁶ /°C (Perpendicular) |
| Heat Capacity | 0.711 J/(g*K) |
| Melting Point | 1840 °C |
| Change in Index of Refraction with Temperature |
-0.42 x 10⁻⁶ /°C (Parallel) -0.72 x 10⁻⁶ /°C (Perpendicular) |
| Rutile Optics Selection |
|---|
Rutile's (TiO2) durability, high refractive index, and strong birefringence make it a useful substrate in the fabrication of polarizers. Our rutile polarizers offer extremely pure polarization of light with a 100,000:1 extinction ratio. They are meant for use with lasers in the 2.2 μm to 4 μm wavelength range and have an air-spaced design. The transmission data above was taken through an uncoated 4 mm thick sample of z-cut rutile. Rutile has an extraordinary refractive index of 2.734 and an ordinary refractive index of 2.482 at 1.064 μm.
Click on the images below or open the table to the right to see Thorlabs’ complete selection of optics made from rutile.

| Sapphire Specifications | |
|---|---|
| Index of Refractiona |
|
| Index of Refraction at Nd:YAG (1.064 µm)a | ne = 1.747 no = 1.754 |
| Sellmeier Equation, Extraordinarya | 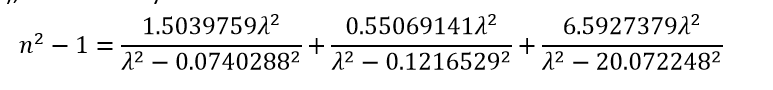 |
| Sellmeier Equation, Ordinarya | 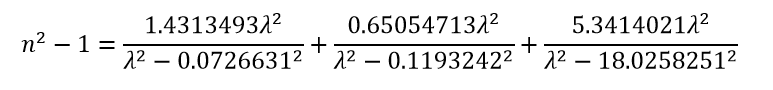 |
| Abbe Number (Vd), Extraordinary | 72.99 |
| Abbe Number (Vd), Ordinary | 72.31 |
| Transmission Range | 200 nm - 4.5 µm |
| Fresnel Reflectance and Transmittance, Extraordinary (Calculated) |
 |
| Fresnel Reflectance and Transmittance, Ordinary (Calculated) |
 |
| Density | 3.97 g/cm3 |
| Knoop Hardness | 2000 kg/mm2 |
| Young's Modulus | 335 GPa |
| Shear Modulus | 148.1 GPa |
| Bulk Modulus | 240 GPa |
| Poisson's Ratio | 0.25 |
| Coefficient of Thermal Expansion | 5.3 x 10⁻⁶ /°C (Parallel) 4.5 x 10⁻⁶ /°C (Perpendicular) |
| Heat Capacity | 0.335 J/(g*K) |
| Softening Point | 1800 °C |
| Change in Index of Refraction with Temperature (@ 0.546 μm) |
13.1 x 10⁻⁶/°C |
| Sapphire Optics Selection |
|---|
Sapphire (Al2O3) has exceptional surface hardness and can only be scratched by a few materials other than itself. This hardness allows it to be made into much thinner optics than other substrates. Sapphire is chemically inert and insoluble to water, common acids, and alkalis for temperatures up to 1,000 °C. Sapphire is transparent in the UV to the IR (200 nm - 4.5 µm). It is commonly used in IR laser systems and has an ordinary refractive index of 1.754 and an extraordinary refractive index of 1.747 at 1.064 µm.
Click on the images below or open the table to the right to see Thorlabs’ complete selection of optics made from sapphire.
| Silicon Specifications | |
|---|---|
| Index of Refractiona |
 |
| Index of Refraction at 4.58 µma | 3.423 |
| Sellmeier Equationa | 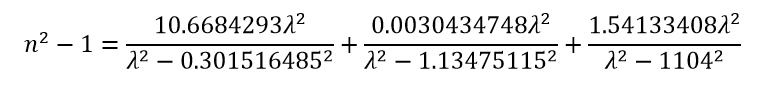 |
| Abbe Number (Vd) | Not Defined |
| Transmission Range | 1.2 - 8.0 µm |
| Fresnel Reflectance and Transmittance (Calculated) |
 |
| Density | 2.329 g/cm3 |
| Knoop Hardness | 1100 kg/mm2 |
| Young's Modulus | 130.91 GPa |
| Shear Modulus | 79.92 GPa |
| Bulk Modulus | 101.97 GPa |
| Poisson's Ratio | 0.28 |
| Coefficient of Thermal Expansion | 2.6 x 10⁻⁶ /°C |
| Heat Capacity | 0.84 J/(g*K) |
| Melting Point | 1690 °C |
| Change in Index of Refraction with Temperature (@ 10.6 μm) |
160 x 10-6 /°C |
| Silicon Optics Selection |
|---|
Silicon (Si) lenses and windows are an ideal choice for applications using wavelengths in the near-IR range and parts of the mid-IR range. Silicon offers high thermal conductivity and low density, making it suitable for laser mirrors. However, since silicon has a strong absorption band at 9 µm, it is not suitable for use with CO2 laser transmission applications. Silicon optics are also particularly well suited for imaging, biomedical, and military applications. Our Quantum Cascade Lasers offer a number of output wavelengths for use with silicon optics. Silicon has a transmission range from 1.2 µm to 8.0 µm. Silicon has a refractive index of 3.423 at 4.58 µm.
Click on the images below or open the table to the right to see Thorlabs’ complete selection of optics made from silicon.
| UV Fused Silica Specifications | |
|---|---|
| Index of Refractiona |
 |
| Index of Refraction at d-Line (587.6 nm)a | 1.458 |
| Sellmeier Equationa | 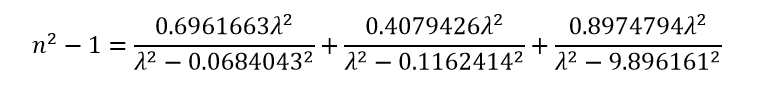 |
| Abbe Number (Vd) | 67.82 |
| Transmission Range | 185 nm - 2.1 µm |
| Fresnel Reflectance and Transmittance (Calculated) |
 |
| Density | 2.203 g/cm3 |
| Knoop Hardness | 461 kg/mm2 |
| Young's Modulus | 73.6 GPa |
| Shear Modulus (Calculated Value) | 31.4 GPa |
| Bulk Modulus (Calculated Value) | 37.2 GPa |
| Poisson's Ratio | 0.17 |
| Coefficient of Thermal Expansion | 0.55 x 10⁻⁶ /°C |
| Heat Capacity | 0.736 J/(g*K) |
| Softening Point | 1585 °C |
| Change in Index of Refraction with Temperature (+20/+40 °C @ 1060 nm) |
11.9 x 10⁻⁶ /°C |
| UV Fused Silica Optics Selection |
|---|

UV-Grade Fused Silica (UVFS) is ideal for use in applications in the UV range that go beyond the transmission of N-BK7. When compared to N-BK7, UV fused silica is transparent over a wider range of wavelengths (185 nm - 2.1 µm) and also offers a lower index of refraction as well as better homogeneity. It is scratch resistant and has a low coefficient of thermal expansion. UV fused silica exhibits minimal fluorescence when exposed to wavelengths longer than 290 nm. Its index of refraction is 1.458 at 587.6 nm.
Click on the images below or open the table to the right to see Thorlabs’ complete selection of optics made from UVFS.
| Yttrium Orthovanadate Specifications | |
|---|---|
| Index of Refractiona | |
| Index of Refraction at Nd:YAG (1.064 µm)a | no = 1.959 ne = 2.166 |
| Sellmeier Equation, Extraordinarya | 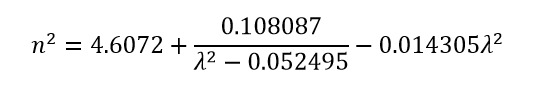 |
| Sellmeier Equation, Ordinarya | 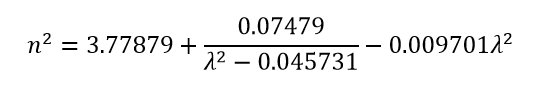 |
| Abbe Number (Vd), Extraordinary | 18.10 |
| Abbe Number (Vd), Ordinary | 20.29 |
| Transmission Range | 488 nm - 3.4 µm |
| Fresnel Reflectance and Transmittance, Extraordinary (Calculated) |
 |
| Fresnel Reflectance and Transmittance, Ordinary (Calculated) |
 |
| Density | 4.23 g/cm3 |
| Knoop Hardness | 480 kg/mm2 |
| Young's Modulus | 133 GPa |
| Coefficient of Thermal Expansion | 11 x 10-6 /°C (Parallel) 4.4 x 10⁻⁶ /°C (Perpendicular) |
| Heat Capacity | 0.51 J/(g*K) |
| Melting Point | 1750 - 1940 °C |
| Change in Index of Refraction with Temperature (@ 632.8 nm) |
2.9 x 10⁻⁶ /°C (Parallel) 8.5 x 10⁻⁶ /°C (Perpendicular) |
| Yttrium Orthovanadate Optics Selection |
|---|
Yttrium Orthovanadate (YVO4) is a positive uniaxial crystal that is primarily used for polarization optics. It has a large birefringence and a wide transparency range that extends into the infrared, making it ideal for IR polarizers.
Click on the images below or open the table to the right to see Thorlabs’ complete selection of optics made from yttrium orthovanadate.

| Zerodur® Specifications | |
|---|---|
| Index of Refractiona | |
| Index of Refraction at d-Line 587.6 nma | 1.542 |
| Sellmeier Equationa | 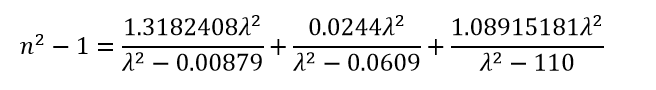 |
| Abbe Number (Vd) | 56.12 |
| Fresnel Reflectance and Transmittance (Calculated) |
 |
| Density | 2.53 g/cm3 |
| Knoop Hardness | 620 kg/mm2 |
| Young's Modulus | 90.3 GPa |
| Shear Modulus (Calculated Value) | 36.4 GPa |
| Bulk Modulus (Calculated Value) | 57.9 GPa |
| Poisson's Ratio | 0.24 |
| Coefficient of Thermal Expansion | 0 ± 0.100 x 10⁻⁶ /°C |
| Heat Capacity | 0.80 J/(g*K) |
| Maximum Application Temperature | 600 °C |
| Zerodur Optics Selection |
|---|
Zerodur® is a glass ceramic with an extremely low coefficient of thermal expansion (CTE). This material is produced by Schott, and is used to manufacture mirrors for demanding applications that are sensitive to thermally-induced drift. Chemically, it is an inorganic, non-porous lithium aluminum silicon oxide glass ceramic that consists of evenly distributed nanoscale crystals in a glass phase. It displays excellent CTE homogeneity and chemical stability, and is frequently utilized in high-precision optical systems. Transmission data and specifications are not provided for Zerodur because Thorlabs only offers reflective Zerodur optics.
Click on the images below or open the table to the right to see Thorlabs’ complete selection of optics made from Zerodur.
| Zinc Selenide Specifications | |
|---|---|
| Index of Refractiona |
 |
| Index of Refraction at CO2 Line (10.6 µm)a | 2.403 |
| Sellmeier Equationa | 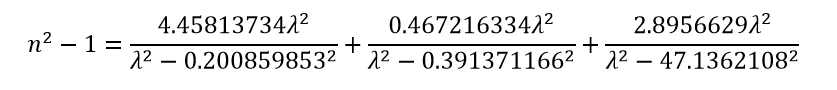 |
| Abbe Number (Vd) | Not Defined |
| Transmission Range | 600 nm - 16 µm |
| Fresnel Reflectance and Transmittance (Calculated) |
 |
| Density | 5.27 g/cm3 |
| Knoop Hardness | 112 kg/mm2 |
| Young's Modulus | 67.2 GPa |
| Shear Modulus* | 34 GPa |
| Bulk Modulus | 40 GPa |
| Poisson's Ratio | 0.28 |
| Coefficient of Thermal Expansion | 7.1 x 10⁻⁶ /°C |
| Heat Capacity | 0.399 J/(g*K) |
| Melting Point | 1520 °C |
| Change in Index of Refraction with Temperature (@ 10.6 μm) |
61 x 10-6 /°C |
| Zinc Selenide Optics Selection |
|---|
Due to its wide transmission band and low absorption in the red portion of the visible spectrum, Zinc Selenide (ZnSe) is commonly used in optical systems that combine CO2 lasers, operating at 10.6 µm, with inexpensive HeNe alignment lasers. Zinc selenide is transparent from 600 nm - 16 µm and is ideal for IR applications. It is also commonly used in thermal imaging systems. ZnSe also transmits some visible light, unlike germanium and silicon, thereby allowing for visual optical alignment. However, it is quite soft and will scratch easily. ZnSe has an index of refraction of 2.403 at 10.6 µm.
When handling optics, one should always wear gloves. This is especially true when working with zinc selenide, as it is a hazardous material. For your safety, please follow all proper precautions, including wearing gloves when handling ZnSe and thoroughly washing your hands afterward. For the MSDS for ZnSe in English, click here, and for the MSDS in Japanese, click here.
Click on the images below or open the table to the right to see Thorlabs’ complete selection of optics made from ZnSe.
Thorlabs offers a wide range of achromatic lenses with wavelength options ranging from 240 nm to 12 µm. The table below lists the various substrates used in Thorlabs' achromatic lenses. Click here to view Thorlabs' full line of achromatic lenses.
| Achromatic Substrate Specifications | ||||||||||||||
|---|---|---|---|---|---|---|---|---|---|---|---|---|---|---|
| Substrate | Uncoated Transmission Range |
Uncoated Transmission Graph |
Attenuation Coefficient |
Abbe Number, Vd |
Density (g/cm3) |
Knoop Hardness (kg/mm2) |
Young Modulus (GPa) |
Shear Modulusa (GPa) |
Bulk Modulusa (GPa) |
Poisson's Ratio |
CTEb (x 10-6 /°C) |
Specific Heat (J/(g*K)) |
Tgc (°C) |
dn/dTd (x 10-6 /°C) |
| CaF2 | 180 nm - 8.0 µm |
|
- | 95.31 | 3.18 | 158 | 75.8 | 33.77e | 82.71e | 0.26 | 18.85 | 0.854 | 1418 | -10.6 |
| UVFS | 185 nm - 2.1 µm |
|
- | 67.82 | 2.2 | 461 | 73.6 | 31.5 | 37.2 | 0.17 | 0.55 | 0.736 | ~1200 | 11.9 |
| N-BK7 | 350 nm - 2 µm |
|
|
64.17 | 2.51 | 610 | 82 | 34.0 | 46.5 | 0.206 | 7.1 | 0.858 | 557 | 2.4 |
| N-K5 | 350 nm - 2.1 µm |
|
 |
59.48 | 2.59 | 3.03 | 71 | 29.0 | 42.9 | 0.224 | 8.2 | 0.783 | 546 | 1.4 |
| N-KZFS5 | 350 nm - 2.1 µm |
|
 |
39.7 | 3.04 | 555 | 89 | 35.8 | 57.7 | 0.243 | 6.4 | 0.73 | 584 | 4.2 |
| N-LAK22 | 350 nm - 2.1 µm |
|
 |
55.89 | 3.77 | 600 | 90 | 35.5 | 64.1 | 0.266 | 6.6 | 0.55 | 689 | 2.4 |
| N-SK2 | 350 nm - 2.3 µm |
|
 |
56.65 | 3.55 | 550 | 78 | 30.9 | 54.9 | 0.263 | 6 | 0.595 | 659 | 3.6 |
| N-SSK2 | 350 nm - 2.3 µm |
|
 |
53.27 | 3.53 | 570 | 82 | 32.5 | 57.2 | 0.261 | 5.8 | 0.58 | 653 | 4.3 |
| N-SSK5 | 350 nm - 2.2 µm |
|
 |
50.88 | 3.71 | 590 | 88 | 34.4 | 66.1 | 0.278 | 6.8 | 0.574 | 645 | 2.2 |
| SF2 | 350 nm - 2.2 µm |
|
 |
33.85 | 3.86 | 410 | 55 | 22.4 | 33.6 | 0.227 | 8.4 | 0.498 | 441 | 2.7 |
| SF5 | 350 nm - 2.3 µm |
|
 |
32.21 | 4.07 | 410 | 56 | 22.7 | 35.0 | 0.233 | 8.2 | - | 425 | 3.5 |
| ZnS | 370 nm - 13 µm |
|
- | 19.86 | 4.09 | 160 | 74.5 | - | - | 0.28 | 6.5 | 0.515 | 1765 | 38.7 @ 3.39 µm |
| FD10 (SF10) | 400 nm - 2.3 µm |
|
 |
28.41 | 4.28 | 430 | 64 | 26.1 | 39.8 | 0.232 | - | 0.465 | 454 | 7.5 |
| LAFN7 | 400 nm - 2 µm |
|
 |
34.95 | 4.38 | 520 | 80 | 31.3 | 60.6 | 0.28 | 5.3 | - | 500 | 6.3 |
| N-BAF10 | 400 nm - 2.1 µm |
|
 |
47.11 | 3.75 | 620 | 89 | 35.0 | 64.8 | 0.271 | 6.2 | 0.56 | 660 | 3.8 |
| N-BAF4 | 400 nm - 2.1 µm |
|
 |
43.72 | 2.89 | 610 | 85 | 34.5 | 52.7 | 0.231 | 7.2 | 0.74 | 580 | 2.2 |
| N-BAF52 | 400 nm - 2.1 µm |
|
 |
46.6 | 3.05 | 2.42 | 86 | 34.8 | 54.5 | 0.237 | 6.9 | 0.68 | 594 | 2.3 |
| N-BAK4 | 400 nm - 2.2 µm |
|
 |
43.72 | 2.89 | 610 | 85 | 34.5 | 52.7 | 0.231 | 7 | 0.74 | 580 | 7.2 |
| N-BALF4 | 400 nm - 2.3 µm |
|
 |
53.87 | 3.11 | 540 | 77 | 30.9 | 50.3 | 0.245 | 6.5 | 0.69 | 578 | 4.2 |
| N-F2 | 400 nm - 2.1 µm |
|
 |
36.36 | 2.65 | 600 | 82 | 33.4 | 50.2 | 0.228 | 7.8 | 0.81 | 569 | 2.1 |
| N-KZFS8 | 400 nm - 2.2 µm |
|
 |
34.7 | 3.2 | 570 | 103 | 41.3 | 68.1 | 0.248 | 7.8 | 0.76 | 509 | 2.4 |
| N-LAK10 | 400 nm - 2 µm |
|
 |
50.62 | 3.69 | 780 | 116 | 45.1 | 90.3 | 0.286 | 5.7 | 0.64 | 636 | 4.2 |
| N-SF1 | 400 nm - 2 µm |
|
 |
29.62 | 3.03 | 540 | 90 | 36.0 | 60.0 | 0.25 | 9.1 | 0.75 | 553 | 0 |
| N-SF2 | 400 nm - 2.3 µm |
|
 |
33.82 | 2.72 | 539 | 86 | 34.9 | 53.3 | 0.231 | 6.7 | 0.69 | 608 | 2.6 |
| N-SF4 | 400 nm - 2.1 µm |
|
 |
27.38 | 3.15 | 520 | 90 | 35.8 | 61.5 | 0.256 | 9.5 | 0.76 | 570 | -0.7 |
| N-SF5 | 400 nm - 2.2 µm |
|
 |
32.25 | 2.86 | 620 | 87 | 35.2 | 55.1 | 0.237 | 7.9 | 0.77 | 578 | 1.8 |
| N-SF6HT | 400 nm - 2.1 µm |
|
 |
25.36 | 3.37 | 550 | 93 | 36.8 | 65.1 | 0.262 | 9 | 0.69 | 589 | -0.8 |
| N-SF8 | 400 nm - 2.1 µm |
|
 |
31.31 | 2.9 | 600 | 88 | 35.3 | 57.5 | 0.245 | 8.6 | 0.77 | 567 | 0.9 |
| N-SF10 | 400 nm - 2.3 µm |
|
 |
28.53 | 3.05 | 540 | 87 | 34.7 | 58.5 | 0.252 | 9.4 | 0.74 | 559 | -0.5 |
| N-SSK8 | 400 nm - 2.1 µm |
|
 |
49.83 | 3.27 | 570 | 84 | 33.6 | 56.2 | 0.251 | 7.2 | 0.64 | 616 | 2.0 |
| SF6HT | 400 nm - 2.3 µm |
|
 |
25.43 | 5.18 | 370 | 55 | 22.1 | 35.8 | 0.244 | 8.1 | 0.389 | 423 | 6.8 |
| SF10 | 400 nm - 2.3 µm |
|
|
28.41 | 4.28 | 430 | 64 | 26.0 | 39.8 | 0.232 | 7.5 | 0.465 | 454 | 5.3 |
| N-SF11 | 420 nm - 2.3 µm |
|
|
25.68 | 3.22 | 615 | 92 | 36.6 | 63.1 | 0.257 | 8.5 | 0.71 | 592 | 0.1 |
| N-SF56 | 450 nm - 2.2 µm |
|
-
|
26.1 | 3.28 | 560 | 91 | 36.3 | 61.9 | 0.255 | 8.7 | 0.7 | 592 | -0.3 |
| N-SF57 | 450 nm - 2.1 µm |
|
 |
23.78 | 3.53 | 520 | 96 | 38.1 | 66.7 | 0.26 | 8.5 | 0.66 | 629 | -0.5 |
| ZnSe | 600 nm - 16 µm |
 |
- | - | 5.27 | 112 | 67.2 | - | 40.0e | 0.28 | 7.1 | 0.399 | 1520 | 61 @ 10.6 µm |
| Silicon | 1.2 µm - 8.0 µm |
 |
- | - | 2.33 | 1150 | 131 | 79.9e | 102.0e | 0.266 | 4.5 | 0.703 | 1417 | 160 @ 10.6 µm |
| Germanium | 2.0 - 16 µm |
 |
- | - | 5.33 | 780 | 102.7 | 67e | 77.2e | 0.28 | 6.1 | 0.31 | 936 | 277 @ 10.6 µm |
| E-BAF11 | - | - |
 |
48.31 | - | 560 | 92.9 | 36.5 | 68.5 | 0.274 | 69 | - | - | 3.9 @ 6.43 nm |
Thorlabs offers molded plastic, molded glass, and precision-polished aspherical lenses. Listed below are the various substrates used in Thorlabs' aspheric lenses. Click here to view Thorlabs' full line of aspheric lenses.
| Aspheric Substrate Specifications | ||||||||||||||
|---|---|---|---|---|---|---|---|---|---|---|---|---|---|---|
| Substrate | Uncoated Transmission Range |
Uncoated Transmission Graph |
Attenuation Coefficient |
Abbe Number, Vd |
Density (g/cm3) |
Knoop Hardness (kg/mm2) |
Young Modulus (GPa) |
Shear Modulusa (GPa) |
Bulk Modulusa (GPa) |
Poisson's Ratio |
CTEb (x 10-6 /°C) |
Specific Heat (J/(g*K)) |
Tgc (°C) |
dn/dTd (x 10-6 /°C) |
| Acrylic | 380 nm - 1.6 µm |
|
- | 52.6 | 1.18 | - | 3.2 | 1.2 | 3.6 | 0.35 | 70 | 1.465 | 100 | -85 |
| D-K59 | 380 nm - 2 µm |
|
- | 63.1 | - | - | - | - | - | - | 6.5 | - | - | 4.3 |
| H-LAK54 | 380 nm - 2.05 µm |
|
- | 51.05 | 4.01 | 770 | 113.87 | 44.0 | 92.1 | 0.294 | 5.2 | 0.528 | 639 | 5.7 @ 1014 nm |
| Polycarbonate | 380 nm - 1.6 µm |
|
- | 27.56 | 1.21 | - | 2.24 | 0.82 | 2.9 | 0.37 | 70.2 | 1.3 | 130 | -107 |
| B270 | 380 nm - 2.1 µm |
|
- | 58.64 | 2.54 | 5.37 | 74 | 30.3 | 44.5 | 0.223 | - | - | - | - |
| Cyclic Olefin Copolymer |
400 nm - 1.50 µm |
|
- | 56 | 1.02 | - | 3.1 | 1.1 | 4.0 | 0.37 | 60 | - | 140 | -101 |
| H-ZLAF52 | 400 nm - 2 µm |
|
- | 40.95 | 4.45 | 650 | 111.46 | 42.6 | 96.3 | 0.307 | 6.2 | 0.507 | 599 | 6.4 @ 1014 nm |
| S-LAH64 | 400 nm - 1.9 µm |
|
- | 47.3 | 4.3 | 750 | 122.4 | 47.3 | 99.0 | 0.294 | 6.1 | 0.491 | 685 | 3.7 @ 1014 nm |
| S-LAL13 | 400 nm - 2 µm |
|
- | 53.34 | 3.6 | 650 | 107.3 | 41.6 | 85.2 | 0.29 | 5.3 | 0.574 | 641 | 4.9 @ 1014 nm |
| TAC4 | 400 nm - 1.9 µm |
|
- | 51.05 | 406 | 765 | 112.5 | 43.3 | 93.8 | 0.3 | 5.2 | 0.528 | 630 | - |
| ECO-550 | 400 nm - 1.7 µm |
|
- | 50.28 | 3.31 | 254 | 55.1 | 27.6 | 18.4 | - | 11.62 | - | 371 | -1.3 |
| N-SF57 | 450 nm - 2 µm |
|
|
23.78 | 3.53 | 520 | 96 | 38.1 | 66.7 | 0.26 | 8.5 | 0.66 | 629 | -0.5 |
| S-NPH1 | 450 nm - 2 µm |
|
- | 22.76 | 3.29 | 460 | 89.3 | 35.72d | 59.5d | 0.25 | 8.3 | - | 552 | -1.8 @ 1014 nm |
| ZnSe | 600 nm - 16 µm |
|
- | - | 5.27 | 112 | 67.2 | N/A | 40e | 0.28 | 7.1 | 0.399 | 1520 | 61 @ 10.6 μm |
| BD-2 | 1.2 µm - 12 µm |
|
- | - | 4.67 | 150 | 22.1 | 11.1 | 7.4 | - | 13.5 | - | 278 | 91 |
| BD-6 | 2 µm - 12 µm | - | - | 4.63 | 156 | 19.8 | 9.9 | 6.6 | - | 22.5 | - | 110 | 30.5 | |
| VIG06 | 1 µm - 12 µm | 0.003 cm-1 @ 10.0 µm |
- | 4.63 | 1.05 | 18.4 | 8 | 8.8 | 0.15 | 20.8 | 0.36 | 183 | 32.1 | |
| D-ZLAF52LA | - |
|
- | 40.73 | 4.56 | 662 | 11.506 | 5.8 | 3.8 | - | 6.9 | - | 546 | 6.5 |
| D-LAK6 | - | - | 52.65 | - | - | - | - | - | - | 7.8 | - | - | 4.6 @ 1014 nm |
|
| D-ZK3 | - |
|
- | 60.71 | 2.83 | 628 | 97.67 | 39.6 | 61.2 | 0.234 | 7.6 | 0.816 | 511 | 2.3 @ 1014 nm |
| Posted Comments: | |
yiduo wang
(posted 2024-08-22 20:04:42.37) Hi, could you provide the polarization response curve of UV fused silica windows (WG41010), is it polarization sensitive? jdelia
(posted 2024-08-23 01:23:14.0) Thank you for contacting Thorlabs. These windows are not polarization sensitive; they are isotopic homogeneous media. As such, we do not have polarization response curves for these products. Luis Vazquez
(posted 2024-05-29 13:46:35.73) Hi,
I will order a couple of UV fused silica windows (WG42012) from your website. However, I would like to know the type of fused silica used for these windows (Suprasil, Corning 7980 or NIFS-U).
Regards, cdolbashian
(posted 2024-06-04 01:41:12.0) Thank you for reaching out to us with this inquiry. These would be Corning 7980 UV fused silica substrate. allan bereczki
(posted 2023-06-12 12:58:31.14) Hello, could you provide the cut orientation (crystalline axis) of the sapphire windows?
thank you cdolbashian
(posted 2023-06-23 08:45:49.0) Thank you for reaching out to us with this inquiry Allan. These windows will be Z-cut. Hannu Henttinen
(posted 2023-03-14 07:59:30.31) Hello, I was wondering, if there is a high-resolution image of the transmission range of optical materials, that I could print as a A3 poster to my cubicle wall, as a shorthand reference.
Thank you. jgreschler
(posted 2023-03-14 11:07:36.0) Thank you for reaching out to Thorlabs, we are looking into this idea and I will be in touch with you to let you know how the conversation progresses. Yazan Lampert Almahmoud
(posted 2022-07-19 23:54:37.823) Dear all,
we were wondering if you provide polished thick Si structure and about the cost of custom dimension such as 100 mm^2 cube or other shapes.
Could you also provide us the lead time for such an order.
Best,
Yazan Lampert-Almahmoud jdelia
(posted 2022-07-22 03:55:14.0) Thank you for contacting Thorlabs. We are contacting you directly to discuss the feasibility of this custom solution. Tom Whitaker
(posted 2021-03-31 18:11:49.167) You specify that the material used for some of your polarizing beamsplitters is N-SF1. In your Optical substrates, you list a number of materials, including N-SF11. Are these the same? I am interested in knowing the refractive index for the beamsplitter at 461 nm. Thanks. YLohia
(posted 2021-04-01 10:58:21.0) Thank you for contacting Thorlabs. N-SF1 and N-SF11 are different glass materials offered by Schott. Please see the Schott website for N-SF1 refractive index information: https://shop.schott.com/advanced_optics/en/Optical-Glass/N-SF1/c/optical-glass/glass-N-SF1 Jon Twichell
(posted 2020-09-21 10:37:10.713) It would be helpful if you included thermal conductivity in your lists of properties of optical substrates. YLohia
(posted 2020-09-21 01:49:38.0) Hello Jon, thank you for your feedback. We will consider adding this information to these tables. nisanns
(posted 2018-05-08 09:49:50.003) The ordinary and extraordinary refractive indices for alpha-BBO in the optical substrates page are both wrong. Should be no=1.6776,ne=1.5534,at 532 nm, as from the referenced Castech site and others. The values at 587.6 nm would not be that much different. YLohia
(posted 2018-05-09 10:04:25.0) Hello, our original citation was for a dispersion formula from Castech, but we have reason to believe that not may be accurate ("Design of a broadband UV–visible alpha-barium borate polarizer", Appel et al.), so we have updated our equations. Thank you for bringing this to our attention. I am working with our Technical Marketing team to remove the previous reference. vandreev
(posted 2016-11-23 05:48:02.6) Dear Thorlabs Technical Support Members,
it would be very useful if you could include the stress-optical coefficients in the technical data of optical substrates.
Best regards,
Vitaly Andreev tfrisch
(posted 2016-11-28 11:13:20.0) Hello, thank you for contacting Thorlabs. I will reach out to you directly about these specs. yao.yue
(posted 2016-11-14 20:00:57.88) Could you provide the raw data for the index of refraction for the materials as well? tfrisch
(posted 2016-11-17 07:30:54.0) Hello, thank you for contacting Thorlabs. I will reach out to you directly about the index curves. duff.howell
(posted 2015-10-22 20:26:40.37) Looking at your information on alpha barium borate (a-BBO) You may have a typo in the Sellmeier equation for the ordinary index of refraction. The first term you list is 2.7471. I have been surveying online information for info on the coefficients, and the primary value shown is 2.7359. Since the other three coefficients of this ordinary index equation, and all four of the coefficients for the extraordinary index match the same publications, it seemed likely to have been a data entry error. myanakas
(posted 2015-10-27 03:43:50.0) Response from Mike at Thorlabs: Thank you for your feedback. 2.7359 is the coefficient used for Beta-BBO, while 2.7471 is the coefficient used for Alpha-BBO. I will contact you directly to discuss the publication you have found. hoochihoo
(posted 2015-08-12 15:19:31.263) Hello. I think i found an error on this webpage:
https://www.thorlabs.de/newgrouppage9.cfm?objectgroup_id=6973&tabname=Calcite
the error is: the y axis of the index of refraction plot doesnt seem to be correct. I noticed because the sellmeier equations that you give below the plot are giving me very different refraction indexes.
Which one of them is correct? The plot or the sellmeier equation? myanakas
(posted 2015-08-12 01:16:35.0) Response from Mike at Thorlabs: Thank your for your feedback. You are correct, the index of refraction plot for our calcite is incorrect. We have now updated this to match what would be given using the Sellmeier equation on the page. |