 Products Home
Compact CMOS Spectrometers
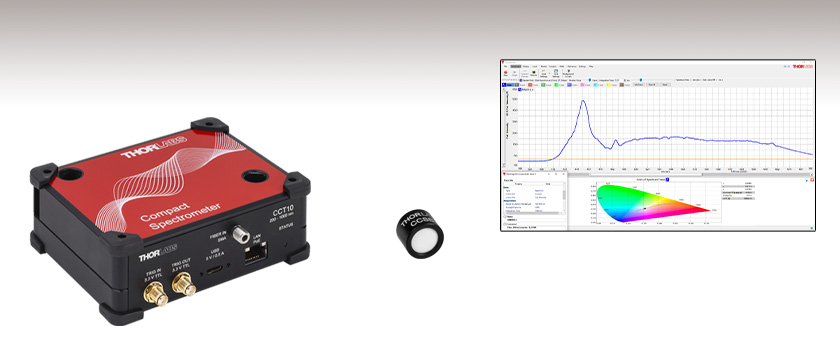
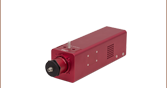
- Three Models for Wavelengths Ranging from 200 to 1000 nm
- Compact Size: 112.0 mm x 93.8 mm x 41.5 mm
- External Trigger Input and Output
- Cosine Correctors Available Separately for Free-Space
Measurements
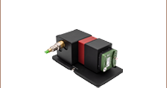
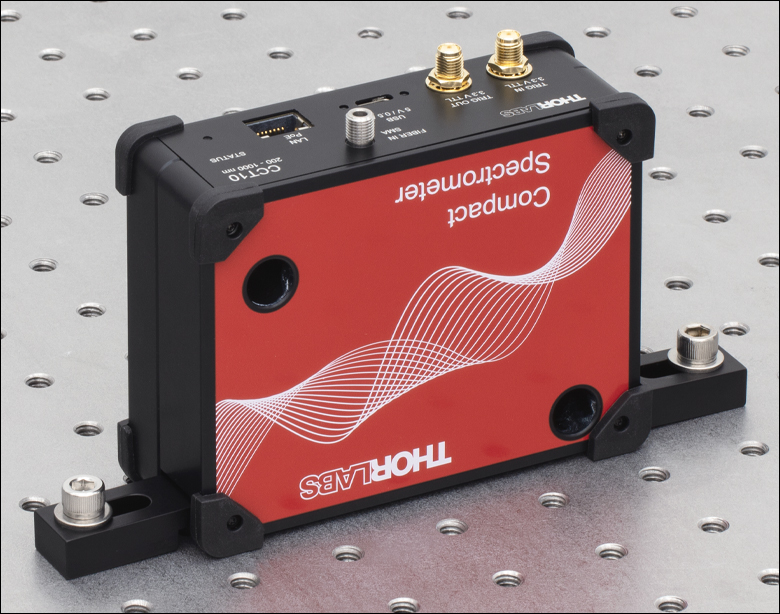
CCT10
200 - 1000 nm Spectrometer,
<2.0 nm Resolution
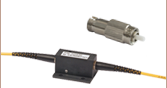
CCSB1
Cosine Corrector for
Thorlabs' CMOS Spectrometers
Versatile Display and Analysis Options
Flexible User Interface


Please Wait
| Item # | CCT10 | CCT11 | CCT12 |
|---|---|---|---|
| Wavelength Range | 200 - 1000 nm | 350 - 700 nm | 500 - 1000 nm |
| Resolution | <2.0 nm | <0.5 nm | <0.6 nm |
| Signal to Noise Ratio | 330:1 | 300:1 | |
| Detector Type | CMOS | ||
| Integration Time | 10 μs - 30 s | ||
Features
- Models for Broadband, Visible, and NIR Spectral Ranges
- Internal Shutter (<10 ms Switching Time) Allows Fast Background Subtraction
- Amplitude Corrected and Wavelength Calibrated
- Input and Output Triggers with Low Jitter (1 μs) for External Synchronization (TTL)
- PC Connection via USB or Ethernet Interface
- Rugged Crossed Czerney-Turner Spectrometer Design
- 2048 or 4096 Pixel CMOS Line Array
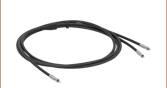
- Includes Multimode Fiber Patch Cable
- Compact Size: 112.0 mm x 93.8 mm x 41.5 mm (4.41" x 3.69" x 1.63")
- Horizontal or Vertical Mounting Options:
- Horizontal Mounting Using Two Through Holes for 1/4"-20 (M6) Screws
- Two Slots for Vertical Mounting with CL4 Clamps
- Cosine Correctors Available Separately Allow Free-Space Input
- Round-to-Linear Fiber Bundles Optimized for Spectrometer Use Available Separately Below
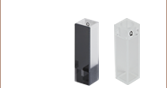
Thorlabs' compact Crossed Czerny-Turner Spectrometers are available in three models that accept input from an SMA-terminated patch cable. The CCT10 spectrometer offers a wide 200 - 1000 nm spectral range with better than 2 nm resolution. The CCT11 and CCT12 spectrometers have sub-nanometer resolution; one provides detection in the 350 - 700 nm range and the other in the 500 - 1000 nm range, respectively. With dimensions of 112.0 mm x 93.8 mm x 41.5 mm that measure roughly the size of a portable hard drive, the performance of these spectrometers is ideal for educational, research, and OEM applications and for fiber-based systems. Each unit comes wavelength calibrated and amplitude corrected and is shipped with a calibration report and test data.
Although small, these units share features with larger, more expensive spectrometers, such as the ability to be synchronized with other devices via TTL trigger input or output and to automatically compensate for the background from the dark current. Both the input and output triggers have low jitter (1 µs), and can be used for applications which require precise timing, such as Laser-Induced Breakdown Spectroscopy.
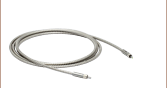
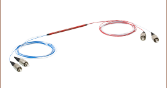
Each spectrometer ships with a 2 m high-speed USB 2.0 type-A to type-C cable and a 2 m long fiber optic patch cable with SMA905 connectors; see the Specs tab for the fiber type included with each spectrometer. These spectrometers are factory calibrated and amplitude corrected with the included patch cable prior to shipment.
Mounting Options
For ease and stability of mounting, our compact CMOS spectrometers are each equipped with two holes through the housing for horizontally mounting to optical tables with 1/4"-20 (M6 x 1.0) screws. Additionally, the spectrometers have two slots for use with CL4 clamps for vertical mounting, as shown in the image to the left.
Software Package for CCT Series Spectrometers
The ThorSpectra software package provides full control of the CCT series spectrometers by a PC with a USB type-B input port, using the included cable, or an Ethernet input port. If a USB type-A input port to the PC that will be used to control the spectrometer is not available, any shielded USB type-C cable can be used to connect the spectrometer to a USB type-C input port on the PC.
The software package features a graphical user interface (GUI) and a set of drivers for .NET, Python, and NI LabVIEWa. The GUI can display the spectra, background, and peaks in a single window if desired. Additionally, diverse algorithms can be applied for smoothing, averaging, or calculating absorption and transmission. The measurement results can be compared with other stored profiles. If a calibrated spectral source is available, a user wavelength calibration can be performed; the user can then select either the user or factory calibration.
Please see the User Interface tab for more details. The drivers included in the software package allow for complete functional control of the spectrometers featured here, allowing the user to design his or her own interface software or to integrate the unit with a test and measurement setup for automated testing. The link to download the software can be found on the Software tab. This software package can also control Thorlabs' optical spectrum analyzers, although a separate software download is required for each instrument series in order to install the necessary device drivers.
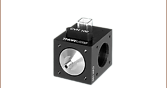
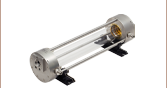
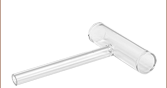
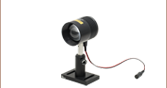
Cosine Correctors
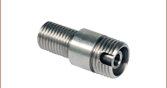
Thorlabs cosine correctors (available below) are designed to mate with either an SMA connectorized fiber or the input port of our CCT series spectrometer. They feature diffusers at the input apertures and allow the spectrometers to be used for free-space measurements.
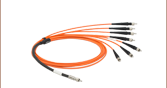
Fiber Bundles
In addition to the SMA-to-SMA patch cable included with each spectrometer (detailed above), Thorlabs offers linear-to-round fiber bundles, which are sold below. These bundles are optimized for use with spectrometers and have a linear fiber array on the spectrometer side of the cable, which matches the geometry of the spectrometer slit. This provides higher signal levels in the spectrometer. See the Bundles vs Cables tab for details.
Thorlabs also offers a large selection of alternative fiber optic patch cables and bundles that may be purchased separately. For example, the M16L01 SMA-to-FC/PC-connectorized cable contains the same fiber as the M14L02 patch cable included with our CCT12 spectrometer. Our reflection probe fiber bundles are a single-cable solution that connects to the spectrometer, light source, and sample for reflection spectroscopy applications (see the Application tab for details). We also offer custom patch cables, which can be ordered here.
For accurate measurements, Thorlabs recommends updating the amplitude correction when using a different patch cable than the one included with the spectrometer through our recalibration service.
Recalibration Service for CCT Series Spectrometers
Thorlabs recommends recalibrating these spectrometers every 12 months and offers a factory recalibration service that includes wavelength calibration and amplitude correction. Although a user wavelength calibration can be performed in the software, amplitude correction requires a factory recalibration. If a replacement or alternative patch cable is used with the spectrometer, Thorlabs recommends factory recalibration using the new cable to update the amplitude correction. To order this service, scroll to the bottom of the page and select Item # CAL-CCT.
All technical data are valid at 23 ± 5 °C, at 45 ± 15% relative humidity (non-condensing), and when the spectrometer is used in combination with the included fiber patch cables.
| Item # | CCT10 | CCT11 | CCT12 |
|---|---|---|---|
| Optical Specs | |||
| Wavelength Range | 200 - 1000 nm | 350 - 700 nm | 500 - 1000 nm |
| Resolution | <2.0 nm | <0.5 nm | <0.6 nm |
| Slit (W x H) | 20 µm x 1 mm | ||
| Number of Pixels on Detector | 2048 | 4096 | |
| Detector Technology | CMOS | ||
| Dark Noise (RMS) | 12 Counts | 14 Counts | |
| Scan Rate (GUI Limited) | 35 Hz | ||
| Stray Light | 0.2 % | 0.3% | |
| Internal Shutter Switching Time | <10 ms | ||
| Fiber Connector | SMA 905 | ||
| Sensor Specs | |||
| Integration Time | 0.01 - 30 000 ms (10 µs - 30 s) | ||
| Internal Average | 10 000 frames | ||
| Signal to Noise Ratio | 330:1 | 300:1 | |
| Dynamic Range | 5100 | 4500 | |
| Trigger Specs | |||
| Trigger Input and Output Connectors | Female SMA Connectors | ||
| Trigger Level | 3.3 V TTL | ||
| Trigger Jitter | 1 µs | ||
| General Specs | |||
| Interface | USB 2.0 or Higher, Ethernet IPv4 | ||
| Operating Temperature Rangea | 0 °C to 40 °C | ||
| Storage Temperature Range | 0 °C to 40 °C | ||
| Dimensions (L x W x H) | 112.0 mm x 93.8 mm x 41.5 mm (4.41" x 3.69" x 1.63") | ||
| Weight | 0.5 kg (1.1 lbs) | ||
| Included Patch Cable | |||
| Patch Cable Item #b | M111L02 | - | M14L02c |
| Fiber Item # | FG105ACA | FG050UGA | FG050LGA |
| Core Diameter | 105 +1/-3 µm | 50 ± 1 µm | |
| Cladding Diameter | 125 +1/-2 µm | ||
| Coating Diameter | 250 ± 10 µm | ||
| NA | 0.22 ± 0.02 | ||
| Wavelength Range | 180 to 1200 nm | 250 to 1200 nm | 400 to 2400 nm |
| Connectors | SMA905 | ||
| Patch Cable Length | 2 m | ||
Graphical User Interface

Click to Enlarge
CCT Series Spectrometer GUI Peak Track Analysis Tool
The Peak Track analysis tool tracks the position, amplitude, and width of peaks in the spectrum over time.
Features
- Operates up to 10 Devices Simultaneously
- Auto-Detection of Compatible Devices
- Normalized Y Axis
- User Selectable Colors and Shapes for Each Spectral Trace
- Persistence Option Allows Visualization of Spectral Changes Over Time
- Saving and Retrieval of Scans (JCAMP-DX or CSV)
- Copy Data to Clipboard Function
- Printable Windows
- Tabbed or Floating Windows
- User Wavelength Calibration
- Polynomial or Gaussian Data Fitting
- Available Filters: Peak Finder, Smoothing, Averaging, Flip/Revert Picture
- Algorithms: Gaussian Transformation, Absorbance, Transmittance and Relative Difference Measurement
Adjustable Parameters
- Integration Time
- Trigger Modes: Internal, External, Continuous, Single Shot
- Averaging Method: Gliding or Block Average
- Smoothing Method: Block Smoothing
- Display Mode: nm or Pixel
The CCT Series Spectrometers feature an easy-to-use software package with a graphical user interface. The package is designed for laboratory and manufacturing applications. The data, background, and peaks can be shown in a single graph. With the help of smoothing and averaging algorithms the user is able to enhance specific features of the spectra. Furthermore, the software is able to handle several devices at one time, with the output from all of the devices presented in a single graph.
The screenshot to the upper right shows the Peak Track analysis mode, which allows the position, amplitude, and width of peaks in the spectrum to be tracked over time. As long as track peak mode is active, the track peak analysis area will be displayed below the graph. A table with information on each peak is to the lower right while the lower left of the screen contains a small toolbox used to set the criteria for identifying the peaks.
Additionally, Thorlabs provides drivers for .NET, Python, and NI LabVIEW for more specific demands. The software package supports LabVIEW versions 14 and up.
Data Processing
The software allows stored data to be loaded for comparison. This data can be used to calculate and show the absorbance, transmittance, or relative difference view.
Click to Enlarge
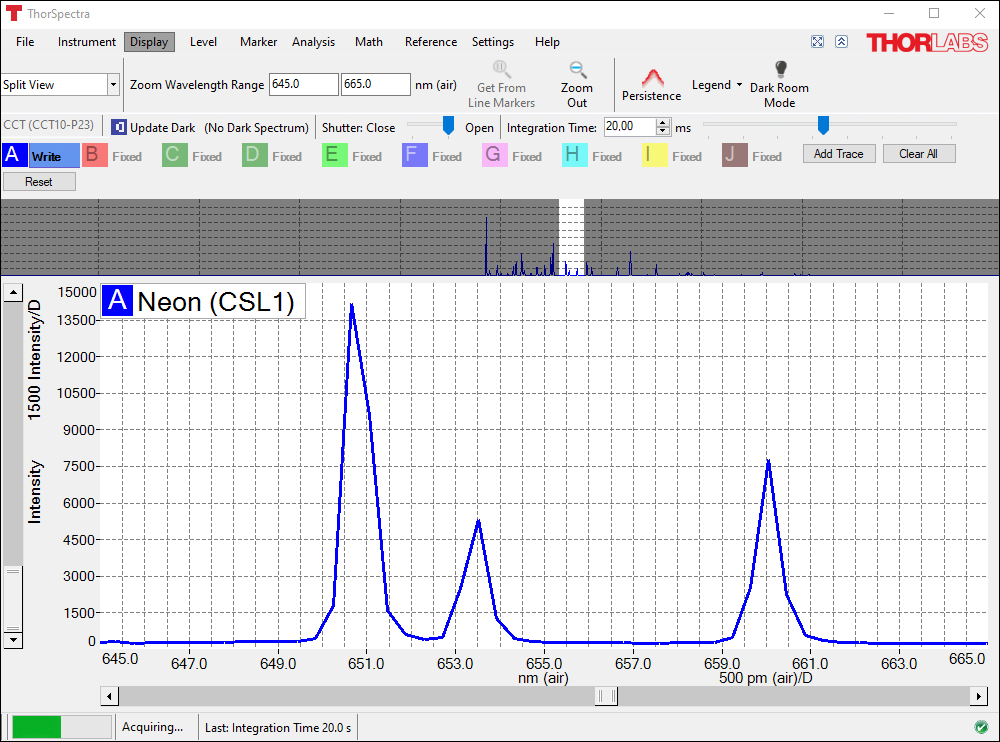
CCT Series Spectrometer GUI Split View Screen
The Split View display option shows the full spectrum at the top of the screen, while a user-selectable portion of the spectrum is shown below.
Click to Enlarge
CCT Series Spectrometer GUI Color Analysis Tool
The Color Analysis tool calculates the chromaticity coordinates and the main wavelength in the spectrum using the CIE 1931, CIE 1960, or CIE 1976 color space.
Software
Version 3.35
This version includes a GUI for controlling the CCT spectrometers, as well as a "virtual device" mode ideal for evaluating the software prior to purchase.
![]()
Software for CCT Spectrometers
The software package for Thorlabs' Compact CCT Series Spectrometers includes a GUI and instrument drivers. For information on writing your own application, including information on additional drivers and tools, see chapter 4 of the CCT Series Spectrometers manual.
This software package can also control Thorlabs' optical spectrum analyzers, although a separate software download is required for each instrument series in order to install the necessary device drivers.
Click to Enlarge
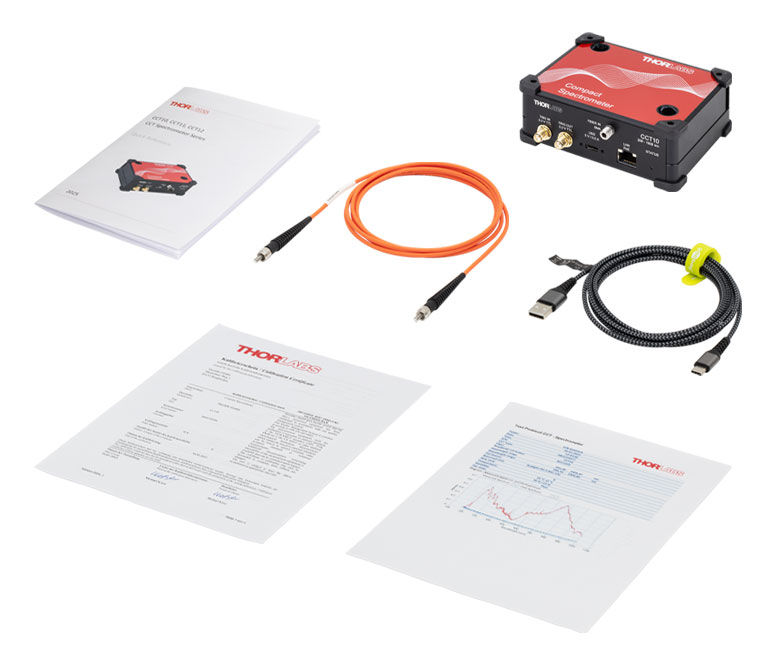
The CCTxx Spectrometer is shipped with an appropriate patch cable, USB cable, and paper copies of the Amplitude Correction Test Report, Certificate of Calibration, and Quick Reference Guide.
The CCT10 Spectrometer contains the following components:
- Compact Spectrometer for 200 - 1000 nm
- M111L02 SMA MM Fiber Patch Cable, NA 0.22, 105 µm Core, 2 m*
- USB 2.0 Type-A to Type-C Cable, 2 m
- Test Report
- Certificate of Calibration
- Quick Reference Guide
The CCT11 Spectrometer contains the following components:
- Compact Spectrometer for 350 - 700 nm
- SMA MM Fiber Patch Cable (Contains FG050UGA Fiber), High OH, NA 0.22, 50 µm Core, 2 m*
- USB 2.0 Type-A to Type-C Cable, 2 m
- Test Report
- Certificate of Calibration
- Quick Reference Guide
The CCT12 Spectrometer contains the following components:
- Compact Spectrometer for 500 - 1000 nm
- M14L02 SMA MM Fiber Patch Cable, Low OH, NA 0.22, 50 µm Core, 2 m*
- USB 2.0 Type-A to Type-C Cable, 2 m
- Test Report
- Certificate of Calibration
- Quick Reference Guide
*Each spectrometer is calibrated with the included patch cable.
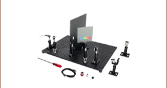
Reflection Spectroscopy Application
Our reflection spectroscopy probes, CMOS spectrometers, lamp-based light sources, and fiber probe holders can be used together to take diffuse reflection, specular reflection, and color measurements.

Spectrometers
Thorlabs offers several CMOS-based spectrometers for use in the visible, NIR, or UV to NIR spectral ranges. The extended-range CCT10 spectrometer operates in the 200 - 1000 nm spectral range with <2.0 nm resolution. The CCT11 and CCT12 spectrometers operate in the 350 - 700 nm or 500 - 1000 nm spectral ranges with <0.5 nm or <0.6 nm resolution, respectively.
Light Sources
The SLS201L tungsten-halogen fiber-coupled light source delivers a 2796 K blackbody-type spectrum in the 360 - 2600 nm wavelength range and has active electronic stabilization for low spectral and intensity drift. Alternatively, the SLS203F Globar fiber-coupled light source provides a 1500 K temperature and 500 - 9000 nm emission range. We also offer fiber-coupled LEDs available with a selection of peak wavelengths or a broadband white-light emission spectra and our line of fiber-coupled laser sources offers a selection of options for intense single-wavelength illumination.
 Click to Enlarge
Diffuse Measurement Taken at 45° Using RPH Holder Block
Reflection Probe Fiber Bundles
Thorlabs offers reflection probes with either high-OH or low-OH multimode fiber for wavelengths from 250 - 1200 nm and 400 - 2400 nm, respectively. Probes are available with a sample end that terminates in either a Ø1/4" probe or an SMA905 connector. We also offer Ø1/4" and SMA-terminated probes with linear fiber bundle spectrometer ends that provide increased spectrometer coupling efficiency for samples with low reflectance. See the Bundles vs Cables tab for details.
If the coaxial illumination provided by a reflection probe bundle is not critical, separate fiber patch cables or bundles with SMA connectors can be used for illumination and signal collection. Our large-core round bundles maximize illumination intensity, while our single-fiber multimode SMA patch cables are useful for precise illumination, or for connection to a fiber-coupled laser. We also offer round-to-linear fiber bundles, which maximize signal strength at the spectrometer.
Reflection Probe Holders
Thorlabs offers the RPS and RPS-SMA fiber probe stands (RPS-SMA shown above and to the right), which allow for precise, stable positioning of the fiber optic probe at an angle of 90° or 45° relative to the sample. The probe holder arms (also sold separately) can also be integrated into other optomechanical setups using Ø1/2" posts. Alternatively, the RPH and RPH-SMA probe holder blocks sit directly on a sample, allowing the fiber tip to be positioned close to the surface and also blocking out room lights from the area under test.
Linear Fiber Bundles vs. Single-Fiber Patch Cables
Entrance Slit Throughput Comparison
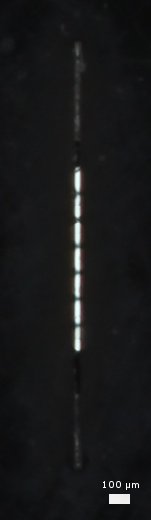
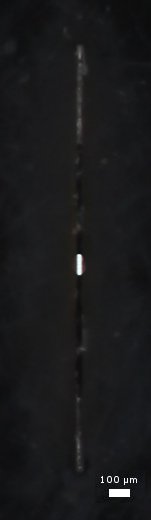
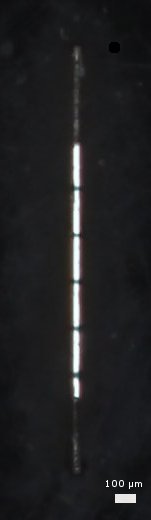
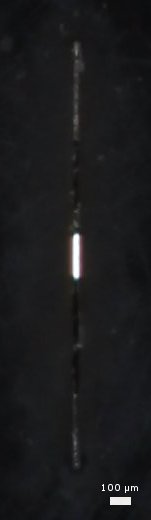
Our linear fiber bundles (sold below) can be used in place of the single-fiber patch cables included with these spectrometers to provide a significant increase in signal strength. The images below show how light exiting a linear fiber bundle more closely matches the geometry of the spectrometer's entrance slit than that from a standard patch cable. The accompanying graphs show comparison spectra of an SLS201L broadband light source measured with a CCT10 spectrometer when using a linear bundle versus a standard patch cable. As shown in the graphs below, the Ø105 µm core linear bundles provide a maximum power increase of ~50% versus a comparable single-fiber cable, while the Ø200 µm core linear bundles provide a maximum power increase of ~70%.
Note that, if a replacement or alternative patch cable or fiber bundle is used with the spectrometer, Thorlabs recommends factory recalibration using the new cable to update the amplitude correction.
Ø105 µm Core Cable Comparison
Click to Enlarge
Click to Enlarge
Left: Light exiting the end face of a BFL105LS02 linear bundle placed behind the 20 µm x 1 mm entrance slit of the spectrometer.
Right: Light exiting the end face of an M111L02 fiber patch cable placed behind the 20 µm x 1 mm entrance slit of the spectrometer.
Click to Enlarge
Comparison of the spectra of an SLS201L broadband light source obtained with a CCT10 spectrometer when using the BFL105LS02 linear fiber bundle versus an M111L02 single-fiber patch cable. The linear bundle provides a ~50% increase in maximum signal strength.
Ø200 µm Core Cable Comparison
Click to Enlarge
Click to Enlarge
Left: Light exiting the end face of a BFL200LS02 linear bundle placed behind the 20 µm x 1 mm entrance slit of the spectrometer.
Right: Light exiting the end face of an FG200UCC fiber patch cable placed behind the 20 µm x 1 mm entrance slit of the spectrometer.
Click to Enlarge
Comparison of the spectra of an SLS201L broadband light source obtained with a CCT10 spectrometer when using the BFL200LS02 linear fiber bundle versus an FG200UCC single-fiber patch cable. The linear bundle provides a ~70% increase in maximum signal strength.
| Posted Comments: | |
Patrick Roumayah
(posted 2025-04-24 15:39:41.757) Is a custom version of the Compact CMOS Spectrometer available that is able to measure up to 1080 nm?
Thank you
Pat nreusch
(posted 2025-04-25 02:16:42.0) Thank you for your question! Yes, such a customization is available. I will contact you with further information and to provide a quotation. Güven Turgut
(posted 2025-04-25 03:03:08.757) I have micro-reflectance setup to measure excitonic absorption properties of 2D materials. But I could not get any useful spectra. Do I need to do anything for first measurement, for example calibration or similar thing? nreusch
(posted 2025-04-25 02:04:23.0) Thank you for reaching out! Our spectrometers are shipped with calibration. You should have received a calibration report as well. For troubleshooting I recommend testing the overall functionality of the spectrometer first, i.e. whether you can measure the spectrum of a lamp or LED using ThorSpectra. If everything is working as expected, I would then start to take test measurements in your actual setup and with your own software (if applicable). Systematically adding more complexity should help you to resolve the issue. I will contact you for further assistance. Benjamin Feldtman
(posted 2025-04-16 23:36:28.837) I have a traceable radiance calibration source and would like to be able to update the amplitude correction data on my CCS200. Is it possible to apply a user generated amplitude correction? hkarpenko
(posted 2025-04-17 06:20:36.0) Dear Benjamin,
thank you for your feedback. It´s only possible to input a wavelength user calibration. The amplitude correction is not accessible for the user and is done during the manufacturing of the device. I will contact you directly to discuss this further with you. Manyong Park
(posted 2025-04-15 14:07:45.467) What is the minimum optical power or irradiance that can be detected in your spectrometer ? I cannot find this in your spec table. user
(posted 2025-04-10 12:13:59.49) I am using the CCS200 Spectrometer. Recently the software stopped recognizing it. It showing in the list of connected devices in Windows settings though. I reinstalled and updated the software but the issue is still there. jjadvani
(posted 2025-04-14 05:36:24.0) Dear user, thank you for contacting Thorlabs. This could happen because of change in operating system or driver setting. I will contact you directly to troubleshoot your issue. Gauthier Briere
(posted 2025-03-31 11:56:38.893) Hello, CCS100 bought recently here. Great tool! Unfortunately the Chromaticity analysis does not work and I cannot find why? Could you suggest some ideas why? It is supposed to work in visible range... hkarpenko
(posted 2025-04-01 07:35:57.0) Dear customer,
thank you very much for your feedback. If you are referring to the color analysis mode, then yes it should work, if you have the amplitude correction enabled. I will contact you directly to discuss your issue in detail with you. Andrey Kuznetsov
(posted 2025-03-11 14:21:41.813) Is there a reason CCSA1 was designed with 7.5mm outside dia instead of the 6.3mm dia that Ocean Optics cosine correctors use? Thorlabs doesn't offer a light calibration product for their cosine correctors, however Ocean Optics does with their HL3-CAL product line, but it only accepts 6.3mm dia cosine corrector... so Thorlabs CCSA1 will not fit inside for calibration. Can't use CCSA1 because cannot calibrate it. jjadvani
(posted 2025-03-13 05:16:30.0) Dear Andrey, Thank you for contacting Thorlabs. I will reach out to you directly in order to discuss your application. user
(posted 2025-02-27 11:39:28.55) How is the straylight measured which is given in the specs? nreusch
(posted 2025-02-28 05:39:31.0) Thank you contacting us! We have used a notch filter to determine the stray light specification. Measuring and calculating the stray light then involved several steps:
First, we measured a dark spectrum, followed by the measurement of a bright spectrum with the notch filter blocking a certain range in the spectrum. Using the intensity values in this blocking region, we then calculated the average intensity for the bright and dark spectrum. As next step, we looked at the onset of the passbands on the left and right side of the blocking region and calculated the average intensity for those two wavelength values. From the average of the bright spectrum blocking region and the average of the onset of the passbands we then subtracted the dark spectrum average to achieve values that are corrected by the dark spectrum average. These values are then used to finally calculate the stray light as follows: The corrected onset of the passband is set to 100% and the corrected average for the blocking region bright spectrum is then the specified stray light ratio. user
(posted 2025-02-24 16:40:25.037) When not using the GUI (e.g. with Python), what is the shortest possible time between two subsequent acquisitions? That does not necessarily have to include the time to transfer the data to the computer if the device has an internal buffer.
The application I am thinking of relates to pump-probe type measurements, where the "pumped" measurement would ideally occur 1ms after the "not pumped" measurement.
The optimum would be if lock-in style measurements would be possible. nreusch
(posted 2025-02-28 04:17:08.0) Thank you for your feedback! Using C# and C drivers, you can perform measurements with up to 300 Hz for CCT10 and up to 150 Hz for CCT11 and CCT12. This is possible using the internal/software trigger as well as an external trigger source as it might be necessary for your application. Markus Hülsbeck
(posted 2025-02-20 08:00:53.093) Hello,
What is the image ratio of the spectrometer and how high are the pixels of the array? I am planning to build a small absorption and PL spectrometer with a small integrating sphere. Is it possible to set the spectrometer or the grating to 500nm and >= 1100nm? What about the 2nd order of the grating? Is it blocked by a filter in front of the sensor?
Thank you
best wishes nreusch
(posted 2025-02-21 02:29:17.0) Thank you for your feedback! The pixel height is 200 µm and we do use a filter in each of the spectrometers. We can offer customizations, but the CMOS sensor we use for e.g. CCT10 does have a low sensitivity above 1000 nm. I will reach out to you to discuss your application and whether we can provide a good solution. Chris James
(posted 2025-02-15 13:30:36.233) hello,
I am looking to load the raw .spf2 data into Python instead of the csv out of the software. Is it possible to get information about how the binary header and the data are stored so I can do that?
Thank you!
Chris nreusch
(posted 2025-02-18 05:05:55.0) Thank you for your feedback! Loading the raw .spf2 data into Python is possible similar to the SDK example #3 in our github repository. Please note that this Python SDK was set up for data saved with one of our OSAs, so slight modifications are needed as the CCS does e.g. not contain a reference laser. I will reach out to you to provide the link and for further discussion. user
(posted 2025-01-07 23:01:39.873) I have a complex optical system with free space components interconnected via fiber with collimation packages. Is it reasonable to use CS100 to measure the combined spectra of free space components this way? Is there a recommended way to couple from multimode FC patch cables and couplers into the spectrometer in such a case? hkarpenko
(posted 2024-10-17 10:50:48.0) Dear Sergio,
thank you very much for your feedback.
Our standard spectrometers like CCS175/M and CCS200/M don´t cover the wavelength ranges above 1000nm. But we can offer a customization to extend the wavelength range up to 1100nm in exchange for cutting the lower range of the spectrum for the same amount.
I will contact you directly to discuss this further with you. Hannes Kurtze
(posted 2024-09-10 12:43:36.32) Dear Thorlabs-team,
we are running a CCS200 for educational purposes. However we can't transfer data from the ThorSpectra software into spreadsheeds like Excel, because the data export utilises the format "2.008e+02" and all solutions we tried so far were not able to detect these data as numbers (but only as text).
==> Is there any solution that ThorSpectra exports data like "200.8" instead or anything readable for spreadsheet calculators?
Kind regards Hannes Kurtze
Phone, if you like: +49 (0) 3496 67 2373 jjadvani
(posted 2024-09-11 03:53:41.0) Dear, Hannes. Thank you for providing feedback. Data can be readily exported to Excel for post-calculation. I will contact you personally to offer support. Kikuchi Rin
(posted 2024-09-09 14:36:24.51) I am conducting research using a CCS100/M to measure absorbance in order to measure oxygen saturation. However, the vertical axis required by the software ThorSpectra is intensity, and I would like to change it to absorbance, but I cannot do so. Please let me know how to do this. achoorakuttil
(posted 2024-09-09 10:50:30.0) Dear Kikuchi Rin,
Thank you for your feedback. It is indeed possible to measure and display absorbance on the Y-axis during measurements. To do this, a fixed background has to be recorded in Trace A while Trace B is set to Write. Trace C could display transmission or absorbance by selecting the calculate tab.
I have personally reached out to provide additional information. yuon song
(posted 2024-07-15 10:35:17.163) Dear thorlabs
I am using compact ccd and software. When using it, permission is required to ensure that the institution can use the software at the university for teaching and research purposes. It's hard to find the content. I would appreciate it if you could provide a document or answer with information on this. soswald
(posted 2024-07-16 11:50:21.0) Dear Yuon Song,
thank you for your feedback.
The use of our software for education and research purposes is absolutely possible.
We have reached out to you directly to provide any necessary documentation that is required by your institution. Ilya Radko
(posted 2024-06-26 00:38:41.97) Good day. I struggle to understand why the suggested fiber patch cable is M14L01 or M151L01 with large core, instead of M68L01. The core size of the latter would match the slit size better to avoid loss of the signal. Do I miss something in my reasoning? I am designing a home-made transmission spectrometer based on Cerna Platform and this compact spectrometer, and would like to optimize signal. jjadvani
(posted 2024-06-26 07:07:41.0) Dear Ilya, Thank you for your feedback. First and foremost, our spectrometer is calibrated using the fiber we give. You are correct in selecting a small core diameter for coupling from fiber to slit, but we must also consider coupling signals from the experimental setup into the fiber. If your core is too small and you are unable to couple enough light into the fiber, there will be insufficient signal after the slit. So, it's a type of trade-off. I will contact you directly to offer further assistance. classified classified
(posted 2024-05-16 20:20:42.66) Hi
i am looking for raman spectrometer for gas
535nm-590nm resolution 0.05nm
can U help me with it ?l
it need to be lightweight ess then 0.5kg soswald
(posted 2024-05-16 11:24:31.0) Thank you for your feedback.
I have reached out to you directly to discuss your application in detail. user
(posted 2024-03-11 15:55:10.757) When using this product with the SPLICCO application, what is the processing that is done onto our incident light, as some values are negative, as well as correction on the other. I am curious as it is part of my final year project at university.
Thank you dpossin
(posted 2024-03-12 02:54:43.0) Dear customer,
Thank you for your feedback. I am reaching out to you directly in order to discuss your application. Joseph Farina
(posted 2024-03-08 13:50:19.5) Hi I have a CCS100 that we haven't used in years so I am trying to see if it's working. When I image in a dark room there's a large peak at 515 nm regardless of what kind of light I am shining on it. I'm trying to figure out if it's fully broken or just needs to be sent back to be recalibrated. Thanks! dpossin
(posted 2024-03-11 03:23:48.0) Dear Joseph,
Thank you for your feedback. The behaviour described most probably comes from hot pixels on the CCD line array. It definitely makes sense to send back the CCD for repair. I am reaching out to you for further support. User
(posted 2024-02-13 20:11:23.66) Hi
I like a CCS175 (500 - 1000 nm) with a better resolution (better then 0.1nm)
can U use another Grating in it say (a 3600 lin/ mm)
thanks soswald
(posted 2024-02-13 07:14:53.0) Hi, thank you for your feedback. If we keep the current footprint of the spectrometer, then using a different grating with higher line density would result in a smaller wavelength range being measured.
I have reached out to you directly to discuss your application in more detail and see which solution would work best for you. user
(posted 2023-12-06 13:49:50.117) Hello, what is Spectral Accuracy of CCS175 spectrometer at 1075 nm (laser line)? soswald
(posted 2023-12-07 03:06:26.0) Thank you for your feedback. The CCS175 only measures from 500 to 1000 nm, so a laser line at 1075 nm would not be recorded in the spectrum. Michael Moyes
(posted 2023-11-04 04:24:18.277) Good day - I have a CCS100 and have a question relating to the Integration Time. This value, is this the integration time per pixel or the total time for a single spectrum capture over the maximum wavelength range? Or other?
I'm using the external trigger and found if the integration time is not a whole number (>=) of the the trigger rate, then I get a fluctuating reading. (The light source, an LED, is pulsed at a much shorter time than the trigger rate).
I have looked at the data sheet for the CCD device however it isn't clear.
Thanks. soswald
(posted 2023-11-06 03:53:46.0) Dear Michael,
thank you for your feedback.
The integration time describes the exposure time of the entire sensor. This value in addition to the 2-5 ms readout time defines the entire time required to acquire a spectrum.
In external trigger mode there is a jitter on the order of magnitude of the integration time, I have reached out to you directly to discuss this in more detail. Hans-Joachim Kühn
(posted 2023-10-11 07:12:30.44) For the CCS200 is specified a value of 2nm for "FWHM Spectral Accuracy" -what is meant by this? Is this the spectral resolution or the absolute accuracy of the displayed wavelength? soswald
(posted 2023-10-12 03:10:19.0) Dear Hans-Joachim,
thank you for your feedback. The <2 nm FWHM @633 nm describes the instrumentally caused line broadening of a much smaller spectral line at this wavelength.
So if you e.g. try to measure a 20 pm FWHM line at 633 nm with the CCS200, it would appear in the measured spectrum with a linewidth of typically about 1.5 nm, we guarantee <2 nm.
This quantity is wavelength dependent, but stays below 2 nm for the entire 200 - 1000 nm spectral range of the instrument. user
(posted 2023-10-10 09:58:07.01) We are measuring spectra from a set of light stimuli including lasers and LEDs ranging from 650nm to 850nm. All of our stimuli (including a white light LED) reliably produce spectra readings except for our 700nm LED. Within a single recording session, we can measure spectra from the rest of our light stimuli, but the 700nm LED. The 700nm LED visibly illuminates, but does not create a spectra at all within the ThorSpectra software. This occurs with and without background correction toggled and regardless of integration time. Any idea as to why we cannot measure the spectra from this one light source? soswald
(posted 2023-10-11 03:51:15.0) Thank you for your feedback. I have reached out to you directly to discuss your measurement setup and the instrument settings in more detail. HB Shin
(posted 2023-07-31 17:11:43.19) Dear,
I am trying to build Raman spectrometer with the CCS175/M.
The light source is 650 nm Laser Diode with 200 mW, and illuminates the target material, polysterene with 45 degree tilted, and the CCS175/M fiber end catch the light through the 700 nm long pass filter, FELH0700 with 45 degree tilted.
It looks simple setup, but no signal comes out.
Does the spectrometer has a sufficient detection limit to catch the Raman signal?
Thanks, soswald
(posted 2023-07-31 04:50:27.0) Dear HB Shin,
thank you for your feedback.
While it is possible, to build simple Raman setups with the CCS spectrometers, we expect much better results with our modular Raman spectroscopy kit: https://www.thorlabs.com/newgrouppage9.cfm?objectgroup_id=14241
I have reached out to you directly to discuss your setup and possible improvements in more detail. Thamer Mohammed
(posted 2023-07-22 19:26:07.82) Hi, I'm trying to use my CCS100/M spectrometer for making color measurements, I have a reflection probe and one of your blue ray laser diode source . The Color says no calibration trace across the visible exists. Can you help? How do I record a calibration spectrum? I thought I could take a spectrum of the laser diode source off a flat, white surface. soswald
(posted 2023-07-24 02:47:33.0) Dear Mohammed,
thank you for your feedback. One possible reason for this error message is that the amplitude correction was not enabled during your measurements, since colour analysis requires amplitude-corrected data.
I have reached out to you directly to discuss this further. user
(posted 2023-07-18 09:50:28.53) Hi, I'm interested in using the compact spectrometer CCS200/M for outdoor analysis of reflected/diffused light in different natural environments. Is the device suitable for such studies? Thanks a lot in advance for the information. soswald
(posted 2023-07-18 07:25:03.0) Dear customer,
thank you for your feedback. The CCS spectrometers are not water resistant, so they need to be protected from adverse weather conditions. The operating temperature is between 0 and +40 °C and the maximum tolerable relative humidity is 80% up to 31 °C; decreasing to 50% at 40 °C.
I have reached out to you directly to discuss your application in detail. Johannes Hinrichs
(posted 2023-07-18 08:12:36.68) Hello, is it possible to perform your recalibration service not only with the fiber, but also with a CCSA2 diffuser attached? soswald
(posted 2023-07-18 09:33:49.0) Dear Johannes,
thank you for your feedback. Unfortunately the transmission of the diffuser is not high enough, so we would not be able to get sufficient intensity from our reference lamp into the spectrometer to perform the amplitude correction with the diffuser attached to the fiber. Sébastien Sanaur
(posted 2023-06-21 16:03:45.7) Hello,
I am looking to purchase equipment in order to make LED luminance (candelas or lumens) measurements. Do you provide calibrated sensors (i.e sensors connetedto the spectrometer) ? in order to get absolute Watts measurements ? If there is not a straightforward way to do it ? Can we do itin combination with photometer ? Thank you Kind Regards. soswald
(posted 2023-06-22 01:59:00.0) Dear Sébastien,
thank you for your feedback. The most straightforward way to make these measurements would likely be a combination of the CCS spectrometer and a calibrated photodiode sensor, both connected to an integrating sphere like 4P3. We can offer these integrating spheres with calibrated photodiodes and also connectors for our power meters as custom items, I have reached out to you directly to discuss the item selection for your particular application in more detail. user
(posted 2023-06-19 12:12:57.38) Question about output normalization of CCS175. Answer not found in feedback/chat below on this site. Request call to discuss live with technical team. soswald
(posted 2023-06-20 03:03:58.0) Thank you for your feedback. I have reached out to you directly to discuss your questions. Gaetan Delmotte
(posted 2023-06-13 13:30:21.747) Good day,
I am working on a project for the CNRS. We recently bought a spectrometer (CCS200L/M) from you for which we need some information about the detector : Tochiba's CCD linear image sensor TCD1304DG. We want to process the results of the spectrometer in such way that they do not depend on its sensitivity according to wavelength. Can we obtain the numerical data of the sensor's (relative) response from at least 200 nm to 1000 nm ?
Best regards. soswald
(posted 2023-06-13 10:40:37.0) Dear Gaetan,
thank you for your feedback. We do measure an amplitude correction curve for every individual CCS200, which not only takes the wavelength dependent responsitivity of the CCD sensor into account, but also components like the optics in the spectrometer.
Please note that this is not an absolute calibration of the spectrometer response and is only done for wavelengths larger than 380 nm.
I have reached out to you directly to provide the data we have and to discuss this further. Charlie M
(posted 2023-04-24 12:20:27.06) Hi,
Given the spectrometer provides relative intesity measurements, what disadvantages are there to using fibres with large (eg 1mm) diameters/larger NA with this spectrometer ? As the current cables you provide (patch cables) are quite small.
Do you expect the incoming beamlet to be an equivalent size to the core diameter, is the intesity of light limited by the entrance slit to the detector?
Also, do you suggest using a collimator to help guide light into the spectrometer fiber or a diffuser, to negate sampling geometry issues?
Thanks soswald
(posted 2023-04-25 04:21:23.0) Dear Charlie,
thank you for your feedback. The light intensity entering the spectrometer is indeed limited by the entrance slit, so using a larger fiber would mostly just lead to more losses at the entrance slit.
If your application requires high sensitivity we recommend using a linear fiber bundle instead to increase the illumination of the entrance slit. Please see also the 'Bundles vs. Cables' tab on the CCS product page for further information on this.
Whether a collimator or a diffusor at the collection end of the fiber is better depends on your application. The diffusor indeed reduces the sampling geometry dependency, but those typically have low transmission. Our cosine correctors for example have around 0.1-0.2% transmission at 660 nm. A collimator can help to increase the light collection, especially if the input beam is collimated as well, but increases the sampling geometry dependency. I have reached out to you directly to discuss your application in detail and provide some recommendations. Michael Moyes
(posted 2023-04-17 09:14:58.17) Good day - I have just placed an order for the CC100 Spectrometer. My requirement is to measure absolute amplitude, in power density units or spectral power density. However reading a few questions posted I get the impression that this is not possible?
To quote from your calibration service section.
"Thorlabs offers a wavelength and amplitude recalibration service for our Compact CCD Spectrometers.".
I need this information as soon as possible because shipment has not yet taken place and perhaps I can still cancel the order. I use a PM20A for spot wavelength amplitude verification, but now I need a full spectrum measurement.
Thank you. soswald
(posted 2023-04-17 09:25:18.0) Dear Michael,
thank you for your feedback. The CCS spectrometer series is indeed not calibrated for absolute power measurements, only a relative amplitude correction to account for different sensitivity of the spectrometer at different wavelengths is applied.
I have reached out to you directly to discuss this further. Adrien Debelle
(posted 2023-03-29 13:52:52.33) Dear, I want to have a precise measure of the light intensity (in mW) of an LED directly oriented towards the sensor. I retrieve the curve but the unit you use on the y-axis "intensity/D" makes no sense to me, and I did not find any explanation in the manual or online. How can I measure the light intensity(in mW, or mW/sr) with the CCS100 ? Thank you. nreusch
(posted 2023-03-30 05:28:49.0) Thank you for your feedback. Unfortunately, it is not possible to measure optical power in mW directly with our current CCS spectrometer series. You would need a power meter as well. I will contact you directly to discuss your application. Viktor Varga
(posted 2023-03-03 13:53:05.42) Dear Sirs,
I want to measure power in the 360-830 nm range in W/cm2/nm.
It is not clear from the user manual if this is possible with the spectrometer and it is also not clear whether the calibration service includes this type of power calibration.
Thank you in advance for your answer!
Best regards,
Viktor Varga soswald
(posted 2023-03-03 09:09:56.0) Dear Victor,
thank you for your feedback. I have reached out to you directly to discuss your application in more detail. Leslie Harvill
(posted 2023-01-22 20:10:46.887) I am using the CCS200 with a Excelitas xenon flash module, and am getting a good response at higher than 373nm. I saw the comments on using longer integration times for UV sensing under 350nm. I am using the CVH100 and can run a separate pass for 200-373, can you suggest a filter and/or setup for this second pass?
Thanks,
Les nreusch
(posted 2023-01-23 10:25:24.0) Dear Les, thank you very much for your question. The spectrometer’s responsivity is indeed lower in the UV range. That leads to the fact that the CCS200 cannot be amplitude corrected below 380 nm as well as the need for a bandpass or shortpass filter to measure features in the UV range when performing broadband measurements. Unfortunately, a filter with a transmission band 200 nm to 380 nm and rejection band from 380 nm into the NIR is a challenge. I will contact you to discuss your application and setup in more detail. Madhav Gupta
(posted 2022-12-08 01:18:11.58) Hi. I am using the CCS175/M. I lost the USB 2.0 Cable A to Mini B, which is provided with the spectrometer.
I purchased another USB2.0 Cable A to mini B from the market, however the spectrometer is not working (Thorlabs OSA Software says "No Spectrometer Found").
Can the spectrometer work with only the USB cable provided by Thorlabs? If that is case, can you ship such a cable to us? We need to use this spectrometer for our measurements.
Please let me know as soon as possible.
Thanks a lot,
Madhav Gupta hchow
(posted 2022-12-08 09:30:08.0) Dear Mr. Gupta, thank you for your question and feedback. Our High-Speed USB 2.0 cables are approved for usage with the CCS175/M. We unfortunately cannot guarantee the performance when a generic USB 2.0 cable is used. In any case, we can provide you the very USB cable used with the CCS175/M. I will reach out to you personally for more information. Thank you. Chen Alfia
(posted 2022-12-01 23:54:21.493) Hello,
I want to purchase the CCS200 with the cosine corrector and I have a few questions about the CCS200 software user interface,
The main graph shown in the datasheet is intensity( the graph shows intensity in percentages) as a function of wavelength, the software can measure also the radiance(W/(m^2*sr))/irradiance as a function of wavelength?
I would be glad if you could send me the optional measures that the CCS200 can measure.
Thank you and have a nice day. wskopalik
(posted 2022-12-02 03:44:14.0) Thank you very much for your feedback!
The CCS series spectrometers are unfortunately not calibrated for absolute measurements which would be necessary for radiance or irradiance measurements.
They have an “Amplitude Correction” feature which means that the spectrum is corrected for the wavelength dependent responsivity of the CCS spectrometer. This is however not an absolute calibration for power or energy, but it is a relative correction for the wavelength dependence, so the unit is still "arbitrary units". You can also disable the “Amplitude Correction”. In this case, you will get the raw spectral data measured by the CCD in the spectrometer.
I will contact you directly to provide further assistance. Netanel Zigdon
(posted 2022-11-29 19:13:08.533) Does this product have the option to work with Matlab directly? hkarpenko
(posted 2022-11-29 11:05:16.0) Dear Netanel,
thank you for your feedback. These spectrometers can be controlled via matlab using the loadlibrary function. I will contact you directly with a manual, that explains this process. Mark Dickinson
(posted 2022-08-12 13:10:24.387) Hi,
I'm trying to use my CCS100/M spectrometer for making color measurements, I have a reflection probe and one of your black body sources (2786K). The Color button is greyed out and it says this is unavailable because no calibration trace across the visible exists. Can you help? How do I record a calibration spectrum? I thought I could take a spectrum of the black body source off a flat, white surface.
Mark dpossin
(posted 2022-08-16 04:29:06.0) Dear Mark,
Thank you for your feedback! Most probably this error message comes up because the amplitude correction is not activated. The amplitude correction compensates for the nonlinearities caused by the optics and responsivity of the line camera. When activated the relative intensity is measured correctly. I reach out to you in order to provide further assistance. user
(posted 2022-06-16 13:46:59.49) Hi,
I am also trying to control the CCS100 spectrometer using Python. I noticed in the comments some other users have asked for help and received additional documentation and example scripts. I am interested in those too! I am using the Anaconda Python distribution and Spyder IDE.
Thanks,
Brett wskopalik
(posted 2022-06-22 03:27:50.0) Thank you very much for your feedback!
We have recently uploaded a Python example for the CCS spectrometers on our GitHub account. You can find the example here:
https://github.com/Thorlabs/Light_Analysis_Examples/tree/main/Python/Thorlabs%20CCS%20Spectrometers
This example uses the ctypes library to load the DLL file for these spectrometers and the Matplotlib library to plot the measured spectrum. I will also contact you directly to provide further assistance. user
(posted 2022-06-09 09:07:01.2) Hello, you state that the spectrometers are amplitude corrected. Does this include a non-linearity calibration? From my understanding, most sensors used in spectrometers have by themselves a linearity of about 96%. By calibrating and fitting correcting coefficients to that, one can achieve a linearity of about 99.8%, which is what some spectrometers of other brands state in their specification. However, I could not find any such information in your datasheets. Could you explain whether you perform non-linearity correction is included in the amplitude correction, and what is the expected linearity? Thank you! hkarpenko
(posted 2022-06-14 08:52:16.0) Thank you very much for your feedback!
Our CCS spectrometers aren´t calibrated regarding the linearity by default. I contact you directly to discuss this with you further. Madhav Gupta
(posted 2022-05-18 15:46:30.677) Hi. I am using CCS175/M.
I wanted to know if the spectrum can be measured, with the y axis showing photon counts per second?
I know how to perform normalised spectrum measurements using this device, but we are interested in performing absolute spectra measurements as well.
By Default, I can set the y axis min and max as well as min=0, and max=1.0* intensity, with each division=0.1 Intensity/div.
In one of the settings, I saw that yAxisUnit=32785. Does this correspond to 32785 photon counts per second?
However, I don't know how much "Intensity" corresponds to in absolute terms. Please let me know if the y axis can be converted to absolute measure, such as photon counts per second.
Please let me know your response as soon as possible.
Thanks a lot,
Madhav Gupta dpossin
(posted 2022-05-18 08:38:11.0) Dear Madhav,
Thank you for your feedback. The CCS is not sensitive enough to resolve single photon events. The value you encountered is just abritary units. Please note that we do not provide calibration on absolute power for our CCS spectrometer. I am reaching out to you in order to discuss the details. Young Bo Shim
(posted 2022-05-05 00:57:33.403) Hello.
For the CCS200 spectrometer,
can I measure the light mixed with UV+VIS+NIR at once, without complicated mixture of 2nd order diffraction signal of the integrated grating? (ex: 400nm peak is measued again at 800nm and so on..)
or do I need extra UV, VIS, NIR pass filters and actively evade the 2nd-orders myself?
thank you wskopalik
(posted 2022-05-05 09:35:16.0) Thank you very much for your feedback!
The CCS200 spectrometers already have a filter coating on the CCD chip to prevent 2nd order signals in the spectrum. You do not need to add any filters yourself.
I will contact you directly to provide further assistance. Duong Vu
(posted 2022-03-17 21:31:20.63) Hi. I am trying to control the CSS200 with python. From the discussion, I found that the ctype lib working with DLLs file may be the most convenience for me. Would you give me some example, tutorial or support docs etc...
Best Regard. GBoedecker
(posted 2022-03-22 10:55:19.0) Dear Duong, thank your for your feedback! Feel free to contact techsupport@thorlabs.com directly for programming examples and assistance.
Please check the manual chapter 5 "Write your own Application" to find the libraries. I will send you a Python example via email. yaakov sharabani
(posted 2022-03-16 23:11:59.603) Hi,
we got the CCS175/m and want to control it with python. can you supply relevant documentation, package, etc.
Thanks wskopalik
(posted 2022-03-23 09:29:41.0) Thank you very much for your feedback!
I will contact you directly and send you the information we have. Martin Buckthorpe
(posted 2022-02-10 08:36:52.477) Hi there. I see in the discussions below that you provide custom versions of these spectrometers that operate up to 1100nm. It would be useful for our applications if we could measure up to this limit. Could you provide a quotation for the different options you provide up to 1100nm please? soswald
(posted 2022-02-11 04:20:20.0) Dear Martin,
thank you for your feedback.I have reached out to you directly to discuss the customization options in more detail. Christoph Gruber
(posted 2022-02-01 07:30:22.903) Hi, I would like to interface with the CCS175 using C++ but I can not find the relevant drivers/documentation. Could you provide them to me?
Best, Christoph wskopalik
(posted 2022-02-03 03:46:03.0) Thank you for your feedback!
There is a chapter in the manual called “Write Your Own Application”. The locations of all available driver files, documentations, and example codes are listed in this chapter. These are saved on the computer during the installation routine.
I will contact you directly to provide further assistance. Ammon Posey
(posted 2022-01-13 17:51:53.52) Hi,
I am confused by some specs listed for the CCS100 compact CCD spectrophotometer. The dynamic range is listed as 300, and the signal to noise ratio is listed as 2000:1. As I understand it, the signal to noise cannot exceed the dynamic range, so I wonder if these values were miscalculated or swapped. I am also comparing this model to some CMOS spectrometers with similar specs, and they list the S/N as ~300 and the dynamic range as ~2000:1 for their devices, so I am wondering if these numbers got swapped on your spec sheet? Any clarification you can provide would be greatly appreciated.
Best,
Ammon dpossin
(posted 2022-01-24 07:41:09.0) Dear Ammon,
Thank you for your feedback. I´ll reach out to you in order to discuss this. Brijesh Kumar
(posted 2021-12-29 07:14:15.34) I am Brijesh Kumar from the physics department at IIT Bombay. We had purchased a CCS175/M (Thorlabs spectrometer). We are not able to connect it with the software. While connecting it shows only one device named CCS200. The green LED (indicating ready) is also not glowing. wskopalik
(posted 2021-12-30 06:36:39.0) Thank you very much for contacting us!
There may have been an issue with the software installation. I will contact you directly so we can find a solution. Alexandru Mihalcea
(posted 2021-11-18 09:01:44.967) Hello,
I am currently trying to write a Python program that needs to be able to configure the Integration time(ms) and External Trigger, and wait for a TTL trigger signal to read the spectrum values and write a spectrum matrix with all 3648 pixel values into a file. I'm currently struggling to use the github script from "https://github.com/tz15/ThorLabsCCS200" and the example script provided in the "CCS_OSA_Script_Python.pdf" but without any success. Is there any way that I can actually download "ThorlabsSpectrum" Python library and a short document with all Python functions that I need to be able to write my software piece? Thank you so much! GBoedecker
(posted 2021-11-25 06:34:40.0) Thank you very much for your inquiry.
There is no Python library for the CCS spectrometers, but are several ways to use them with Python.
The script from github uses pythonnet, the script in "CCS_OSA_Script_Python.pdf" uses ironpython.
Another option is to use the VISA driver commands with cpython. I contact you directly to discuss your application. L Z
(posted 2021-10-23 22:19:19.967) I have encountered a problem and need your help very much. I currently connect the CCS100 directly to the computer, and then use the OSA software on the computer to directly read the spectrum data. But now I want to connect CCS100 directly to hardware devices such as FPGA or STM32, and then use FPGA or STM32 to read and process the data, do you think it is feasible? I have a few questions to ask you. I hope you can give me some suggestions, one is how to use this hardware device to read data? Also, can you provide a technical manual about CCS100 products?I want to know how the CCS100 product transmits data? What communication protocol is the data transmission based on? What is the format of data transmission?
I hope to hear from you soon. I hope you can provide some technical support and help. nreusch
(posted 2021-10-29 08:56:34.0) Thank you for your feedback. I have contacted you directly to discuss your application. Filip Lindau
(posted 2021-10-18 11:21:19.397) Hi! I need to control a CCS175 with a raspberry pi (linux armhf). I have working solution in windows using pyusb but when I connect it to the linux computer the enumeration stops with productId 0x8086 and does not reach 0x8087. I have noticed that a similar behavior in windows when the driver is not installed. How do I solve this problem? Thanks! wskopalik
(posted 2021-10-21 06:07:14.0) Thank you for your feedback!
Unfortunately, Linux is not supported for our spectrometers so we cannot offer a lot of information about it. But we will contact you to provide as much assistance as possible to solve the issue. L Z
(posted 2021-10-12 17:21:33.433) Hello, I would like to ask, I want to use STM32 to connect to CCS100, and then read the collected spectrum data and display it, can this be done? Can you give me some relevant suggestions. I would like to ask what protocol does CCS100 use to transmit data? Thank you. nreusch
(posted 2021-10-21 04:41:05.0) Thank you for your feedback! The CCS series uses a RAW USB interface which unfortunately is not based on easy text-based commands. Therefore, the communication by means of e.g. STM32 would be difficult to establish. I am sorry for the inconvenience. user
(posted 2021-09-16 09:35:06.637) The data plots on the web site and in the user manual for the CCS200 show the vertical axis as arbitrary or relative units. Please let me know if the CCS200, with Cosine corrector, can be used in free space to measure spectral irradiance in W/cm^2/nm and spectral intensity in W/sr/nm. If it can, please let me know how this is done.
Please let me know if the user can swap the fiber cable supplied with the CCS200 with a Fiber Bundle with Linear Output, and what is the impact of this swap on CCS200 performance. soswald
(posted 2021-09-21 07:14:49.0) Dear customer,
thank you for your feedback.
We do not calibrate our CCS series spectrometers for absolute intensity or irradiance measurements in W/cm²/nm or W/sr/nm.
In order to do this yourself you would need a highly stable calibration light source with known irradiance over the entire wavelength range of interest.
Using linear fiber bundles instead of one single fiber can greatly increase the efficiency of the spectrometer. Please see the respective fiber bundle product page (https://www.thorlabs.de/newgrouppage9.cfm?objectgroup_id=8279) for further details on this in the 'Applications' and 'Bundles vs. Cables' tabs. Izzy Lattke
(posted 2021-08-21 16:14:09.703) I have a few questions regarding CCS200 and related models.
1. I'd like to know if there's a built-in way for these units to be used as absorption spectrometers.
2. I'd like to conduct an experiment where I collect absorption spectra say, every 5 seconds for 5 minutes with each measurement having an integration time on the order of 100 ms. Is that possible to do with the OSA software?
3. With respect to the lack of amplitude correction in the near-UV, what are the ramifications of that? Does that mean that I cannot accurately consider relative amplitudes at say, 300 nm and 600 nm?
Thanks. mdiekmann
(posted 2021-08-27 03:09:20.0) Thank you for reaching out! We are contacting you directly to discuss your application in detail. user
(posted 2021-08-18 09:04:03.593) Hi!
At the moment I am working with an external trigger to the CCS100 device, which works nicely.
Unfortunately, I also have an issue with acquiring and saving the raw data.
To make use of the external trigger I have to set the software to 'Repeat' or 'Single' scan, otherwise it will not measure at all after the trigger. Is there a way to circumvent this?
When I run in 'Repeat' mode and also use autosave for the datafiles, it saves ALL the measured spectra, so not only the ones obtained after the pulse.
When I run in 'Single' mode and the first pulse is over, it doesn't react to the second, third, and so on pulse anymore.
Is there a way to fix this? MKiess
(posted 2021-08-20 09:54:48.0) This is a response from Michael at Thorlabs. Thank you very much for your inquiry! I contacted you directly to discuss further details and the exact implementation. Filip Dominec
(posted 2021-08-12 08:37:39.68) Hi, recently a third-party Python script was published (https://github.com/tz15/ThorLabsCCS200) that enables to access CCS200 without the graphical application and thus enabling one to make it a part of a complex experiment. Perhaps it works for other models with a minor change.
I suggest that a similar code should be documented on the website - we were searching for this option for a long time.
(We also noted this script sometimes fails to connect to CCS200, but re-trying usually helps.) MKiess
(posted 2021-08-16 11:11:39.0) Dear Filip, thank you very much for this feedback. That's a good idea to add an extended Python example to the software download and an addtional programming reference. In such cases feel free to contact our Tech Support. We can also help you in such cases and provide more information. Madhav Gupta
(posted 2021-07-09 19:12:15.92) Hi. I am using CCS175/M.
I have been using the Thorlabs software so far to control the spectrometer. However, I would now like to program the spectrometer to write my own application.
I would like to use python to program the spectrometer, since all other devices in the experimental setup are programmed using python as well.
Could you please give me some advice on how I can program the spectrometer in python? The example programs provided in the API are only in C/C#, and no example program for python is provided.
I did find an online reference for using a python script which I have uploaded on this link (https://drive.google.com/file/d/1wPlv5TXkybHxCb1VdsOvAntNtLLKxzrh/view?usp=sharing). However, unfortunately this requires me to execute the python script within the Thorlabs software itself.
I would deeply appreciate it if you could tell me how I can control the spectrometer using python as the programming language.
Best Regards,
Madhav Gupta wskopalik
(posted 2021-07-12 10:43:47.0) Thank you very much for your feedback!
The CCS spectrometers can be controlled in Python by using the ctypes library. This library allows to access the DLL driver files we provide with the installation package and therefore allows to control the CCS completely from Python.
I will contact you directly to provide further assistance and information. Sunil Kumar Chaubey
(posted 2021-05-04 15:38:34.92) Hi, I have bought CCS100/M and would like to how can I measure the spectral transmittance of a lens of 6mm physical diameter of the lens. Which separate instrument is required along with CCS/100/M to serve the purpose? MKiess
(posted 2021-05-04 08:29:45.0) Dear Sunil Kumar Chaubey, Thank you very much for your inquiry.
The most straightforward setup would be to measure the spectrum of a collimated light beam once without the sample and once with the sample, in your case the lens, using the CCS100/M. Then you can record the transmission using Thorlabs Optical Spectrum Analyzers (OSA) software, which you can download from our website.
I have contacted you directly to discuss details and other options. Lukasz Piatkowski
(posted 2021-04-14 04:14:43.13) Hi,
I'm interested in your CCS100/M spectrometer. I wonder how precisely the range 350-700 nm is fixed?
Grating used has still sufficient reflectivity around 330nm, detector is also sensitive in this range.
Would I be able to see some wavelengths just below 350nm or is the range 350-700 fixed by for instance software that does not allow to 'look' lower.
Kind regards,
Lukasz MKiess
(posted 2021-04-16 08:28:51.0) Dear Lukasz, thank you very much for your inquiry. The CCS100 has an N-BK7 window in front of the sensor. This material has a vanishing transmission for the wavelength range smaller than ~350nm. For the wavelengths smaller than 350nm, the CCS200 is the more suitable choice. This has a wavelength range of 200-1000nm. The window of this model is a fused silica window with a better transmission in the UV range. However, we cannot perform amplitude correction of the spectrometer for wavelengths smaller than 350nm. This is due to the lower sensitivity of the sensor in the UV wavelength range. Jong-Min Yoon
(posted 2021-04-09 17:47:28.2) Hello
I'm Jong-Min Yoon from Samsung Electronics
I want to use the cosine corrector, CCSA2 by connecting with other company's spectrometer
The wavelength range of the spectrometer is 975-1700nm (NIR range).
But there's no transmission curve more than 1100 nm wavelength range
Can you present the transmission curve which contains the 975 - 1700 nm range? soswald
(posted 2021-04-13 05:02:33.0) Dear Jong-Min Yoon,
thank you for your feedback. I have reached out to you directly and sent you the typical transmission data up to 1800 nm. turgut emrah
(posted 2021-03-23 18:10:03.853) Hi,
I wonder if you have a labview code/diagram to help us to make measurements with external trigger mode. We would like to give the external ttl trigger signal from the shutter or delay generator and log the data to computer.
We already have individual vis to get single scans and set the integration time, but we are not sure how to setup the vi's to have the data with external trigger.
Bests wskopalik
(posted 2021-04-01 06:29:34.0) Thank you very much for your feedback!
There are four different VIs which can be used to start measurements on the CCS spectrometers. “TLCCS Start Scan.vi” and “TLCCS Start Scan Continuous.vi” will start one or continuous scans with the internal device trigger. “TLCCS Start Ext Triggered Scan.vi” and “TLCCS Start Scan Continuous Ext. Trigger.vi” will do the same with the external trigger.
When these VIs are called, the CCS will wait until a trigger signal is detected and then take a measurement. With “TLCCS Start Scan Continuous Ext. Trigger.vi” the CCS will wait continuously for trigger signals and will also take measurements continuously. With “TLCCS Start Ext Triggered Scan.vi” it will only wait for one trigger signal and take one measurement.
I will contact you directly to provide further assistance. Josefine Lemke
(posted 2020-12-17 04:55:58.197) hello,
we use the CCS175 to detect raman scattering with a 785 nm laser. the peaks in the spectrum are all a bit shifted from where they are supposed to be. my question: the spectral response (according to the spec sheet) shows a response of only 0.5 at 785 nm excitation. could this be a reason for the shifted peaks in the spectrum?
best regards
josefine MKiess
(posted 2020-12-17 09:57:37.0) Thank you for your inquiry.
I have contacted you directly to discuss the details and possible reasons with you. ahmad maryanto
(posted 2020-12-09 22:04:27.933) 1. what is the difference between CCS200 and CCS200M
2. do we not need a solar reference panel for spectral reflectance measurement?
3. do those two instruments able to be operated outdoor for spectral reflectance field measurement?
Thanks very much MKiess
(posted 2020-12-14 07:23:22.0) Thank you for your request. The difference between the CCS200 and the CCS200/M is that the CC200 is the inch version and the CCS200/M is the metric version in terms of the screw threads provided in the spectrometer housing.
For the exact requirement regarding your measurement, I have contacted you directly to discuss the details together. paulo rivera
(posted 2020-09-21 17:48:12.427) Hello, is it possible to connect the spectrometer to a rasberry with ubuntu OS? MKiess
(posted 2020-09-23 09:40:58.0) Dear Paulo, thank you very much for contacting Thorlabs.
I have contacted you directly to discuss the exact details with you. Oleksandr Tarasenko
(posted 2020-08-12 02:05:39.53) Hello,
It is obvious that the white light spectrum shown on your site contains etaloning effect. There is "something" several mkm thick inside your spectrometer that gives interference pattern which "modulates" white light spectrum. What is a reason of etaloning?
With best regards,
Oleksandr Tarasenko from Finland dpossin
(posted 2020-08-13 10:50:30.0) Dear Customer,
Thank you for your feedback. Yes our CCS200 shows etalon effects. Most probably they are coming from the safety glass which is located in front of the CCD line array. The etalon effect can be canceled out via the amplitude correction. I am reaching out to you to furter discuss this matter. Rober Kay
(posted 2020-07-01 21:44:59.797) When I look at the gratiing spectra it does not match the stated spectral bandwidth of the specific analyzer. I', interested in the 200nm to 1000nm model but the chart for its grating does not make sense relative to the stated specs. dpossin
(posted 2020-07-06 02:25:31.0) Dear Robert,
Thank you for your feedback. The grating still has sufficient efficiency in the range from 200nm to 500nm. The main reason why we do not specify our other CCS spectrometers below 500nm is, that we use different windows in front of the CCD line array which do not show enough transmission in the range from 200 to 500nm. I am reaching out to you in order to provide further information. VIoleta Madjarova
(posted 2020-06-22 07:10:22.827) In the Sensor Specs how do you calculate the Resolution that is given in px/nm? wskopalik
(posted 2020-06-23 07:07:55.0) This is a response from Wolfgang at Thorlabs. Thank you very much for your inquiry!
The linear CCD chip which is used in these spectrometers has 3648 pixels. If you divide this pixel number by the wavelength range, you will roughly get these resolution values. They are rounded, because the wavelength range on the actual spectrometers is usually a bit wider than in the specifications.
I will contact you directly to provide further assistance. Vasiliy Voropaev
(posted 2020-06-19 15:14:42.377) What is the working diffraction order for this spectrometer? Can we see femtosecond radiation at a wavelength of 1900 nm on this septometer or not? wskopalik
(posted 2020-06-23 11:40:13.0) This is a response from Wolfgang at Thorlabs. Thank you very much for your inquiry!
Unfortunately, you will not be able to measure at 1900 nm with these spectrometers. They use a silicon CCD chip as detector which is not responsive in this spectral range any more.
I will contact you directly to provide further assistance. Borislav Stefanov
(posted 2020-05-11 04:15:31.533) Hello,
We need a spectrometer for a wavelength of 200-400. Also, after conducting the test to be able to make a report.
We would like your expert opinion. At this stage, our priority is to measure 253 wavelengths.
Also if it possible to be mounted detector on integrated sphere?
Can you offer us some solution? wskopalik
(posted 2020-05-13 08:47:41.0) This is a response from Wolfgang at Thorlabs. Thank you very much for your inquiry!
I will contact you directly so we can find a suitable solution for your application. David Poudereux
(posted 2020-01-13 04:57:03.603) To whom it may concerns.
We have an CCS200 (S/N: M00409427) which we use normally via LabView. We need the amplitude correction which can be activated in Thorlabs software but not for LabView control. Could it be possible to obtain from your side the responsivity data form the sensor to correct the output? We are trying to do it manually, but if you could send us the data (wavelenght responsivity I suppose) would be very usefull to us.
Best regards
David wskopalik
(posted 2020-01-14 08:43:32.0) This is a response from Wolfgang at Thorlabs. Thank you very much for your inquiry!
You can read the amplitude correction data from the spectrometer in LabView using the VI "TLCCS Get Amplitude Data". This VI will return the correction factor for each pixel to an array.
I will contact you directly to provide further assistance. Hendrik Bekker
(posted 2019-10-08 11:18:17.993) Hi, I was wondering if it's possible to use this spectrometer as a spectral filter with wavelength tunability. Can the camera be removed and an iris or fiber was placed there instead? Please contact me if this seems feasible. wskopalik
(posted 2019-10-10 11:33:57.0) This is a response from Wolfgang at Thorlabs. Thank you very much for your inquiry!
Unfortunately, this is not possible due to the design of these spectrometers. But maybe you could use one of the gratings we offer for your application. I will contact you so we can find a suitable solution. user
(posted 2019-10-02 13:52:45.183) Regarding the CCS200:
1) What is the CCD dark count rate and read noise?
2) What is the QE of the CCD as a function of wavelength?
3) What is the resolution? You list a CCD resolution of 4 pixels per nm. Is this the limiting factor for the resolution, or is there a larger limit from the grating?
4) What is the spec for scattered light?
5) In your online graph for CCS200 grating efficiency, the graph goes from 500nm to 3500nm for a spectrometer that works from 200nm to 1000nm? I am confused by this graph. I'd be interested in seeing the data out to 200nm. MKiess
(posted 2019-10-08 10:06:36.0) This is a response from Michael at Thorlabs. Thank you very much for your inquiry. The specification sheet for the CCD chip integrated in the CCS200 as well as the specification sheet for the spectrometer can be downloaded from our website. The sensor chip is a TCD1304DG from Toshiba. In order to discuss the specifications regarding your application in detail, I contacted you directly. Hüseyin Durmus
(posted 2019-09-24 17:21:25.953) Hello,
Can the Compact CCD Spectrometer be used as both absorption and reflection spectrometer?
Are light source and reflection (or absorption if any) probes included in the price?
Best Regards wskopalik
(posted 2019-10-03 09:53:49.0) This is a response from Wolfgang at Thorlabs. Thank you very much for your inquiry.
These spectrometers can be attached to absorption and reflection setups. They are not limited to a particular application. The spectrometers already include a multimode fiber patch cable. Probes and light sources are however not included and would need to be purchased separately.
I will reach out to you in order to provide further support. user
(posted 2019-08-14 02:06:05.89) Hello I have CCS200. I installed and ran the program and pressed the REPEAT button, but the graph did not update. But Acquiring are moving. How to solve the problem? dpossin
(posted 2019-08-20 10:26:59.0) Hi there,
Thank you for your feedback. This question is really hard to answer as I do not have any information about your operating system or your general computer Performance. My first thought would be, that the aquisition time of the CCS200 is limited by the computer. I am reaching out to you in order to give further support. Péter Csuti
(posted 2019-08-13 09:54:54.983) Are there demo devices (CCS200/M) available for trial?
If yes, what configurations are there available?
Thank you,
Peter,
from Hungary MKiess
(posted 2019-08-16 09:33:54.0) This is a response from Michael at Thorlabs. Thank you very much for your inquiry. There are some loan devices available. I have contacted you directly to discuss further details. Jon G
(posted 2019-06-10 07:09:09.45) I would like to know the spectral accuracy of your CCS200/M spectrometer over the range 520 nm to 985 nm. Also, I would like to control the spectrometer using MATLAB, is this possible with the CCS200/M? dpossin
(posted 2019-06-12 04:39:42.0) Hello,
Thank you for your feedback. The accuracy of the CCS200/M is in the range of 0.7 to 1 nm FWHM in the wavelenght region from 520 to 985nm. The spectrometer can be controlled by Matlab as well. I will reach out to you directly in order to provide further data on the accuracy and to hand you Matlab programming examples. Titus Appel
(posted 2019-05-01 10:42:47.23) What power levels can the spectrometer accept. I have an 830nm 2W laser I need to measure the wavelength. Thanks! MKiess
(posted 2019-05-03 04:48:46.0) This is a response from Michael at Thorlabs. Thank you very much for your inquiry. While we do not have formal values for the acceptable power of the spectrometer for all wavelengths, I can say that the laser power of 2W is too high for the spectrometer. However, before the spectrometer becomes damaged, the sensor will saturate. The sensor used is a Toshiba TCD1304DG and has a saturation voltage of 600mV and a sensitivity of 160V/(lx·s). Therefore, this saturation depends on various factors such as the amount of light received by the sensor surface of a certain illumination intensity over a time period that can be set in the control software for CCS spectrometers. In order to measure a laser beam with an average power of 2W, it must be attenuated before reaching the CCS. This is possible, for example, with fiber optic attenuators or different optics such as neutral density filters, beam splitters or polarization optics. I will contact you directly in order to provide further assistance. viktordibko03
(posted 2019-03-06 11:35:35.65) Hello, how can I measure reflectrance with OSA software? In Measurement Assistant i see only Transmittance/Absorbance measurements. wskopalik
(posted 2019-03-13 03:43:54.0) This is a response from Wolfgang at Thorlabs. Thank you very much for your inquiry!
You can use the "Transmittance" option in the Measurement Assistant for reflectance measurements as well. In this option the currently measured spectrum is divided by a previously recorded background spectrum. So this is the same as what you would need to do for a reflectance measurement. The difference is basically just the way your setup is arranged.
Alternatively, you can also use the "Math" functions to compare two spectral traces with each other.
I will contact you directly to provide further assistance. toporkov
(posted 2019-02-15 18:35:12.56) We use CCS100/M. Would you provide a timing diagram showing the position of the (announced) integration time of 10 µs relative to the starting pulse (after delay trigger ~8µs).
Thanks in advance. nreusch
(posted 2019-02-21 07:46:30.0) This is a response from Nicola at Thorlabs. Thank you for your inquiry! I will contact you directly to send you the diagram you asked for. Patrick_Lee
(posted 2019-01-31 17:16:20.583) Hi, I am using your spectrometer to measure a laser wavelength. I intend to use an integrated sphere to connect your CCS175 spectrometer. I will write a python program to read and detect the peak wavelength and also record the spectrum curve.
Could you provide some guidance on how to achieve the above.
Thank you
Patrick wskopalik
(posted 2019-02-08 07:08:20.0) This is a response from Wolfgang at Thorlabs. Thank you very much for your inquiry!
Unfortunately, we don't have a lot of documentation regarding the use of Python for our CCS spectrometers. You can however use Python scripts from within the OSA software to control the spectrometers and I will send you a documentation about this. t.baden
(posted 2019-01-28 09:58:33.437) Hi,
What exactly do the A.U.s on the Y axis as displayed in the software mean. Is this related to photon count per wavelength, or energy (i.e wavelength already included)?
I don't believe this information is explicitly included in the manual, and it is obviously critical when interpreting the data.
Thanks!
Tom wskopalik
(posted 2019-02-14 02:19:04.0) This is a response from Wolfgang at Thorlabs. Thank you very much for your inquiry!
The meaning of the Y axis depends on whether the "Amplitude Correction" feature is switched on or off. If it is disabled, the Y axis shows the raw data of the CCD array in the spectrometer. There is no correction for the wavelength in this case. If the amplitude correction is enabled, the data is corrected for the wavelength dependent responsivity of the CCS spectrometer. This is not an absolute calibration for power or energy, but it is a relative correction for the wavelength dependence so the unit is still "arbitrary units".
I will contact you directly to provide further assistance. k.catsalap
(posted 2019-01-23 11:13:27.67) Dear Thorlabs,
we all agree here the compact spectrometer CCS100 you offer is a fascinating product. However is it possible slightly adjust its spectral range from 350 -700 to 190-500? The UV-vis is more suitable for our analysis tasks.
Regards,
I.F.
researcher nreusch
(posted 2019-01-25 08:35:53.0) This is a response from Nicola at Thorlabs. Thank you for your inquiry. CCS200(/M) might be an interesting option for measuring wavelengths down to 200 nm. Unfortunately, we cannot offer a customized spectrometer for shorter wavelengths. Please note that the amplitude correction is only valid above 380 nm. I will contact you directly to discuss whether CCS200 would be suitable for your investigations. john.flint
(posted 2018-12-21 17:41:47.377) specs on website say up to 200 scans/s. Is this with writing the data to disk or just displaying the data on the screen? nreusch
(posted 2019-01-11 02:59:00.0) This is a response from Nicola at Thorlabs. Thank you very much for your inquiry. The spectrometer itself even allows frame rates over 200 scans/s. However, the OSA software and data storage limit the available frame rates. Your PC and USB configuration may also affect the actual frame rate. pedro.mece
(posted 2018-12-13 16:24:21.607) Dear team,
I would like to control the CCS175/M via MatLab. Is it any SDK available ? How can you advise me to do it ? Could you send me the documentation? Kind regards, Pedro wskopalik
(posted 2018-12-14 10:42:58.0) This is a response from Wolfgang at Thorlabs. Thank you very much for your inquiry.
I can send you a short documentation about how to control the CCS spectrometers from MATLAB. This can be done by using the commands "loadlibrary" and "calllib".
I will contact you directly with further information. retcheni
(posted 2018-11-20 06:12:54.003) Dear team,
I would like to know a couple of specs that I could not find in the description of this spectrometer.
1) Does the software show a time line (i.e. absorbance at a given wavelength vs. time) in real time during continuous measurement ?
2) is it a reference SDK available to control the spectrometer ? I saw that there are some examples for C#, etc. but wonder if there is a comprehensive list about how to use the implemented commandas and make an own control software. Cheers ! wskopalik
(posted 2018-11-29 02:29:49.0) This is a response from Wolfgang at Thorlabs. Thank you very much for your inquiry!
Unfortunately, the spectrometer software does not have a time line feature. But it comes with all driver files and documentations for the implemented commands which are needed to write your own control software for it. There are examples for C, C#, and LabView included as well.
I will contact you directly to provide further assistance. aungmyinkyawstar
(posted 2018-10-19 00:01:02.207) Hi
I am currently trying to use C to control the spectrometer. Do you guys have any additional documentation or resources other than those that are available online? This is part of my final year project so I would appreciate if there are other additional resources for me read on. Thank you so much in advance. swick
(posted 2018-10-29 04:59:47.0) This is a response from Sebastian at Thorlabs. Thank you for the inquiry.
After the software and drivers are installed you can find an example for C at path: C:\Program Files (x86)\IVI Foundation\VISA\WinNT\TLCCS\Examples\C guillaume.stern
(posted 2018-09-06 11:24:23.657) Deart Thorlabs team, I would like to control the spectrometer with C++ commands. Is it possible? Do you have any documentation about it? Thank you! wskopalik
(posted 2018-09-19 08:28:33.0) This is a response from Wolfgang at Thorlabs. Thank you very much for your inquiry!
Yes, it is possible. The software package of these spectrometer includes drivers for C/C++ and there is also a documentation for all the commands implemented in the driver files.
I will contact you directly to provide further assistance regarding these files. ikucukkara
(posted 2018-08-29 03:29:08.51) Dear Thorlabs
I have a USB spectrometer
SP1-USB 400-800nm Serial Number: M00219619.
I installed new software OSA 2.85 on WIN 10 64 bit running on a i7 PC with 8GB RAM. The spectrometer cant be seen by the PC and OSA 2.85 both.
would you please help on this matter.
Regards nreusch
(posted 2018-09-06 02:23:28.0) This is a response from Nicola at Thorlabs. Thank you for your inquiry. I am sorry to hear that the spectrometer is not recognized. I will contact you directly to troubleshoot this issue. akanksha.garodia
(posted 2018-08-02 01:58:32.987) Hi, I am using CCS200/M for getting the absorbance and transmittance with a center wavelength of 532nm. Can you please help me out with the OSA software. As it is difficult for me to get the absorbance here. swick
(posted 2018-08-13 04:14:42.0) This is a response from Sebastian at Thorlabs. Thank you for the inquiry.
In order to evaluate the absorbance in the OSA software you need to take reference spectrum without absorption and assign it to trace A.
Then trace B should be assigned to the spectrum with absorption.
Trace C or D could then be defined as the absorbance spectrum in respect to traces A and B. I contacted you directly to provide further assistance. user
(posted 2018-07-18 10:37:24.653) Is there any handheld spectrometer with a display? I'm looking for something in the range from 350-500 nm. Thank you. swick
(posted 2018-07-30 03:31:49.0) This is a response from Sebastian at Thorlabs. Thank you for the inquiry.
Our compact CCD spectrometers are powered via USB interface so they could be used with Laptops thus the systems are portable. We do not offer spectrometers with display. christoph.friese
(posted 2018-06-22 12:55:52.767) Hi,
I'm using the CCS200 spectrometer with a windows laptop and its working fine. In the same setup I'm using a Raspberry Pi to log data from other sensors.
I'd like to automate the system in such a way that the Raspberry Pi triggers the measurement (every hour) and logs the spectrometer output.
Has this been done in the past or do you have an idea how to realize this?
Thanks. mvonsivers
(posted 2018-06-27 04:04:01.0) This is a response from Moritz at Thorlabs. Thank you for your inquiry. Unfortunately, we do not have any experience regarding the readout of our spectrometers with a Raspberry Pi. I will contact you directly to discuss your application. samikhere
(posted 2018-06-19 03:09:29.847) Can it be used for explosive detection? mvonsivers
(posted 2018-06-21 06:10:33.0) This is a response from Moritz at Thorlabs. Thank you for your inquiry and the interest in our products. I will contact you directly to discuss your application. jperez
(posted 2018-06-14 13:12:29.677) Hi. I have the CCS100/M spectrometer. I am trying to measure color but the button displays the following message: "Disabled because no calibrated trace covering the entire visible exists".
My questions are:
- Can I calibrate it? If yes, how?
-Is it possible to measure CIE L*a*b in this model or other?
Regards. mvonsivers
(posted 2018-06-15 11:26:05.0) This is a response from Moritz at Thorlabs. Thank you for your inquiry. To perform a color analysis the Amplitude Correction has to be enabled, see p. 51 of the manual. Color analysis can be performed in the CIE 1931, CIE 1960 and CIE 1976 color space. heidi.cattaneo
(posted 2018-05-30 12:03:12.277) Hello,
I would like also to control the spectrometer with Matlab. Could you send me the documentation?
Kind regards,
Heidi mmcclure
(posted 2018-08-13 10:58:29.0) This is a response from Moritz at Thorlabs. Thank you for your inquiry. The spectrometer can be integrated into Matlab using the "loadlibrary" function. I will contact you directly to provide more detailed instructions. hbrodie
(posted 2018-05-15 20:35:47.29) Hello,
What is the wavelength repeatability of the CCS200? I can't seem to find this index on the specification page. Thank you. mvonsivers
(posted 2018-05-22 06:13:25.0) This is a response from Moritz at Thorlabs. Thank you for your inquiry. Unfortunately, we do not have any specification on the wavelength repeatability. I will contact you directly to discuss your application. diego
(posted 2018-04-11 06:30:30.123) Hi wskopalik, I would also (as dremin_viktor) like to connect a CCS200 spectrometer to Matlab. Could you send me the short documentation? Thanks! Diego swick
(posted 2018-04-17 04:00:56.0) This is a response from Sebastian at Thorlabs. Thank you for the inquiry. I contacted you directly and sent the example with documentation. eli.ashkenazy
(posted 2018-04-09 04:38:38.53) Hello,
Does this spectrometer have different sensitivity for each polarization? We would like to use it for measuring the transmittance of thin film coating which is polarization-dependent. The light source is not polarized (50-50). Does the measured transmittance will be the equal average or a weighted average due to different sensitivity of the spectrometer?
Thank you!
Eli mvonsivers
(posted 2018-04-10 11:07:21.0) This is a response from Moritz at Thorlabs. Thank you for your inquiry. The optical elements used inside the spectrometer (e.g. grating, mirrors) will show some polarization dependency. However, as the light is coupled into the spectrometer via a MM fiber the state of polarization is not maintained. We will contact you directly for further discussion of your application. dremin_viktor
(posted 2018-02-27 11:27:12.397) Hello,
Could you share an example of how I can connect a spectrometer to Matlab?
Thank you!
Viktor wskopalik
(posted 2018-02-27 09:50:32.0) This is a response from Wolfgang at Thorlabs. Thank you very much for your inquiry.
I can send you a short documentation about how to control the CCS spectrometers from MATLAB. This can be done by using the commands "loadlibrary" and "calllib". I will contact you directly with further information. summers
(posted 2018-02-14 07:58:02.907) Hi, I am trying to determine whether I will be able to use the CCS spectrometer for studying chemical kinetics. I expect to write my own application and I am trying to figure out how that is done. I have the example code that comes with the downloaded software and it seems pretty straight forward. I am not sure that I have the library that is needed to control the spectrometer. Specifically, my computer is unable to find the Thorlabs.CCS_Series library. If this library comes with the downloaded software I have been unable to find it. Please give me some information on how to get this working.
Best,
Jack mvonsivers
(posted 2018-02-20 05:23:58.0) This is a response from Moritz at Thorlabs. Thank you for your inquiry. The driver files and libraries are included with the software package. The location of these files is described in section 5. of the manual. I will contact you directly for further assistance. movingpictures2
(posted 2018-01-25 16:15:22.53) I have a CCS 200 200 - 1000 nm spectrometer and even after talking to tech support, it has no response as in close to zero response below 400 nm.
SO really it can not be 250 - 1000 nm if its cut off is 380.
I am not sure what to do. swick
(posted 2018-02-02 03:59:36.0) This is a response from Sebastian at Thorlabs. Thank you for the inquiry.
The responsivity for CCS200 at wavelengths below 380nm is weak but with long integration times it works to measure small signals in the UV region. When measuring broadband light sources the spectrum at wavelengths with high responsivity might saturate while the UV parts are still not observable. I contacted you directly for further discussion. a.shukla
(posted 2018-01-22 02:24:49.243) Hi, I was using CCS100 for past one year and was working out fine but there seems to be an issue since past one week. I'm not able to connect the spectrometer to the computer, the software says it cannot detect the spectrometer and the spectrometer LED is not glowing as well. What can be reason for this? Also what can I do to troubleshoot this issue? swick
(posted 2018-01-24 03:48:33.0) This is a response from Sebastian at Thorlabs. Thank you for the inquiry. The reason for this issue could be a defective fuse. I contacted you directly for troubleshooting. wenzel.jakob
(posted 2017-12-09 19:45:30.32) Does Thorlabs provide information on the USB protocol used to communicate with the spectrometer? Our lab computers run Linux, hence we won't be able to use the included Windows software. swick
(posted 2017-12-14 03:18:28.0) This is a response from Sebastian at Thorlabs. Thank you for the inquiry.
The crucial point will be the implementation of the USB connection in Linux. In Windows this is done by using the VISA interface. VISA-like interfaces for Linux (pyvisa-py, LibreVISA) are available. I have contacted you directly for assistance. apwilliamson
(posted 2017-10-26 17:56:40.83) Hi there, I have a CCS200 and I am having a bit of difficulty acquiring reliable readings through its triggering mode. I am operating at a rate of 10 Hz and with a 100 ms integration time (and above) I get reliable signals but the data is saved at a rate varying between 10 to 5 Hz (Latest OSA Software). Times between 100 and 1 ms I get a strong signal on every 2 - 9th trigger and I am able to save readings at 10 Hz around the 80 ms mark. The weak signal is similar to the strong except it plateaus at around 1-2% of the dynamic range except for a few strong peaks poking out. Integration times in the tens of microseconds range I begin to get good signals but the intensity varies like a sawtooth wave. The temporal jitter of the signal is no more than 800 ps and the signal packet is around 20 ns in width. Is this something I am able to do or is it symptoms of a faulty device. Thanks. mvonsivers
(posted 2017-11-01 04:26:25.0) This is a response from Moritz at Thorlabs. Thank you for your message. When using the triggering mode there is a jitter between the trigger signal and the data taking. The value of this jitter will depend on the integration time. I will contact you directly for further details. victor.lorenz
(posted 2017-09-18 13:16:14.277) I downloaded the Thorlabs OSA software 2.80. I used the virtual CCS device. Seems that there is no actual option for measuring absorption spectra, i.e., to measure a reference spectrum, a sample spectrum and get -log(sample/reference). Is that correct? or did I missed something? or perhaps is a virtualization problem? Or I downloaded the wrong software?
For me it is essential to clear this up, because I am interested in the possibility of using this device to measure absorption spectra of samples, and if it cannot easily provide such measurement then makes no sense for me to purchase one.
Thanks for your time!
Victor swick
(posted 2017-09-20 04:07:48.0) This is a response from Sebastian at Thorlabs. Thank you for the inquiry. Absorbance measurements can be performed with the OSA software. You can find the corresponding section in the manual at chapter 4.3. I will contact you directly for more details and for further assistance. cynthia.zhang
(posted 2017-08-21 23:04:57.833) Would you please tell me why the peak wave of wavelength is flat, and the value is 1? swick
(posted 2017-08-23 03:49:04.0) This is a response from Sebastian at Thorlabs. Thank you for the inquiry. The sensor is saturated when the signal in the OSA software reaches 1.
It might help to use shorter integration time. rao5242
(posted 2017-08-03 12:14:56.497) Hi, I was wondering what the calibration cost for this device would be per year? tschalk
(posted 2017-08-07 06:37:02.0) This is a response from Thomas at Thorlabs. Thank you very much for your inquiry. We can offer a recalibration, which contains a wavelength and a relative power calibration. I will contact you directly regarding the price and the further proceedings. simki323
(posted 2017-07-27 19:42:12.36) We just bought it before weeks, CCS175/M, and did the free-space transmittance experiment of GaAs sample. But, we obtained the different data from CARY5000 spectrometer of Agilent in the spectral range of 955nm ~ 1000nm. Can you contact me by e-mail? Then, I'll send you the transmittance data and experiment setup. swick
(posted 2017-07-28 03:12:10.0) This is a response from Sebastian at Thorlabs. Thank you very much for the inquiry. I have contacted you directly to provide assistance. bmaertz
(posted 2017-07-12 15:23:14.307) We are looking for a spectrometer that works from ~700-1100 nm. I see from some responses below that you may offer a custom solution that goes slightly further than 1000 nm? What sets the 1000 nm cutoff? Detector says it goes to 1100 nm. I know efficiency is low past 1000 nm, but is this the only reason that you spec it to 1000 nm, or is there a filter or some other reason it does not work past 1000 nm? Thanks swick
(posted 2017-07-14 04:31:49.0) This is a response from Sebastian at Thorlabs. Thank you for the inquiry.
Yes, we can offer a customized version of CCS200 for 300-1100nm. I will contact you directly to quote this device. jviegas
(posted 2017-07-07 01:52:42.807) I cannot get any software to recognize the spectrometer, new/out of the box, after following the installation procedure in accordance with the manual on two different laptops.
Very disappointing. Did I get a faulty system? swick
(posted 2017-07-07 06:09:17.0) This is a response from Sebastian at Thorlabs. Thank you for the inquiry. I have contacted you directly for troubleshooting. ben
(posted 2017-06-06 17:07:45.41) There seems to be non-random noise inherent in the spectrometer signal. Is this something that can be removed through calibration or background correct? If background correct is used can you provide specific instructions how to use it correctly? swick
(posted 2017-06-08 03:54:49.0) This is a response from Sebastian at Thorlabs. Thank you for the inquiry.
I have contacted you directly to provide assistance and detailed information about the spectrometer. tunderw5
(posted 2017-04-18 13:13:33.387) I am interested in buying this product but have a quick question about how robust this product is against electromagnetic interference. I have owned a number of Ocean Optics broadband spectrometers and none of them seem to be able to survive (the computer no longer recognizes them after a few shots). That being said, I have a number of cameras and computers in the environment that have had no problems whatsoever. swick
(posted 2017-04-19 03:21:11.0) This is a response from Sebastian at Thorlabs. Thank you for the inquiry. I will contact you directly for assistance. yyh3190
(posted 2017-04-05 10:12:48.5) Hi
I am going to use ccs200 / m with LabVIEW.
so I need to ccs 200/m VISA driver swick
(posted 2017-04-05 04:11:15.0) This is a response from Sebastian at Thorlabs. Thank you for the inquiry. After installing the software the VISA driver for CCS-Series can be found at:
C:\Program Files\National Instruments\LabVIEW xxxx\Instr.lib\...
...TLCCS\TLCCS.llb dlhofeldt
(posted 2017-03-31 08:59:21.717) I need the spectral response profile for the spectrometer -- product of grating efficiency and detector response. If the grating is peak at 800 nm, the response at 200 nm may be pretty poor...
Also, need the sensitivity specified in units of Watts of input light needed to give full scale signal at some wavelength with some exposure duration. swick
(posted 2017-04-03 03:27:48.0) This is a response from Sebastian at Thorlabs. Thank you for the inquiry. I have contacted you directly to provide requested information. melsj
(posted 2017-03-02 21:11:35.007) I received my CCS 200/M spectrometer today, and I have question about the amplitude correction.
Q1. Is the amplitude correction file pre-installed in the spectrometer?? I was expecting it provided as a separate file in the installation CD but I couldn't find it.
Q2. This spectrometer covers the wavelength range from 200 to 1,000 nm. But why the correction is done only at the range from 340 to 1,000 nm?? Then, how can I measure a reliable emission spectrum in 200-340 nm range?? swick
(posted 2017-03-06 03:06:57.0) This is a response from Sebastian at Thorlabs. Thank you for the inquiry.
1. Yes, the data of intensity calibration is stored in a non-volatile memory in the CCS.
2. The reason why the Intensity Calibration is performed from
CCS100: 380nm - 700nm
CCS175: 545nm - 1000nm
CCS200: 370nm - 1000nm
is the CCD's weak responsivity below 370nm (CCS200), 380nm (CCS100) and 545nm (CCS175).
Measurements of the spectral intensity at 200-340nm will suffer from fluctuations of the responsivity in the CCD, because they are not compensated by Intensity Calibration.
I will contact you for further assistance. chiwing7777
(posted 2017-02-10 11:04:55.23) I am still wondering the “spectral correction” you mentioned last time.
Because we do the fluorescence quantum yield measurement, the unit of intensity should be corresponding to the “number of photons per unit time”.
Refer to the amplitude correction in the software that takes the wavelength dependent responsivity into account, does it include the multiplication with lamda in their correction spectra as relative number of photons?
If no, do you have any suggestion for this kind of calibration?
Thank you very much! wskopalik
(posted 2017-02-13 10:20:29.0) This is a response from Wolfgang at Thorlabs. Thank you very much for your inquiry.
The amplitude correction is not an absolute calibration, so it cannot return spectra in Watts or photons per time. The spectra returned by the amplitude correction are still in arbitrary units.
I have contacted you directly to provide further assistance. cmrogers
(posted 2017-02-09 22:28:20.81) Hi,
I am seeing some type of interference fringes in a spectrum of incoherent white light (Tungsten-Halogen source). Can you send me more info about the post from 2010-12-08 12:02:00.0 which includes the 'The artifact you see is related to the simultaneous use of the blazed grating and the CCD chip that results in an interference effect'? I think it might be relevant. wskopalik
(posted 2017-02-10 09:03:01.0) This is a response from Wolfgang at Thorlabs. Thank you very much for your inquiry.
I have contacted you directly to provide further details about this effect. chiwing7777
(posted 2016-12-28 16:00:00.6) Hi, I am currently using the CCS 100 spectrometer with integration sphere for measuring PLQE. I have checked the intensity correction. What is the unit after correction? Is it possible to get the spectral irradiance in mW*m-2*nm-1? Or other relative way to these measurement purpose? Thank you very much! wskopalik
(posted 2016-12-28 05:02:21.0) This is a response from Wolfgang at Thorlabs. Thank you for your inquiry.
The amplitude correction feature in the software will take the wavelength dependent responsivity of the CCS spectrometer into account. This way e.g. peaks at different wavelengths can be compared relative to each other. The spectrum is however still in arbitrary units and not absolutely calibrated. Unfortunately, it is not possible to measure absolute optical powers with the CCS spectrometers.
I have contacted you directly to provide further assistance. Larry.Lo
(posted 2016-12-12 04:05:32.357) I would like to measure the wavelength (nm) and power (mW*m-2*nm-1) of a led lamp. Is the spectrometer can measue both or I need to buy a power meter for power measurement? swick
(posted 2016-12-12 04:37:57.0) This is a response from Sebastian at Thorlabs. Thank you for the inquiry.
Unfortunately, it is not possible to measure absolute optical powers with our CCS-Spectrometer. In order to get accurate values for absolute power spectral density in [mW/(m²*nm)] a spectrometer, a beam profiler and a power-meter is required.
I have contacted you directly to provide further assistance. shim9307
(posted 2016-12-07 22:08:32.197) In the "Specs" tab on this webpage, there is a spectrum of CCS spectrometer with linear fiber bundles. Why the spectrum's shape is similar to summation of sine curve? I think that light source may not emit sine curve shape light. swick
(posted 2016-12-09 03:13:46.0) This is a response from Sebastian at Thorlabs. Thank you for the inquiry.
These spectra are looking sinusoidal because of etalon effects (interference).
This can be eliminated by using the Amplitude Correction of our CCS spectrometer.
I have contacted you directly to provide more detailed information. mbarrasr
(posted 2016-11-30 08:49:25.207) Hello, I am who asked for COG algorithm in LabVIEW yesterday. Sorry for not leave any contact information.
When I calculate the movement of the wavelength is like I calculate the average value of all the spectrum. That operation results in a number in pixels. I only want to transform that pixel number into a value in nanometers wskopalik
(posted 2016-12-05 09:52:02.0) This is a response from Wolfgang at Thorlabs. Thank you for your feedback. I have contacted you directly to discuss your issue in more detail. user
(posted 2016-11-29 12:00:55.897) Hello, I am progamming a LabVIEW application to track the movement of the wavelengths with COG algorithm. When I track the signal in pixels everything is ok but when I track in nanometers (using GetWavelengthData) I am not able to calculate correctly.
I would like to know if it exists an equation or expression to convert pixels to nanometers. Thank you wskopalik
(posted 2016-11-29 10:29:35.0) This is a response from Wolfgang at Thorlabs. Thank you for your inquiry.
The command "Get Wavelength Data" will return an array which contains the wavelength corresponding to each pixel. The spectral data corresponding to this array will be returned by "Get Scan Data". Please note that the command "Get Raw Scan Data" returns a slightly larger array because it contains additional pixels used for dark current correction which are however not part of the actual spectrum. In this case the correlation between pixel, wavelength and spectrum wouldn't be correct and could cause issues in your algorithm.
Unfortunately, you didn't leave any contact information in your feedback. Please contact us at europe@thorlabs.com so we can discuss your issue in more detail. BSMoshe7
(posted 2016-10-10 16:10:42.733) Hello, i need 2 detectors
1. I need to detect fruits and vegetables.
for example rice should be only rice, with no Insects (size 0.5mm) and bugs and other kind of seeds.
even if the worm is inside the rice i need to detect it and throw it.
2. need to detect wether a clothing containing sheep wool end linen on the same clothing
even if its only one fiber and its in side the lining.
can your products halp me with somthing? swick
(posted 2016-10-11 03:28:17.0) This is a response from Sebastian at Thorlabs. Thank you for your inquiry.
I will contact you directly to assist you in defining more accurate requirements and to find a proper solution for your application. mateusz.bara
(posted 2016-08-19 13:46:41.387) Hello, is CCS200/M able to measure spectral irradiance in mW*m-2*nm-1? swick
(posted 2016-08-19 10:10:51.0) This is a response from Sebastian at Thorlabs. Thank you for your inquiry.
Unfortunately, with our CCS-Series it is not possible to measure spectra with an absolute power distribution and the beam diameter.
We only can provide a relative intensity calibration for our compact CCD spectrometers.
I will contact you directly to discuss your application and requirements in more detail. justine.redon
(posted 2016-07-28 16:11:35.11) Hello, I would like to have more information. What is the resolution/accuracy of the CCS100 over its spectral range (350-1100nm)? shallwig
(posted 2016-08-01 09:36:40.0) This is a response from Stefan at Thorlabs. Thank you very much for your inquiry. The spectral accuracy specifies how precise one center wavelength (here 435nm) can be resolved. This is not valid for the whole operating wavelengths range. We have no exact data for the whole wavelength range but at 350nm we expect the accuracy spec to be 0.5nm, at 700nm we estimate a spectral accuracy of about 1nm. I have contacted you directly to check your application in detail and if a LOAN unit might be an option to check if the CCS100 meets your requirements. torsten.trittel
(posted 2016-07-27 09:11:07.62) Hello,
we have a CCS100/M (S/N: M00268021). We have the same problem with this device as described by b.lechene (Posted Date:2015-04-22 22:57:29.553). How we can get rid off the overlaying oscillations. We enabled amplitude correction in OSA and in SPLICCO, but this did not help.
Best regards
Torsten shallwig
(posted 2016-07-27 06:26:36.0) This is a response from Stefan at Thorlabs. Thank you for your inquiry. I checked the serial number of you CCS100/M and the device was manufactured before we implemented the amplitude correction feature in August 2013. I have contacted you directly to offer a free amplitude correction of your unit. thomas.hofmann
(posted 2016-07-25 14:39:50.293) Is it possible to extend the upper wavelength limit to work with the spectrometer until 1080nm (I could live with reduced resolution)? shallwig
(posted 2016-07-26 07:54:03.0) This is a response from Stefan at Thorlabs. Thank you for your inquiry, we can offer a special CCS200 with a working range 300-1100nm. I have contacted you directly to discuss in more detail. ama344
(posted 2016-07-14 16:47:54.41) my spectrometer stopped responding after I tried using the trigger input. I have it plugged into my laptop and the ready light isn't lit. Help? shallwig
(posted 2016-07-15 05:54:19.0) This is a response from Stefan at Thorlabs. Thank you for contacting us and please apologize the problems you face with your CCS100 spectrometer. I have contacted you directly to troubleshoot this in detail. dmitry.busko
(posted 2016-06-03 17:08:28.733) We are interested in the range higher that 1000. Is it possible with a custom order to extend (actually move) the range of CCS200/M in more IR region ? It would be nice to have it till 1100 losing the UV part, which we anyway don't need. I know, the sensitivity of the CCD is quite bad in that region, but our another spectrometers still can detect the radiation there and the signal is quite strong.
Thank you in advance. besembeson
(posted 2016-06-09 01:20:42.0) Response from Bweh at Thorlabs USA: I will contact you regarding this special. allen
(posted 2016-05-27 14:52:21.2) We have now the CCS200 and thinking about getting CCS100 too. Can I get the spectral amplitude correction data as a graph or table?
Also, are the grating efficiency curves for CCS100 and CCS200 backwards? The ccs100 curve goes down to 250nm but the ccs200 one looks to stop at ~400, which doesn't make sense... besembeson
(posted 2016-05-27 03:25:25.0) Response from Bweh at Thorlabs USA: I will contact you regarding the amplitude correction data. Thanks for bringing our attention to the grating efficiency. We will fix that. leonov-st
(posted 2016-05-24 10:16:23.14) We are using Spectrometer CCS200/M with SPLICCO. We have question does the software perform a normalization on CCD spectral sensitivity or grating sensitivity? shallwig
(posted 2016-05-25 04:25:42.0) This is a response from Stefan at Thorlabs. Thank you for your inquiry. Our latest SPLICCO software version 4.5 which is available for download from our website in the “Software update” Tab: http://www.thorlabs.com/software_pages/ViewSoftwarePage.cfm?Code=SPLICCO supports the amplitude correction which we perform at our CCS spectrometers. In the Splicco “device settings” in the “Cal” tab the “amplitude correction” field must be checked. I have contacted you directly to provide screenshots where this feature can be found. eddie.ross
(posted 2016-02-02 08:17:26.213) This is feedback about the OSA software rather than the CCS200 spectrometer that we use. It would be very useful for my work to be able to perform peak track analysis on multiple traces simultaneously and I cannot currently find a way to do this. Does the OSA software allow this and I'm simply just missing it? If the capability does not exist, I think it would make for a great software update. Thanks shallwig
(posted 2016-02-04 07:20:48.0) This is a response from Stefan at Thorlabs. Thank you very much for your feedback. In the current design of the OSA software it is unfortunately not possible to open more than one peak-track window. We will review this request and check if we can add this feature in future versions. The “long term” window in the “Analysis” tab allows to choose several traces to get tracked at the same time. I will contact you directly to discuss this workaround in more detail. klaus.albers
(posted 2016-01-13 16:41:57.33) Is it possible to access the spectrometer from Matlab or to stream the spectral data, such it can be accessed by Matlab?
Thank you and best regards
Klaus shallwig
(posted 2016-01-14 04:28:29.0) This is a response from Stefan at Thorlabs. Thank you very much for your inquiry. Thorlabs CCS spectrometers can be controlled in MATLAB using the provided driver DLLs. These can be loaded into MATLAB using the “loadlibrary” command. The driver documentation files are saved to this folder during installation: C:\Program Files\IVI Foundation\VISA\Win64\TLCCS\Manual
I will contact you directly and send you an example how to integrate the spectrometer into MATLAB. cbrideau
(posted 2015-12-01 20:26:25.743) I'm trying to develop a LabView program for the CCS100, but the software download links are very confusing. There is no clear delineation between the CCS products and the OSA products, so I'm not sure if I am downloading the right package. When I install the software located in the 'Software' tab on this webpage, all the references in the downloaded product are for the OSA rather than the CCS. shallwig
(posted 2015-12-02 04:56:32.0) This is a response from Stefan at Thorlabs. Thank you very much for your feedback. The software package you can find on our website is for both the OSA and CCS spectrometers http://www.thorlabs.de/software_pages/ViewSoftwarePage.cfm?Code=OSA From the “Communications Protocol” Tab you can download a short guidance how to write your own application for the CCS spectrometers, also for Labview. There is also a LabView example included in the driver llb container.
I will ask our Technical Marketing team to make sure that we note in all files that this software is made for both devices to avoid any confusion. I will contact you directly to check if there are any further questions. tillsten
(posted 2015-05-28 17:15:24.683) One question:
1) All using the tlcss 64 bit libary:
Timing experiments reaveals that reading from the spectrometer takes exactly twice as long as the set intregration time. What going on? I would expect a constant time plus the intregration time. Maybe something wrong in the libary? shallwig
(posted 2015-06-03 10:53:12.0) This is a response from Stefan at Thorlabs. Thank you very much for your inquiry. The reading from the spectrometer taking twice as long as the integration time has to do the with the CCD reading out process. This is nor error in the library but wanted as tests have shown for getting best results in terms of amplitude and intensity reading the internal capacitance has to be charged same time as it gets discharged when illuminating the chip. Therefore it always takes twice the integration time to read the spectrometer. I will contact you directly to check if there are any further questions. fr
(posted 2015-05-19 09:43:40.763) Hi.
I would like to get a contact regarding the possibility of having the CCS200 calibrated together with an integrating sphere, that I have.
BR.
Frans Ravn.
ChemoMetec A/S tschalk
(posted 2015-05-19 04:13:34.0) This is a response from Thomas at Thorlabs. Thank you very much for your inquiry. I will contact you directly to discuss your application. b.lechene
(posted 2015-04-22 22:57:29.553) Hello, I have an issue (which may come from me misusing the machine). I use a CSS200 with the provided optical fiber.
When I look at different wide spectrum sources, like the sun or an incandescent light bulb, I obtain the expected spectrum with strong oscillations over-imposed (~50 nm of wavelength in period, intensity is ~10%-20% of the signal). The oscillations match perfectly from one light source to the other, which suggests strongly that it comes from the measure.
Could you tell me if there is something wrong or how I should correct for it?
Removing the fiber does not change the results.
The oscillations actually look like those on the graph you provide for the optical fibers (entitled "Spectra of an SLS201 light source taken with a CCS100 spectrometer and both BFL200HS02 and M25L01 cables.")
Thank you very much for your help
You do not need to answer on the feedback section, simply by email is good for me. shallwig
(posted 2015-04-24 03:06:43.0) This a response from Stefan at Thorlabs. Thank you very much for your inquiry. The oscillation you describe and which can be seen on the spectra you are refereeing to come from the Etalon effect which can build up between the CCD sensor and the glued safety glass. With our current generation of spectrometers this effect can be turned off by using the amplitude correction function. In the manual on page page 45 http://www.thorlabs.com/thorcat/18100/CCS200-Manual.pdf it is described how this feature can be used. By turning it on in the OSA software the oscillations should no longer be visible. I will contact you directly to troubleshoot your case in more detail. xadia.anguiano
(posted 2015-02-28 19:18:02.917) Hi. I would like to know about the measurement range of CCS175, I need to know the maximum level in dbm or watts of the optical input.
I have a white light source with an Output Power of 100mW. Is it possible to be measured? tschalk
(posted 2015-03-03 10:23:18.0) This is a response from Thomas at Thorlabs. Thank you very much for your inquriy. We do not have a specification for the Maximum Input in Watts because this will change depending on several factors, including the wavelength, integration time and gain settings. However, 100mW will most likely saturate the CCD even at the lowest integration time. In this case, I would recommend attenuating the light source, for example with an ND filter. I will contact you directly to discuss your application and the specifics of the light you will be measuring. elie.nadal
(posted 2014-11-18 07:59:09.55) I use the CCS200 with a white lamp quartz tungsten halogen lamp (QTH10) that I polarize before doing my spectrocopy measurment. I found that the spectrometer response depends on the polarization direction. Does anyone know if it comes from the fiber or the spectrometer itself? Is there a way to avoid this? I ask because this phenomena makes it really hard to normalize my measurments.
Moreover, I also noticed that my signal is average (the noise is well reduced)when I gently agitate the fiber.
I am not familiar with fiber, can someone give me an explanation about this too? shallwig
(posted 2014-11-20 03:47:02.0) This is a response from Stefan at Thorlabs. Thank you very much for your inquiry. The grating built in the spectrometer is polarization depended and by agitating the fiber you can visualize that. In general you would need to use a polarization maintaining (PM) fiber which is a single mode fiber to make repeatable measurements. If you couple polarized light into a multimode fiber you will get arbitrary polarized light at its end. But with our spectrometer you need higher intensities than you can achieve with single mode fibers, the device is designed to be used with multimode fibers. I will contact you directly to discuss your application in more detail. lambo
(posted 2014-10-11 05:12:38.343) I have two Thorlabs CCS200 spectrometers, one (serial no. M00247835) was bought in 2010 and the other (serial no. M0305135) was bought in 2013. My original plan was to monitor a background using one spectrometer and substract it from the reading of the other spectrometer in real time using the program (Thorlabs OSA) provided.
It seems this is not possible because the x-ranges of the two spectrometers are slightly different. Spectrometer M00247835 has a range of 188-1035 nm and spectrometer M0305135 has a range of 199-1017nm and the program cannot compute the difference between the two spectra. My questions are:
1. Are the slightly different ranges due to the fact that one CCS200 spectrometer is older than the other? Or would any two spectrometers have slightly different ranges?
2. Is there a way round this problem using the software provided or must I write my own labview program to deal with it? shallwig
(posted 2014-10-13 08:35:47.0) This is a response from Stefan at Thorlabs. Thank you very much for your inquiry. Every spectrometer is slightly different in its range, this comes from the alignment and its dependency on the optics used which also have some tolerances. To your second question. It is unfortunately not possible to subtract two traces with different x-axis ranges or different lengths in the current version of the OSA software. We plan to add this possibility in a future version of the software. I will contact you directly to provide you with more information and discuss your application in detail. jalvarez
(posted 2014-07-24 01:03:57.577) I need more informations:
1. Serves to analyze sample solutions quantitatively?. What accessories are needed?
2. Measure color coordinates CIE L * a * b *?, Can measure yellowness indexes, whiteness, brightness?. You can measure metamerism index? tschalk
(posted 2014-07-30 07:11:53.0) This is a response from Thomas at Thorlabs. Thank you very much for your inquiry. Unfortunately we don’t have a solution for your measurement task but I will contact you directly to discuss your application. jlow
(posted 2014-06-12 02:34:50.0) Response from Jeremy at Thorlabs: We have contacted you for a quote on the CCS200. frederico
(posted 2014-04-29 10:17:30.53) I would like to measure PL spectra on the range of 500 - 800 nm from single defects in solid state samples using the compact CCD spectrometer coupled to an home build confocal microscope. At moment I am using single photon APD detectors and the measured signal from a single defect is ~100 kcounts/s and background siganl ~30 kcounts/s. Would be suitable for to use this device for my application? shallwig
(posted 2014-04-30 06:55:39.0) This is a response from Stefan at Thorlabs. Thank you very much for your inquiry. Since we have not tested our spectrometers in very low light conditions, like those in your application, it is difficult to predict if the sensitivity and resolution would be sufficient. We would be happy to provide a loan so that you could test the spectrometer for two weeks in real experimental conditions. I will contact you directly to discuss further details. user
(posted 2014-03-17 16:11:57.1) Please add the accuracy to the data you provide in your web presentation. jlow
(posted 2014-03-20 08:04:49.0) Response from Jeremy at Thorlabs: We will update our webpage to have this specification. j.mattheis
(posted 2014-03-12 15:38:16.197) Hi,
can you also provide spectrometers in the wavelength range 350-1200 nm?
Thanks and best regards,
Julian jvigroux
(posted 2014-04-10 09:47:15.0) A response from Julien at Thorlabs: Thank you for your request! Unfortunately we currently only have those compact spectrometers with Si CCD chips that can go slightly above 1000nm. I will ocntact you directly to understand what the exact field of application is and what the requirements in terms of spectral resolution and power handling are to see if we could work on offering a customized solution. fatin_ferrari
(posted 2014-01-02 20:03:35.223) Could this device be used for measuring reflectance (reflection type of transmission)? As in, can I do the reflectance measurement but click on the 'transmittance' button? Does that valid?
Thanks in advanced! jlow
(posted 2014-01-03 10:28:38.0) Response from Jeremy at Thorlabs: You can do reflectance measurement with the CCS spectrometer. We will contact you directly to help you set this up for your experiment. tjd
(posted 2013-11-23 06:57:01.35) Can the fiber on the CCS100 be replaced with M16L01 without affecting the amplitude calibration?
(As I understand it this is the same fiber type as ships with the CCS100, but has FC/PC connector at one end) tschalk
(posted 2013-11-26 02:54:43.0) This is a response from Thomas at Thorlabs. Thank you very much for your inquiry. The amplitude calibration was performed with the included fiber. For the best accuracy we recommend to use the fiber which comes with the spectrometer. However, if you are using the same kind of fiber it will not cause significant differences. We can also offer a special item where the required fiber is included. I will contact you directly with more detailed information. user
(posted 2013-09-25 16:06:22.913) Thanks for your response on the cosine correctors. Throughput is not the same like the transmission spectrum. I'd like to know how much of the light will actually be coupled into my CCS when I use the cosine correctors. It will depend on the angle of incidence and the wavelength I suppose. E.g. for 500 nm at 0° it's 1% ... tschalk
(posted 2013-10-04 07:15:00.0) This is a response from Thomas at Thorlabs. Thank you very much for your reply. The transmission at 660nm and 0° incident angle is specified with 0.1% for the CCSB1 and 0.2% for CCSA1 and CCSA2. By considering the angle dependency curve and the transmission spectrum which are given in the manual it is possible to calculate the throughput. I hope this will help. Please contact me at europe@thorlabs.com if you have any further questions. user
(posted 2013-09-20 14:37:00.18) What is the throughput of the cosine correctors for the visible range? tschalk
(posted 2013-09-24 11:31:00.0) This is a response from Thomas at Thorlabs. Thank you very much for your inquiry. The transmission spectrum of the cosine correctors can be found in the spec sheet. For CCSA1: http://www.thorlabs.com/Thorcat/26600/CCSA1-SpecSheet.pdf, for CCSA2: http://www.thorlabs.com/Thorcat/26600/CCSA2-SpecSheet.pdf and for CCSB1: http://www.thorlabs.com/Thorcat/26600/CCSB1-SpecSheet.pdf. You can always contact me at europe@thorlabs.com if you need more detailed information. minowa
(posted 2013-09-20 14:57:52.92) Hi, I have a question about the possibility of the intensity calibration by user, because the interference-like pattern always appears. I'm trying SPLICCOv4.5.0. I can see the option "amplitude correctioin mode". Is this the such caribration mode? If so, I want to know how to use it. Thanks. tschalk
(posted 2013-09-23 10:16:00.0) This is a response from Thomas at Thorlabs. Thank you very much for your inquiry. For an intensity calibration the device has to be returned to Thorlabs. It is not possible to perform this by yourself. I will contact you with detailed information. Thar
(posted 2013-09-04 13:49:31.377) Hello,
after some time my ccs 200 spectrometer stopped responding for integration times equal and smaller than 0,1 ms (it just dont show any spectrum in splicco or labview). I would like to get back to 10us. Is there any simple way how to fix it?
Thank you. jvigroux
(posted 2013-09-06 11:50:00.0) A response from Julien at Thorlabs: Thank you for your feedback! the effect you describe is most liekly related to a misalignment of the optical hardware or a problem with hte CCD chip itself. in both cases, the unit shouldbe retunred for inspection and repair. I will contact you dircetly to set up the return kwarikun
(posted 2013-08-13 09:16:12.79) Hi, I am currently using the CCS 200 spectrometer for my spectral measurements(Intensity vs wavelength). What units are being used for intensity? Is it normalised/relative units? If so, normalised/relative to what? How do I get the Irradiance (Wm-2nm-1)?
Thanks,
Nicholas tschalk
(posted 2013-08-13 11:20:00.0) This is a response from Thomas at Thorlabs. Thank you very much for your inquiry. The spectrometers are not intensity calibrated by default but we can offer a special calibration. I will contact you with more detailed information. heiko.unold
(posted 2013-07-19 20:55:34.203) I would also like to obtain a spectral response curve for calibration of my CCS-100M, if possible. Do I assume correctly that the grating contained in the spectrometer is identical to the product GR13-1205? If so, could I also obtain the spectral response of the grating alone as csv data?
thank you very much for any help. tschalk
(posted 2013-07-23 05:31:00.0) This is a response from Thomas at Thorlabs. Thank you very much for your inquiry. If you only consider the responsivity of the sensor and the grating the results will contain errors. We offer an intensity calibration for our spectrometers and this would be the best way to get accurate results. I will contact you directly to provide more detailed information. pedro.piza
(posted 2013-07-12 11:42:34.71) Hi, we recently acquire a fiber spectrometer, we have a question, there is any calibration spectral responsibility we can use to correct the spectral we receive or is already corrected the spectra we acquire, for example i have a fluorescent light whit UV and visible spectrum, these raw spectra from the ccs200 200nm-1000nm is already corrected to the specific responsibility or relative sensibility of each pixel, like these product ho shows the respective characteristic responsibility http://www.thorlabs.com/newgrouppage9.cfm?objectgroup_id=5290 on the "specs section"
Thanks for your answer. tschalk
(posted 2013-07-17 04:35:00.0) This is a response from Thomas at Thorlabs. Thank you very much for your inquiry. The spectrometers we offer are not corrected with regard to the wavelength depending sensitivity. We offer a special intensity calibration and I will contact you with more detailed information. matthew.majewski
(posted 2013-06-26 01:50:13.173) Recently started using CCS200 with provided Splicco software. Program stops working every time I attempt to load a previously saved .jdx file for review. tschalk
(posted 2013-06-26 09:22:00.0) This is a response from Thomas at Thorlabs. Thank you very much for your inquiry. I am using currently the SPLICCO version 4.3 which can be downloaded from the web: https://www.thorlabs.com/software_pages/ViewSoftwarePage.cfm?Code=SPLICCO. I didn't experience difficulties when loading a saved .jdx file. You can try to download and install the latest software to solve this issue. I will contact you directly for more detailed information. mario.catena
(posted 2013-05-28 15:34:53.93) Hi,
I own a CCS200,could you kindly provide intensity calibration in uW/nm for such spectrophotometer? Thank you in advance for your kind replay.
Mario tschalk
(posted 2013-06-04 12:08:00.0) This is a response from Thomas at Thorlabs. Thank you very much for your inquiry. We are able to provide a relative intensity calibration but the absolute measurement of the spectral power will depend on the experimental details (coupling efficiency, fiber diameter,...). I will contact you directly for more detailed information. talebi
(posted 2013-05-14 16:39:12.067) To whom it may concern,
Please kindly provide me with the minimum input power/intensity needed for this product, for the spectrum to be still accurate.
Best regards,
Nahid jlow
(posted 2013-05-14 11:38:00.0) Response from Jeremy at Thorlabs: The minimum detectable power is difficult to quantify accurately as it will depend both on the central wavelength being measured as well as the spectral width of the signal. Typically, for monochromatic sources in the red, one can easily detector sources in the µW range or even lower but there will always be a trade ff between measurement speed and the minimum detectable power. I will contact you directly to discuss about your application. jxia
(posted 2013-04-29 16:29:22.197) why the spectrum is different using single and continuous mode? tschalk
(posted 2013-05-02 12:54:00.0) This is a response from Thomas at Thorlabs: Thank you very much for your inquiry. We are currently working on a solution for this issue and should be able to offer a software update that will fix it within two weeks. I will contact you directly with more detailed information. honoh
(posted 2013-03-21 07:39:18.673) We purchased CCS200/M and have been a happy customer so far. However, we got a rather annoying and confusing result: the obtained spectra depend on the triggering mode.
We simply measured light from a CW Xe lamp, and changed the triggering mode. We expected that the spectra should be identical as long as we kept the integration time the same. It was not the case.
(1) Ext trigger continuous (ex-trig-cont.jdx), TTL-triggered from a delay generator (SRS DG535): ordinary Xe lines with a flat background.
(2) SW trigger singleshot (sw-singleshot.jdx): slightly different from (1).
(3) SW trigger continous (sw-cont.jdx): Xe lines with a very broad background (400-800nm?). Substantially different from (1) and (2).
I tried changing the integration time, but the situation is the same: there is always a broad background for the "SW trigger continous" mode.
Are we doing something wrong? Or, is there any issue/pitfall/caveat in using the SW continous mode, such as CCD pixel charge overflow, saturation, incomplete clearance, etc?
Please advise. Thank you for your help. jlow
(posted 2013-03-27 10:41:00.0) Response from Jeremy at Thorlabs: We are currently trying to reproduce the effect that you are seeing. We will get in contact with you directly regarding this. user
(posted 2013-02-27 01:15:27.48) Hi,
I have two questions on the hardware trigger of CCS200/M. I couldn't find the answers in the manual.
(1) What is the input impedance (50 ohms or Hi-Z)?
(2) Is it TTL rising or falling edge?
Thanks a bunch. jvigroux
(posted 2013-03-04 08:20:00.0) a response from Julien at Thorlabs: thank you for your inquiry! The input impedance of the TTL is 50 Ohms and The TTL is rising edge. We will add this information to our product presentatiopn on the website. jvigroux
(posted 2013-01-25 04:01:00.0) A resposne from Julien at Thorlabs: Thank you for your feedback! As you already noticed, there is indeed currently no possibility to average the data directly from the driver. The only way is to perform the averaging within labview. I would be happy to send you a VI doing this. I will contact you directly to discuss the exact requirements. spin.amadeus
(posted 2013-01-23 15:19:08.06) I need a VI (Labview)to use the averaging mode. It is very important for me. I will try to make a VI for that, but I believe that Thorlabs can help the users of this spectrometer with more labview Vi's. tschalk
(posted 2012-12-18 10:03:00.0) This is a response from Thomas at Thorlabs: Thank you very much for your feedback. We can offer you an intensity calibration for the spectrometer. I will contact you directly for more detailed information. Best Regards, Thomas vincent.noguier
(posted 2012-12-18 11:37:55.493) This CCS200 spectrometer is really usefull and easy to use but the interferences that appear on broadband lightsources are a problem for some of our measurements (the same interferences exist with other sources but can't be seen on a single shot). An easy way to recalibrate the spectrometer would be really usefull. tschalk
(posted 2012-12-10 07:38:00.0) This is a response from Thomas at Thorlabs. Thank you very much for your inquiry. The CCS200 is able to measure spectra from broadband light sources like tungsten or halogen. If the spectrometer is not intensity calibrated you will see interference. If this causes problems we can offer an intensity calibration. If the spectrum doesn't vary linearly with integration time than you are probably not using the latest software version 4.3.93.646 which you can download here: https://www.thorlabs.com/software/MUC/SPLICCO/SPLICCO_4.3.93.646_RC.zip. This should solve this issue. I will contact you directly regarding the intensity calibration. Best Regards, Thomas. loic.segapelli
(posted 2012-12-07 18:20:07.757) The CCS200 cannot measure broadband spectra such as tungsten or halogen. This is a big limitation. Furthermore, the spectrum doesn't vary linearly with integration time. This is another major limitation. miab
(posted 2012-11-13 07:22:10.353) Hi Thomas, thanks for the response. So what can we do to increase the sensitivity of the spectrometer at around 0.5 m from the light source? So far we haven't been able to get any discernable readings from further than a 5 cm away? tschalk
(posted 2012-10-26 02:41:00.0) A response from Thomas at Thorlabs:
Thank you for your inquiry. Because of the high divergence of LEDs it is very hard to collimate and focus them into a fiber. Due to the high sensitivity of the spectrometers it should be possible to couple light into the fiber by positioning the LED directly in front of the fiber. If the power output of the LED is high enough you will be able to measure a spectrum. This approach is the most straight forward and is probably as effective as using lenses for collimation and focusing. tschalk
(posted 2012-10-25 04:01:00.0) Thank you for your feedback, we are really happy to hear that the product works well for you! Thank you for taking the time to point out this issue. The resource address for the CCS100 is 0x8081, which is what you find in the sample program. As you said, the CCS200 for example is 0x8089. In the next release, which we will supply by the end of next week, there will be a comment in the sample program which tells you the resource codes of each spectrometer type. miab
(posted 2012-10-25 12:47:25.013) Hi, we just purchased the CCS100/M. Our intended application involves measuring the distribution of radiant intensity of indoor LED lighting solutions. Is there an attachment or lens you can recommend for measuring this through the fiber optic cable? Thanks loic.segapelli
(posted 2012-10-23 20:46:33.98) Excellent product. Started writing a C# app using the sample code. There was a small mistake in the C# sample code by the way: I was getting an ExternalException at this line:
ccsSeries = new CCS_Series_Drv(resourceName, false, false);
Turns out the resource address is not 0x8081 but 0x8089 jvigroux
(posted 2012-09-03 08:53:00.0) A response from Julien at Thorlabs: Thank you for your inquiry. This problem could be related to an issue with the PCB of the spectrometer or could also only be a noise issue. Could you please contact us at techsupport@thorlabs.com so that we could discuss what the magnitude of this effect is. Based on this information, we would then be able to decide what the best way to proceed is. thank you in advance! user
(posted 2012-09-02 03:56:20.0) This is the same commenter as just before.
I know that these "Feedback" sections probably weren't intended to be used for seeking help with utilizations of the products, but I appreciate that the employees at Thorlabs have been responsive regardless.
For those reading who are considering purchasing the product: it's worked flawlessly in my research group for several years, and aside from the issue I listed below (which is likely trivial) I've had no issues with it. user
(posted 2012-09-02 03:53:39.0) Hello,
In using a modification of the Labview code supplied with the device, I've noticed that several of the values of the relative response vs wavelength are negative (not too far from zero and mostly in areas of no signal).
How should these negative values be interpreted? jvigroux
(posted 2012-08-29 06:33:00.0) A response form Julien at Thorlabs: This problem might be related to the fact that the resource (ie. the spectrometer) is already used by another software. This can happen for instance if the splicco software is already running and connected to the spectrometer. Another possibility is that the labview application was not closed properly or finished without using the function close.vi. In this case the resource is not freed automatically at the end of the application and remains blocked. I will contact you directly to see what the problem could be. aeraym
(posted 2012-08-28 14:45:18.0) Hello there!
In implementing the Labview code accompanying the spectrometer, the following error crops up:
"CCSseries Initialize.vi jvigroux
(posted 2012-08-28 13:00:00.0) A response from Julien at Thorlabs: Thank you for your inquiry! This functionality can be easily implemented in the example application through the use of the function getWavelengthData.vi. This function returns a 2D array that contains the wavelength for the respective pixel numbers so that you can use it to convert the pixel numbers into wavelengths. user
(posted 2012-08-27 18:15:51.0) Hello there!
I'm currently setting up a Labview program to run some statistics on collected spectra, and am using the backbone "Sample" program that you all were awesome enough to type up.
If no modification are made, the program outputs the spectrum in units of pixels (as opposed to wavelength in nm).
In the SPLICCO prorgram, there's an option to switch between those two options, and also a choice as to whether to use a factory-defined conversion (from pixels to nms).
The option doesn't seem to be available on the Labview Sample.vi -- is the conversion plot stored somewhere in the program files? Where can I find it?
Thanks and cheers. jlow
(posted 2012-08-15 10:52:00.0) Response from Jeremy at Thorlabs: Thank you very much for your feedback. The absolute intensity calibration is not a feature we offer at the moment in our CCS spectrometer series. We plan to implement this soon and we are working on the procedure currently. Unfortunately we do not have a set time frame on when this would be completed yet. jrestrep
(posted 2012-08-14 18:40:32.0) Hi, this is more like a question. Does the CCS200 provide absolute intensity measurements? I am interested on combining the functionality Spectrometer-Powermeter. In case it does not, I would suggest to include it.
John. jvigroux
(posted 2012-05-02 11:55:00.0) A response from Julien at Thorlabs: Thank you for your inquiry. This behavior is highly surprising. We cannot reproduce this error so I would suspect that this effect is related to the experimental setup you are using. I will contact you directly in order to troubleshoot this problem. xiexiaojiang1986
(posted 2012-04-30 12:45:30.0) Hi, I have a problem with this software for CCS 200, SPLICO. When I use any average value larger than 1, the spectrum dissappears after a change from the incoming light. Can you fix it? PS: I am using the latest version of this software. Thank you so much! jvigroux
(posted 2012-04-23 03:38:00.0) a response from Julien at Thorlabs: It is indeed possible to use the driver and SDK included in the software package of the spectrometers to add extra functionality. The supported platform are Matlab, labview, C/C++ and C#. the data is installed by default under the following path: C:\Program Files\IVI Foundation\VISA\WinNT\Thorlabs CCSseries. in the folder manual, you will find an html data that lists and describes all the functions included in the driver. Concerning the type of lenses you would need to achieve the required imaging system, we would need to know also what the distance between the fiber and the sample will be. We will contact you directly to help with this point tcohen
(posted 2012-04-17 18:39:00.0) Response from Tim at Thorlabs to Abel: Thank you for contacting us. We are currently looking into this and we will update you shortly with a complete answer. abel.santos
(posted 2012-04-16 06:05:15.0) Hi,
We are very interested in your Compact CCD Spectrometer (Model CCS 100). However, before making a decision, we would like to know some technical characteristics:
1 - We have read that it is possible to modify your software by Labview or other software. We are very interested since we want to obtain multiple spectra as a function of time, calculate the optical thickness by fast Fourier transform and plot it in the course of time (i.e. in real-time = as the spectra are acquired). Please, could you send us more information about this (we have read your manual but there is not information regarding this issue) - This is very important for us.
2 - We would like to focus the light from our source on 1mm-2 of our samples, approximately. Could you suggest us a set of lens for that purpose which are compatible with this fiber spectrometer.
Thank you very much for your attention.
I am looking forward to hearing from you.
Kind regards,
Abel jvigroux
(posted 2011-11-07 11:59:00.0) A response from Julien at Thorlabs: thank you for your feedback! we usually do not use versions of Labview that are too old for thge creation of the drivers as this can lead to compatibility issues over time. In order to take into account the fact that Labview versions are in most cases not down-compatible, we have included to most of our software packages the front panel file (.fp) of the CVI driver. Using this file and the provided driver DLL, one can re-create the VIs from the dll within a few clicks using the instrument driver import wizard of National instrument (free tool). Should you have experienced any issue with the driver conversion, please do not hesitate to contact tech support and we will provide you with an already converted VI library for your Labview version. Ian
(posted 2011-11-07 04:39:05.0) It should be made clear that example LabVIEW code and drivers are only available for LabVIEW versions 8.6 and upwards.
For version 8.5 and earlier the user must provide their own code to interface with the appropriate DLLs (as recommended by UK Tech Support). I am a little surprised that Thorlabs can't generate the required code and make it available for all customers. jvigroux
(posted 2011-10-20 11:28:00.0) A response form Julien at Thorlabs: the calibration file is stored in the spectrometer and is read out in the same way through Splicco or through Labview. I suspect that there is maybe another problem in your Labview application that creates the shift, like for instance an array dimension issue. I will contact you directly to check with you what the exact reason for this shift is. g.mistlberger
(posted 2011-10-17 16:38:18.0) Hello. We faced another problem with the wavelength calibration data using LabView. For some reason the calibration file supplied with the labview kit does not produce correct spectra. The resulting spectra are redshifted by almost 30 nm. I previously sent a little script to test the batchmode speed in Labview and it shows the same offset. Is there a different calibration file provided with SPLICCO and LabView? Because in Splicco everything is fine. jvigroux
(posted 2011-10-07 02:43:00.0) A response from Julien at Thorlabs: Thank you for your feedback. Yes there a few workarounds, some of which we are in the process of integrating in the release software version. Which one will work best is however mostly depending on the exact application you have. I will contact you directly in order to see which approach should be used. ursula.gibson
(posted 2011-10-06 16:10:09.0) I have the same problem "The artifact you see is related to the simultaneous use of the blazed grating and the CCD chip that results in an interference effect." Is there a workaround? I cannot divide out these fringes to make useable transmission measurements. jvigroux
(posted 2011-09-30 10:09:00.0) A response from Julien at Thorlabs: Dear Guenter, thank you for your inquiry. The sequential saving is not included as a function in the driver as it is highly platform and language dependent: based on the type of environment you are programming in, the saving and memory allocation will be done in different ways. You can however use the standard labview IO functions to achieve similar results. You in principle just need to save repeatedly the scan data, using a counter on the number of loops you want to save. For the timed mode, you can either use the software trigger or also use the wait function of Labview. The Data is not buffered in the spectrometer but the 7ms you mention can depend on a lot of factors like the integration time but also of course the architecture of the application program that reads out the data itself. I will contact you directly in order to discuss with you your application in details in order to see which approach can be used to obtain the desired behavior g.mistlberger
(posted 2011-09-30 14:01:48.0) In an earlier response, you mentioned the "sequential saving" feature in SPLICCO software, and that all functions from SPLICCO are available as LabView VIs. However, we were unable to find this VI in the installed kit.
Moreover, is the spectrometer buffering the data somewhere in sequential mode? I did a test on my PC and the sampling rate was approximately 7ms per spectrum for 1000 spectra. Can this be prolonged by buffering the data into RAM? Or is this data temporarily stored in the spectrometer?
Regards,
Guenter jvigroux
(posted 2011-09-23 05:23:00.0) A response frm Julien at Thorlabs: the function is normally directly accessible from the function palette in Labview. It can also be found in the llb file CCSseries.llb which is installed in the instr.lib folder of Labview. Should there be no labview installed on the computer when the driver for the CCS is being installed, the labview part of the driver will not be installed on the computer. g.mistlberger
(posted 2011-09-21 15:46:51.0) How is it possible to switch from pixel values to wavelength when using a labview interface. We cant find the "getWavelengthData" function described in the help file in the provided LabView example. jjurado
(posted 2011-08-05 09:10:00.0) Response from Javier at Thorlabs to acable: Thank you for your feedback. The Intensity vs. Wavelength graph has been set as the default display and will be present in the next software release. acable
(posted 2011-08-03 17:45:27.0) I just installed a CS100 and the devices comes up with the horizontal axis in units of "Pixel", as it is a pain to find the switch that is burried under "View" then "Device Settings", id suggest you just have the default be wavelength. I could be mistaken, but not to many people are going to want to think in Pixels. jjurado
(posted 2011-08-03 11:12:00.0) Response from Javier at Thorlabs to Thomas.Gaumnitz: The CCS175 spectrometer can be used for measurements up to 1100 nm. The reason why we only specify the operating range up to 1000 nm is because we do not guarantee sub-nanometer resolution above this wavelength. Another consideration is that above 1000 nm, it would be possible to observe second order peaks generated by 500-550 nm sources, which is of course not a reason for concern if both wavelength ranges are not being measured simultaneously (500-550nm and >1000nm). Thomas.Gaumnitz
(posted 2011-08-03 08:32:29.0) For the CCS175 the wavelength range is given by 500-1000nm whereas the CCD range is specified to 350-1100nm.
What is the highest measurable wavelength with spectrometer?
Regards, Thomas bdada
(posted 2011-07-28 15:00:00.0) Response from Buki at Thorlabs:
Thank you for using our Feedback tool. We have contacted you to learn more about the spectral efficiency data you need. Below is a link to the specification sheet for the CCS100 - pages 10 and 11 have some performance curves you may find useful.
http://www.thorlabs.com/Thorcat/18100/18143-M01.pdf junis.rindermann
(posted 2011-07-28 06:08:34.0) I want to do colorimetry with the CCS100. Could you please provide the spectral efficiency curve of the complete detector (with/without fibre). please contact me directly.
many thanks,
j jvigroux
(posted 2011-07-07 15:09:00.0) A response form Julien at Thorlabs:dear Tapish, the latest version of splicco (4.2.1) that can be donwloaded directly form the product page of the CCS spectrometers, offers the possibility to automatically save a scan sequence of up to 1000 scans. The user can either save them as fast as possible or set a fixed time interval in between the scans. This function is available by going to tools->sequential saving. We also provide a Labview driver that is automatically installed on your PC upon software installation. All functions that can be found in splicco exist as VIs and can be directly accessed from the function palette of Labview (Instrument I/O->CCS Series Spetrometers). tapish.agrawal
(posted 2011-07-07 05:51:34.0) I am using this spectrometer for Laser induced plasma spectroscopy.
I can not seem to find the option to save multiple measurements at the same time. I am creating laser induced sparks at 5 Hz and I would like to save 100 shots at the same time. But SPLICCO can save only single shot, which was not the case with the previous spectrometers that I have used.
Could you please provide a solution to this or send me a labview VI with required drivers so that I can use this product.
Thanks and Regards,
Tapish AGARWAL
Doctorant,
Laboratoire EM2C,
Ecole Centrale Paris,
Grande Voie des vignes,
92290 Chatenay Malbary, FRANCE julien
(posted 2010-12-08 12:02:00.0) a response from Julien at Thorlabs: The artifact you see is related to the simultaneous use of the blazed grating and the CCD chip that results in an interference effect. The dip is related to the filter that is used. I will contact you directly to further discuss the origin of those artifact and see which solution is the best adapted to your application. Tadeusz.Przerwa-Tetmajer
(posted 2010-12-08 07:10:54.0) Please take a look at the tungsten lamp spectrum from my brand new CCS200: http://img163.imageshack.us/img163/4448/tungsten.jpg. Strange, isnt it? And now look at two other examples (white LEDs): http://img257.imageshack.us/img257/1984/creevsalder.jpg and notice the strange peek at ~660nm. It is always visible... Whats wrong with my CCS200? julien
(posted 2010-12-02 17:10:41.0) A response from Julien at Thorlabs: The SPLICCO software package contains two program example in C as well as in Labview. Those can be found in the following folder: C:\Program Files\IVI Foundation\VISA\WinNT\Thorlabs CCSseries\Examplesthis path might vary depending on the VISA version you use. Should you experience any problem with those examples, please do not hesitate to contact tech support at techsupport@thorlabs.com aykutlu
(posted 2010-12-02 10:35:49.0) We bought the product hoping to get Visual Basic examples but none came out of the installation.
Any examples for C, C++, Delphi or VB is essential
for this product to be useful in our experiments.
Could you please provide us some? user
(posted 2010-10-18 07:35:26.0) Do you have an optical trigger (photo-diod-based) in your catalogue that could be used with this product? Thorlabs
(posted 2010-08-31 13:29:44.0) Response from Javier at Thorlabs to harald.hovland: The Splicco software does not have the capability to record the spectrum profile as a function of time. This feature can be developed with a program such as LabVIEW, but the expected scan rate would be system dependent, most likely in the range of 1-10 Hz. For higher temporal resolution you could use a trigger delay, which can be programmed at different times during the transient event. Regarding your second question, the internal (freerun) trigger allows scan rates up to 200 Hz (for 5 ms integration time). In external trigger mode the maximum scan rate, with the same integration time, is 100 Hz. We will clarify the information on the web shortly. harald.hovland
(posted 2010-08-31 12:21:57.0) We are considering one of these spectrometers to get the spectrum as a function of time to monitor a transient event, for example during a 10 sec period. After reading through the manual, I was not able to find such a feature. Is it possible to do this with the standard software? If not, is it possible to do this with the drivers included, for example with the NI driver?
Another question: The specs indicates that a max of 200 scans/s is possible, but elsewhere it is written that the maximum trigger is only 100 Hz. Does that mean the 200 scans/s is only available using internal trigging? julien
(posted 2010-04-20 14:43:55.0) a response from Julien at Thorlabs: Dear Mike. Thank you for pointing this out. You are absolutely right that the user should be able to know what the baseline correction is, and most importantly have access to the noise floor. The SPLICCO software will be accordingly modified so as to allow the user to access the intensity values that are below the baseline. The new version of the software should be online within the following week. mike.stamp
(posted 2010-04-19 12:12:15.0) CCS100 mini-spectrometer: The model I have recently bought exhibits a baseline signal (i.e. the noise level of the CCD) that is set below zero (actually I estimate to be about -0.02, where 1.0 is signal saturation). Julien (europe@thorlabs.com) replied that this is the correct factory setting and is deliberate. This surprises me because I would have thought most people would actually like to see the noise floor! (and how well the subtract background works). Other prospective purchasers should be aware of this feature. apalmentieri
(posted 2010-03-16 09:07:05.0) A response from Adam at Thorlabs to lunghao.hu: Mercury lamps typically emit light from the UV range(250nm) to the visible range. The CCS100 is designed to detect light from 350-700nm. Therefore, it will detect some of the light from your source, but will not detect the lower UV regions, below 350nm. If you need to also measure the lower UV wavelengths, we also offer the CCS150, which will detect light from 200-400nm. I believe that it should be able to detect the intensity from the mercury lamps. lunghao.hu
(posted 2010-03-15 17:51:31.0) I will use a high pressure mercury lamp for my experiment. Is this product, CCS 100 spectrometer available to detect the wavelength range and intensity ? apalmentieri
(posted 2010-03-05 19:13:48.0) A response from Adam at Thorlabs to jez: Thanks for the extra information. We are intrigued by your suggestion and are seriously considering adding this feature to the software, but there is no firm date for this addition. In the meantime, we would like to contact you directly to get more information about your application. user
(posted 2010-03-04 11:37:36.0) Thanks for your reply Adam. It would be a very attractive feature to derive CRI and CCT from the spectrum and really set your product above the competition. As an electronic designer working in the design of LED fixtures for film/TV/stage and also photography, these extra metrics are becoming more important. I like to see the detailed spectrum but my customers want to know the metrics that they understand. Put your best software/maths people on it :-) apalmentieri
(posted 2010-03-03 19:36:19.0) A response from Adam at Thorlabs to Jez: Currently, the software that we provide does not contain the capabilities to perform Correlated Color Temperature and Color Rendering Index. jez
(posted 2010-03-02 19:40:02.0) Im interested in the CCS100. As well as the detailed spectral analysis that I need, Id also like to measure Correlated Color Temperature and Color Rendering Index, is that something your software can perform once it has acquired the spectrum?
Many thanks, JS in the UK. apalmentieri
(posted 2010-03-01 20:00:41.0) A further response to dsmehta from Adam at Thorlabs: I have been informed by our electronics division that a 200-1000nm spectrometer is in the development phases. Right now the sorting filter is the biggest issue, but hope to find a solution soon. apalmentieri
(posted 2010-03-01 19:56:10.0) A response from Adam at Thorlabs to Alexander: The CCS175 does have a slit, which is 20um(width) x 20mm(Length). We will contact you via email to get the efficiency curve. The sensor used in the CCS175 is the Toshiba TCD1304DG, which contains 3648 pixels. alexander.jelzow
(posted 2010-02-26 13:37:09.0) Some additional questions about CCS175:
Does it have a slit? If yes, what is its width?
Can you provide a spectral efficiency curve for the grating?
Does it use the Toshiba 3648 sensor?
Best regards apalmentieri
(posted 2010-02-08 09:10:38.0) A response from Adam at Thorlabs to dsmehta: I have spoken with our design engineers about this product and they said it is possible to make this type of spectrometer, but based off the current design the disadvantages outweigh the advantages. A wavelength range > 1:2 has issues due to diffractions of a higher order: Our spectrometers are based on diffraction gratings - depending on the wavelength, the beam is being deflected under different angles to a specific line on the CCD camera. If we make a design covering, say 350 - 1100nm, a 350nm input signal generates 2 peaks on the CCD line- diffraction of 1st order at 350nm, and its 2nd order diffraction makes a peak at 700nm. In that case, any input signals between 350 and 550nm would cause a 2nd peak between 700 and 1100nm making it hard to distguish wavelengths between 350-550nm. Please note that we are always looking for new product ideas and I have asked our design engineers to look into any new designs that may provide a broader wavelenth range. dsmehta
(posted 2010-02-06 14:02:36.0) is it possible to make Spectrometer for wide range from 350 - 1100 nm apalmentieri
(posted 2010-01-21 09:03:05.0) A response from Adam at Thorlabs to ckmin: The fiber used in the CCS175 is the AFS50/125Y and covers a wavelength range of 300nm-2500nm. The sensor is a Si sensor that would cover a wavelength range of 400nm-1100nm. The operating wavelength range of the grating is 500nm-1000nm. I will email you directly to see if you need more information about the spectral response. ckmin
(posted 2010-01-20 22:05:36.0) What is the total spectral response of ccs175 including grating, fiber and sensor? klee
(posted 2009-11-16 15:52:06.0) A response from Ken at Thorlabs to Beta Electronics: Please provide some additional information: 1) Is the spectrometer properly connected to the PC? 2) How is the light coupled into the fiber? sales
(posted 2009-11-15 05:53:27.0) How can we start to measure the input spectrum to which the optical fiber is subjected ?
We are Beta electronics just imported the ccs 100 serial no. moo234533.
WE FOLLOWED THE INSTRUCTIONS IN THE MANUAL BUT FOR THE STEP OF DETECTING INPUT DATA WE ARE NOT
RECEIVING ANY RESPONCE.
THANK YOU klee
(posted 2009-07-27 11:40:17.0) Response from Ken at Thorlabs to jrstetter99: A techincal sales rep. from our Germany office will contact you directly for more information. jrstetter99
(posted 2009-07-26 12:03:32.0) can you make an OEM 254 nm UV bench for purchase by qty 100 or more? thx Laurie
(posted 2008-12-10 11:42:03.0) Response from Laurie at Thorlabs to lsandstrom: Thank you for your feedback concerning our spectrometers. In response to your post, we have added our Fabry-Perot Interferometers to our list of scrolling hot spots at the top of the page. We hope that you find this helpful when navigating out site. lsandstrom
(posted 2008-12-08 20:17:50.0) It would be useful to have easy links to the other spectrometers that Thorlabs offer e.g. the SA200, and the SP2 |

 Zoom
Zoom
Click to Enlarge
The CCT10 Spectrometer is shown with a cosine corrector and included fiber patch cable. Cosine correctors are available separately below.
- Compact Crossed Czerny-Turner Spectrometer Design
- Choose from Three Wavelength Ranges:
- 200 - 1000 nm
- 350 - 700 nm
- 500 - 1000 nm
- Resolutions from <0.5 to <2 nm Available (See Table in Overview Tab for Details)
- PC Control with USB or Ethernet Connection
Thorlabs' Crossed Czerny-Turner Spectrometers are compact devices roughly the same size as a portable hard drive. Each spectrometer is wavelength calibrated and amplitude corrected and is shipped with a calibration report and amplitude correction test data. The test data is valid for both the spectrometer and the included patch cable. Thorlabs recommends recalibrating the spectrometer every 12 months, and also whenever a new patch cable will be used with the spectrometer, as the cable affects the amplitude correction. Thorlabs' offers a factory recalibration service; to order this service, scroll to the bottom of the page and select Item # CAL-CCT.
The input port accepts SMA905-connectorized fibers, and the CCSB1 cosine corrector available below can be used to adapt the spectrometers for free-space applications.

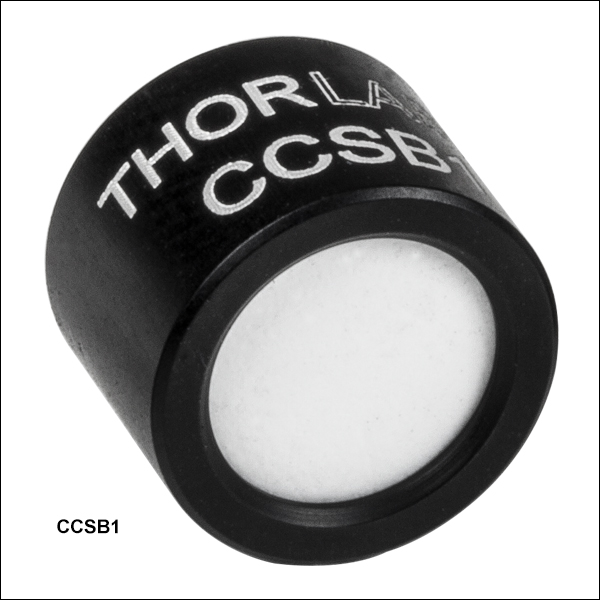 Zoom
Zoom- Small Diffuser Connects to SMA-Connectorized Fibers or Spectrometer Input Port
- Allows Thorlabs' CCT and Legacy CCS Series Spectrometers to be Used for Free-Space Measurements
- Reduces the Source Alignment Sensitivity of Measurements
Thorlabs' Cosine Correctors allow Thorlabs' CCT and legacy CCS Series Spectrometers to be used for free-space measurements. The correctors incorporate a diffuser in a tightly toleranced metal housing. The CCSA1 and CCSA2 correctors are designed to mate with SMA-connectorized fiber optic cables. The third corrector, Item # CCSB1, is designed to mate directly to the input port of the spectrometer. An image of each cosine corrector connected to a spectrometer can be viewed by clicking on the photos in the table below.
Click to Enlarge
The transmission of the diffuser material used in the cosine correctors. Each curve is normalized to the maximum measured transmission through that sample.
Click to Enlarge
The cosine correction plot for each diffuser can be viewed by clicking on the info icons in the table below.
The diffuser in a cosine corrector allows light to be collected from up to a 180° angle with the diffuser surface. This minimizes issues caused by sampling geometry inherent to other devices, such as bare fiber optics or collimating lenses. As such, these diffuser packages are ideal for use in spectral measurements or as irradiance probes.
A plot showing the transmission spectrum of spectralon is shown to the right. Each curve is normalized to the maximum measured transmission through that sample. Please note that the transmission is highly wavelength dependent when selecting a cosine corrector for your application.
The cosine correction plot and transmission spectrum for each cosine corrector can be viewed by clicking on the blue info buttons (![]() ) in the table below.
) in the table below.
| Item # | CCSA1 | CCSA2 | CCSB1 |
|---|---|---|---|
| (Click Photo for Details) |  |
 |
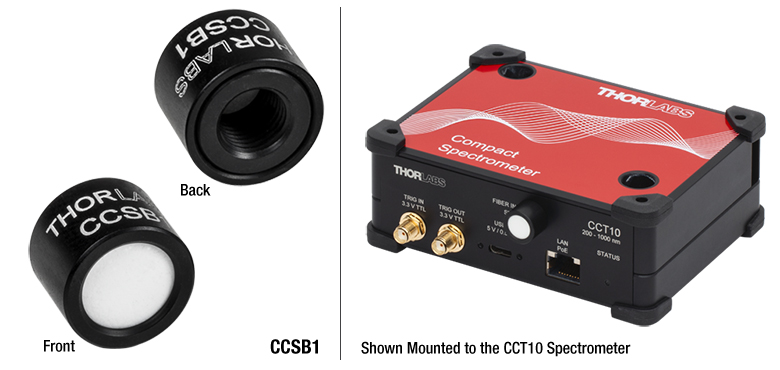 |
| Cosine Correction and Transmission (Click for Details) |
|||
| Diffuser Thickness | 0.5 mm | 1 mm | |
| Transmission @ 660 nma | 0.2% | 0.1% | |
| Clear Aperture | Ø4 mm | Ø8.5 mm | |
| Housing at Input Aperture | Smooth Ø7.5 mm | Externally SM05 (0.535"-40) Threaded | Smooth Ø12.0 mm |
| Housing Material | Anodized Aluminum | ||
| Output Port | Accepts SMA Connectors | Connects Directly to CCS Series Spectrometer Input | |
| Suggested Mounting Adapters | AD8F | SM1A6T, AD12T | AD12NT, AD12F |

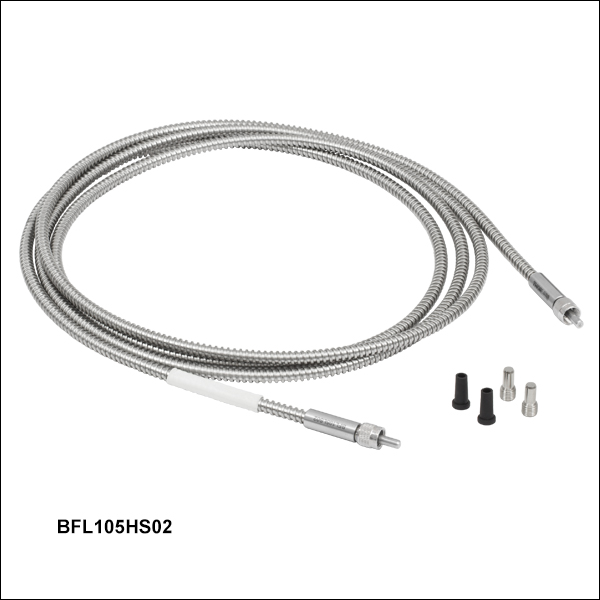 Zoom
ZoomClick to Enlarge
Spectra of an SLS201L light source taken with a CCT10 spectrometer and both BFL200LS02 and M25L01 cables.
- Optimized for Use with our CCT and Legacy CCS Series Spectrometers
- Available with One Linear and One Round End or with Two Linear Ends
- Low- or High-OH, Ø105 µm or Ø200 µm Core Multimode Fiber
- Linear End Matches the Entrance Slit of a Spectrometer for Higher Signal Levels
These fiber bundles contain 7 fibers arranged in a line configuration (linear) at one end and either a line configuration or a circular configuration (round) at the other end. These fiber bundle cables are commonly used to increase the coupling efficiency into spectrometers that have an entrance slit, such as those sold above. The linear end matches the shape of the entrance slit better than a single fiber or round bundle configuration, and therefore increases the amount of light entering the spectrometer. These fiber bundles use SMA905 connectors for compatibility with most spectrometers. They are built with Ø105 µm or Ø200 µm core Thorlabs multimode fiber with either a high or a low hydroxyl ion (OH) content for 250 - 1200 nm or 400 - 2400 nm, respectively.
When plugging the linear end of the bundle cable into the spectrometer or another device, the fiber array must be aligned with the entrance slit. For ease of alignment, the fiber array's axis is indicated by a line on the connector sleeve. Precise alignment of the bundle and slit is not critical, but misalignment of more than ±5° can cause a reduction in signal strength. In order to maximize signal intensity, we recommend rotating the bundle while monitoring light levels in the spectrometer, and then tightening down the threaded portion of the SMA connector to lock the bundle in place. When using these bundles with our CCT and legacy CCS Series Spectrometers, the fiber array should be oriented vertically.
Each patch cable includes two rubber and two metal protective caps that shield the connector ends from dust and other hazards. Additional CAPM Rubber Fiber Caps and CAPSM Metal Threaded Fiber Caps for SMA-terminated ends are also offered separately.
Please visit our Round-to-Linear Bundles Page or Linear-to-Linear Bundles Page for full product details. We also offer 1-to-4 Fan-Out Cables with Linear Common End Configurations.
| Calibration Service Item # | Compatible Spectrometers |
|---|---|
| CAL-CCT | CCT10, CCT11, CCT12 |
| CAL-CCS2 | CCS100(/M), CCS175(/M), CCS200(/M) |
Thorlabs offers a factory amplitude correction update and wavelength recalibration service for our Compact CCT and legacy CCS Series Spectrometers. To ensure accurate measurements, we recommend recalibrating the devices every 12 months. We also recommend recalibration whenever a new patch cable is going to be used with the spectrometer, as the cable used affects the amplitude correction. The table to the right lists the spectrometers for which the CAL-CCT and CAL-CCS2 recalibration service is available by purchasing the appropriate item below. When sending the part for recalibration, please include the patch cable that the spectrometer is being used with. For more information, please contact Tech Support.
Requesting a Calibration
Thorlabs provides two options for requesting a calibration:
- Complete the Returns Material Authorization (RMA) form. When completing the RMA form, please enter your name, contact information, the Part #, and the Serial # of the item being returned for calibration; in the Reason for Return field, select "I would like an item to be calibrated." All other fields are optional. Once the form has been submitted, a member of our RMA team will reach out to provide an RMA Number, return instructions, and to verify billing and payment information.
- Chose the appropriate Item # for the spectrometer using the table above, enter the Part # and Serial # of the item that requires recalibration below, and then click "Add to Cart". A member of our RMA team will reach out to coordinate return of the item for calibration. Should you have other items in your cart, note that the calibration request will be split off from your order for RMA processing.
Please Note: To ensure your item being returned for calibration is routed appropriately once it arrives at our facility, please do not ship it prior to being provided an RMA Number and return instructions by a member of our team.