 Products Home
Correlated Photon-Pair Sources
- Photon-Pair Generation at 810 nm or 1560 nm (C-Band)
- Heralded Photon-Pair Sources with g(2)(τ = 0) < 0.1
- Sources with <0.25 nm or 10 nm Photon Bandwidths
- Model with Coincident Pair Rates >450 000 Per Second
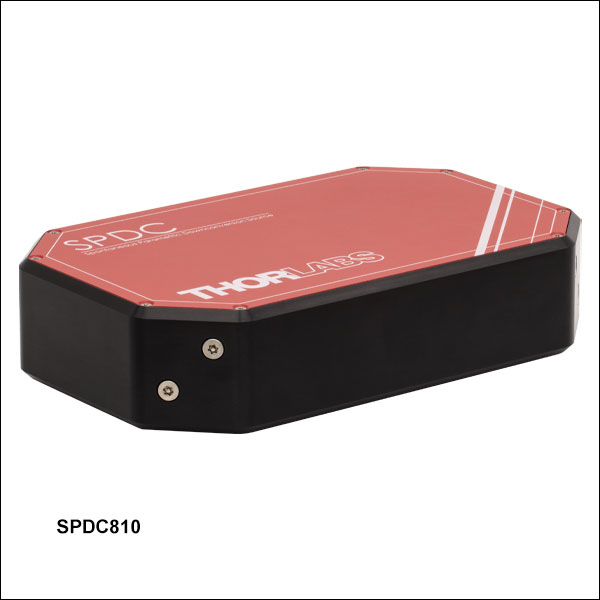
SPDC810
810 nm Correlated Photon-Pair Source, 10 nm Bandwidth
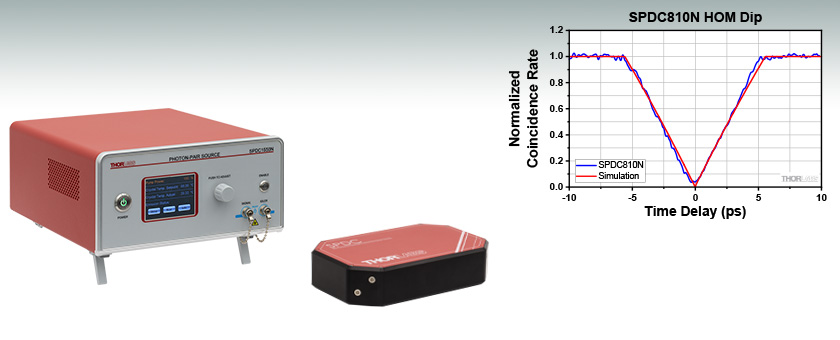
HOM Interference Characterization of the SPDC810N
SPDC810N
Narrow Band Correlated Photon-Pair Source
SPDC1550N
1560 nm Correlated Photon-Pair Source, <0.25 nm Bandwidth


Please Wait
Typical Applications
- Sub-Shot-Noise Imaging
- 2-Photon Interference
- Single-Photon Sensor Characterization
- Quantum Key Distribution
- Quantum Time Transfer
- Heralded g(2) Measurements
- Absorption Spectroscopy
- Quantum Metrology
- Waveguide Characterization
- Quantum Networks
- Telecom Network Links
| Table 1.1 Key Specifications | |||
|---|---|---|---|
| Item # | SPDC810 | SPDC810N | SPDC1550N |
| Operating Wavelength | 810 ± 2 nm | 810 ± 1 nm | 1560 ± 1 nm |
| Photon Bandwidth | ~10 nm | <0.25 nm | |
| Heralding Ratio, ηsia | >0.45 | >0.30 | |
| Max Coincident Pairs/Second | >450 000 | >100 000 | |
Features
- Turnkey Spontaneous Parametric Down-Conversion (SPDC) Sources with Integrated Pump Lasers
- Sources Use Periodically Poled Potassium Titanyl Phosphate (PPKTP) Crystals for Collinear Type-II SPDC Output
- Remote Operation via Software
- Two AR-Coated FC/PC to Uncoated FC/PC Patch Cables Included
- Fiber Bulkhead and Connector Cleaners Included
- Please Contact Tech Sales to Inquire About Custom SPDC Sources
Thorlabs' Correlated Photon-Pair Sources generate a pair of photons near 810 nm or 1560 nm (C-band). Each source contains an integrated, user-adjustable pump laser for turnkey operation capable of high-brightness photon-pair generation rates. The SPDC810N and SPDC1550N narrowband sources generate photon pairs with 0.25 nm photon bandwidth at a rate of >100 000 coincident pairs per second and a heralding ratio of >0.30. Comparatively, the SPDC810 source generates photon pairs with a broader ~10 nm photon bandwidth but at an increased rate of >450 000 coincident pairs per second and a higher heralding ratio of 0.45.
A zero-time-delay second-order correlation function [g(2) (τ = 0)] value of <0.1 can be achieved with these sources, making them ideal for quantum optics applications. For complete performance specifications, please see the Specs tab. More information on characterization of these quantum sources can be found in the Single-Photon Output and HOM Interference tabs.
Click to Enlarge
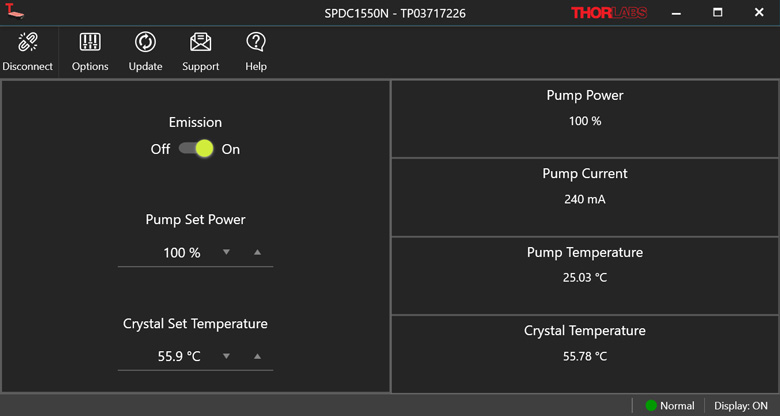
Figure 1.2 The SPDC software provides a simple GUI, which automatically identifies connected Photon-Pair Sources and allows control of the pump power and emission. The GUI also displays the pump power, current, and temperatures, allowing the user to check the state of the device at a glance.
Thorlabs' turnkey SPDC systems are categorized as correlated photon-pair sources, distinct from entangled photon-pair sources. The SPDC process creates photons virtually simultaneously, so that one of the photons can be used to signal (or herald) the existence of the other, making it possible to perform measurements on single photons. For this reason, the signal and idler photons are referred to as a herald (or heralding) and heralded photon, respectively. Photon-pair sources, also known as bi-photon sources, are also distinguished from other technologies used to generate single photons, including weak classical sources like a strongly attenuated laser, single-emitter single photon sources like color centers in diamond, or quantum dots.
All Thorlabs photon pair sources rely on a type-II collinear SPDC process in periodically poled potassium titanyl phosphate (PPKTP) crystals, which are also available individually with suitable mounts, ovens, and temperature control. In each SPDC source, the PPKTP crystal converts individual shorter wavelength photons into pairs of orthogonally polarized longer wavelength photons (the signal and idler) in a single event. The resulting signal and idler photons propagate with orthogonal polarizations; see the SPDC Tutorial tab for details.
To efficiently collect the down-converted light, the signal and idler channel outputs have FC/PC connectors, with a 2.0 mm narrow key aligned to the output polarization of the channel. For the SPDC810(N) sources, we recommend using P1-780PMAR-2 patch cables, two of which are included with each photon-pair source, or PM780-HP FC/PC patch cables such as P1-780PM-FC-1, to maintain polarization. If polarization information does not need to be retained, 780HP FC/PC patch cables can also be used. For the SPDC1550N source, we recommend using P1-1550PMAR-2 patch cables, two of which are included with the source. The AR-coated ends of the included fiber should never be mated to another fiber and are meant for free space launching only. For information on using the included fiber bulkhead and connector cleaner, see the Fiber Cleaning tab.
All photon-pair sources are compatible with the software available in the Software tab for remote PC operation. Figure 1.2 shows the simple GUI for pump laser control and monitoring. The SPDC810N and SPDC1550N sources can also be controlled via the touchscreen display and knob on their front panels.

| Item # | SPDC810 | SPDC810N | SPDC1550N |
|---|---|---|---|
| Optical Specifications | |||
| Crystal Type | PPKTP for Type-II SPDC | ||
| Operating Wavelength | 810 ± 2 nm | 810 ± 1 nm | 1560 ± 1 nm |
| Heralding Ratio, ηsi a,b | >0.45 | >0.30 | |
| Max Coincident Pairs/Secondc | >450 000 | >100 000 | |
| Wavelength Stabilitya | ±2.5 nm | ±0.1 nm | |
| Photon Bandwidth | ~10 nm | <0.25 nm | |
| Temperature Control | No | Yes | |
| Wavelength Tuning Ranged | None | >8 nm | 3 nm |
| g(2)(τ = 0) a,e | <0.1 | ||
| Extinction Ratio | >17 dB | ||
| Lifetime | >2500 Hours of Pump Emission | >2500 Hours of Pump Emission | >10 000 Hours of Pump Emission |
| Pump Laser Power | Up to 150 mW | Up to 40 mW | |
| User Serviceable | No | No | No |
| Electrical Specifications | |||
| Input Voltage | 100 - 240 V | ||
| Frequency | 50 - 60 Hz | ||
| Power Consumption | 25 W (Max) | 20 W (Max) | |
| Fuse Rating | None | 2 A, 250 V | |
| Fuse Type | None | Time-Lag (Slow-Blow) | |
| Fuse Size | None | 5 mm x 20 mm | |
| PC Connections | |||
| Interface | RS232 Serial | USB Type B | |
| Environmental Requirements | |||
| Room Temperature | 18 °C to 25 °C | ||
| Storage Temperature | -10 °C to 60 °C | ||
| Humidity | Non-Condensing | ||
| Typical Performance Plots (Click to View Plot) | |||
| Wavelength Tuning | - |  |
 |
| Physical Dimensions | |||
| Dimensions (L x W x H)f | 10.13" x 6.47" x 2.24" (257.2 mm x 164.2 mm x 56.9 mm) |
9.85" x 11.99" x 4.88" (250.2 mm x 304.6 mm x 123.9 mm) |
|
| Mechanical Drawing |  |
 |
|
| Weight | 2.6 kg | 4.5 kg | |
Click to Enlarge
Figure 3.1 The SPDC Software GUI
Software
Version 2.1.0
The SPDC software package, which includes a GUI for control of the SPDC810, SPDC810N, and SPDC1550N Correlated Photon-Pair Sources.
Software for Correlated Photon-Pair Sources
The SPDC software provides a simple GUI, which automatically identifies the connected photon-pair source and allows control of the pump power and emission. The GUI also displays the pump power, current, and temperatures, allowing the user to check the state of the device at a glance.
SPDC810N and SPDC1550N Front and Back Panels

Click to Enlarge
Figure 4.1 SPDC810N and SPDC1550N Narrowband Correlated Photon-Pair Source Front Panel
| SPDC810N and SPDC1550N Narrowband Correlated Photon-Pair Source Front Panel | |
|---|---|
| Callout | Description |
| 1 | Push-Button Power Switch |
| 2 | Touch-Screen Display |
| 3 | Pump Power and Crystal Temperature Knob |
| 4 | Signal Channel Output, 2.0 mm Narrow Keya FC/PC Fiber Connector |
| 5 | Idler Channel Output, 2.0 mm Narrow Keya FC/PC Fiber Connector |
| 6 | Enable Switch (Push to Activate) |
Click to Enlarge
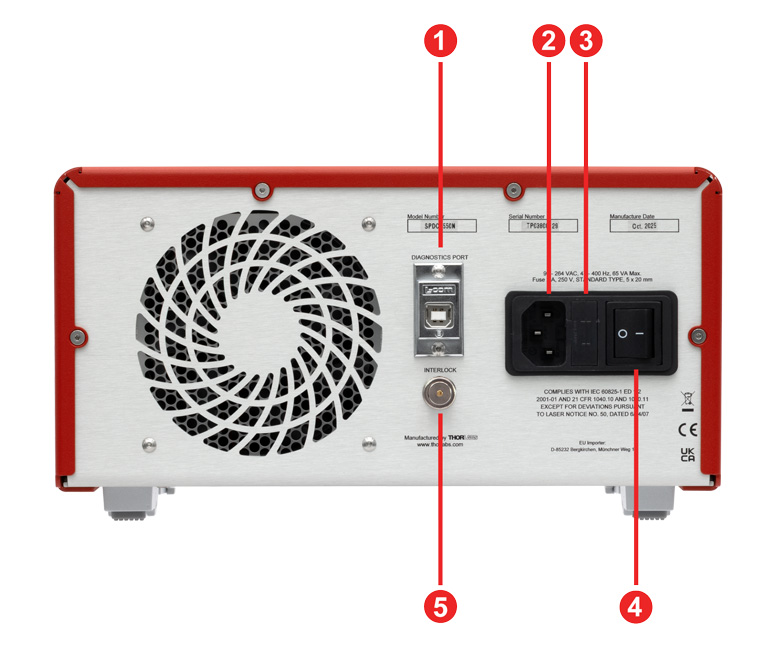
Figure 4.2 SPDC810N and SPDC1550N Narrowband Correlated Photon-Pair Source Back Panel
| SPDC810N and SPDC1550N Narrowband Correlated Photon-Pair Source Back Panel | |
|---|---|
| Callout | Description |
| 1 | USB 2.0 Type-B Port |
| 2 | AC Power Cord Connector |
| 3 | Fuse Tray |
| 4 | AC Power On/Off Switch |
| 5 | Remote Interlock Input (BNC) |
SPDC810 Front Panel

Click to Enlarge
Figure 4.3 SPDC810 Correlated Photon-Pair Source Front Panel
| SPDC810 Correlated Photon-Pair Source Front Panel | |
|---|---|
| Callout | Description |
| 1 | Signal Channel Output, 2.0 mm Narrow Keya FC/PC Fiber Connector |
| 2 | Idler Channel Output, 2.0 mm Narrow Keya FC/PC Fiber Connector |
| 3 | Serial RS232 Connector for Pump Laser |
| 4 | M8 Power Connector, 12 VDC Supply |
SPDC810 Electrical Connections
RS232 Female Connector (On Housing)
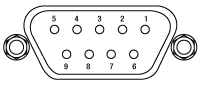
Figure 4.4 The RS232 connector provides connection to the pump laser.
| Pin | Description | Pin | |
|---|---|---|---|
| 1 | Data Carrier Detect (DCD) | 6 | Data Set Ready (DSR) |
| 2 | Receive Data (RXD) | 7 | Request to Send (RTS) |
| 3 | Transmit Data (TXD) | 8 | Clear to Send (CTS) |
| 4 | Data Terminal Ready (DTR) | 9 | Ring Indicator (RI) |
| 5 | Signal Ground (GND) | - | - |
M8 Male Connector (On Housing)

| Pin | Description |
|---|---|
| 1 | Not Connected |
| 2 | Not Connected |
| 3 | +12 V |
| 4 | Ground |
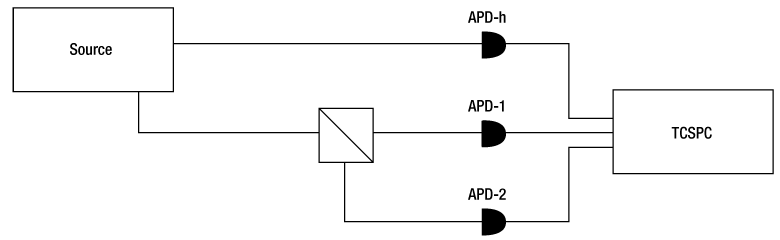
Click to Enlarge
Figure 5.1 Experimental setup for testing single-photon generation. APD-h is the avalanche photodiodes for the heralded photons, while APD-1 and APD-2 are the ones for the signal photons. TCSPC is the time-correlated single-photon counter.
Verification of Single-Photon Output
One of the most important characteristics of any single-photon source is the degree to which its output consists of only single photons. It is not enough to be able to detect a signal using single photon detectors, which can be easily achieved by attenuating a classical light source. Also, the output of a true single photon source may be contaminated with additional light due to leakage or multiphoton events. Therefore, while a coincidence peak can confirm the presence of single photons, it provides little information about the present noise. Please note that throughout this discussion, singles refers to a single detection event on one channel, ideally half of the photon pair.
Each of Thorlabs' Photon-Pair Sources is based on spontaneous parametric down-conversion (SPDC) and, thus, generates a pair of photons at any moment in time. An experimental setup to verify single-photon operation is shown in Figure 5.1. One of the outputs is connected directly to a single-photon detector, which in this case is a single-photon avalanche photodiode (APD). This channel is often referred to as a heralding or trigger channel, as it confirms the existence of a photon in the other arm. The signal channel is split on a 50:50 beamsplitter in a Hanbury-Brown-Twiss configuration and is connected to detectors 1 and 2. All 3 detectors are then connected to a coincidence counter, which is a time-correlated single-photon counter (TCSPC). If the output of the source truly consists only of photon pairs, there will only be two-fold coincidences between the heralding detector and detector 1 or 2, which are Ch,1 and Ch,2 respectively. This is demonstrated in Figure 5.2. Three-fold coincidences between all three detectors Ch,1,2 should not occur, as there are only two photons present.
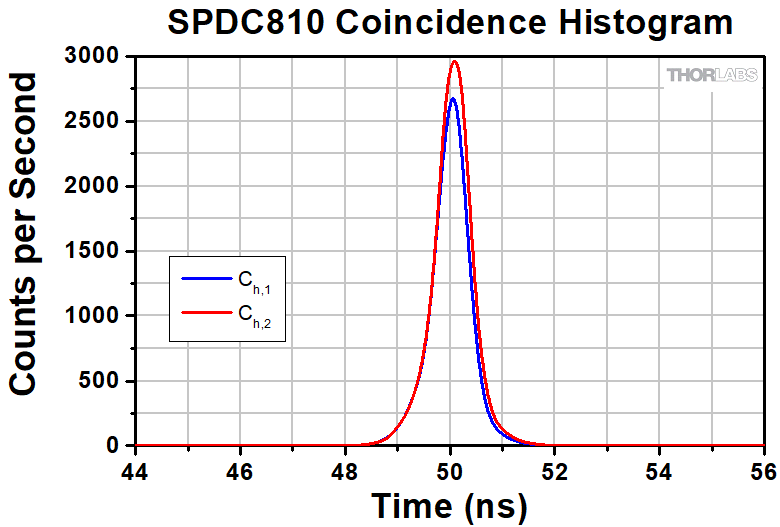
Click to Enlarge
Figure 5.2 Coincidence Histogram for Ch,1 and Ch,2, which are the coincidences between APD-h and APD-1 or -2, respectively. The peak at 50 ns confirms pair emission; a heralding photon reaches APD-h and 50 ns later (an added time delay) a signal photon reaches APD-1 or APD-2. Data acquired using Thorlabs' SPDC810 Photon-Pair Source.
Example data obtained using the SPDC810 Photon-Pair Source is presented in Table 5.3. As expected, the singles are split according to the beamsplitter reflectance. In this case, the additional loss was due to fiber-to-fiber coupling. The same is true for coincidences Ch,1 and Ch,2, which are similarly distributed between the two detectors. However, three-fold coincidences Ch,1,2 are very close to 0. The results confirm the true single-photon output of the source. In addition, the experiment also confirms the particle nature of light, i.e., a photon cannot be split.
| Table 5.3 Specifications | |||
|---|---|---|---|
| Average Coincidences per Second | Singles per Second | ||
| Ch,1 | 15229 | Sh | 130796 |
| Ch,2 | 17435 | S1 | 45376 |
| Ch,1,2 | 8 | S2 | 55128 |
The measurement described above is often referred to as a heralded second-order intensity correlation gh(2)(τ), where τ is the time difference between the arrival times t1 and t2. At τ = 0, which is our point of interest, it can be quantified using the following formula:
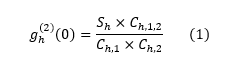
For an ideal photon pair source, the conditional probability of detecting photons at both detectors 1 and 2 at the same time (τ=0), given that a photon is detected at the heralding detector, is 0. Based on the data shown in Table 5.3 and using Equation 1, we obtain gh(2)(0) = 0.004, which is very close to ideal performance. In addition, the second order intensity correlation has a more fundamental importance. It is used to prove the non-classical nature of light, as the value of g(2)(0) depends on the type of light being investigated:
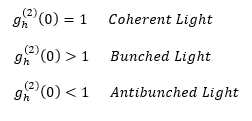
Depending on the experimental configuration, photon pair sources can exhibit both bunched and antibunched light statistics. Thermal light is a typical example of bunched light, where the probability of photons being detected across the outputs of a beamsplitter increases for τ ≈ 0, peaking at τ = 0. In contrast, an ideal single photon source exhibits antibunching, as discussed earlier. However, if a g(2)(τ) measurement is performed only on one of the channels, with the other one ignored, then such a source will produce thermal statistics.
The narrowband SPDC810N and SPDC1550N sources can be characterized using Hong-Ou-Mandel (HOM) interference. When a pair of photons are incident on a 50/50 beamsplitter, as shown in Figure 6.1, there are the four possible outcomes. The probability of each outcome can be calculated given the parameters of the input photons, which can depend on a variety of factors such as polarization, spectral properties, time of arrival at the beamsplitter, etc. For the special case in which the incident photons are indistinguishable in all degrees of freedom, cases b and c (Figure 6.1) will have equal amplitudes but opposite phases and destructively interfere. This results in the probability of detecting one photon on each channel of the beamsplitter, known as coincidence, being zero, with both photons being detected on the same side of the beamsplitter.
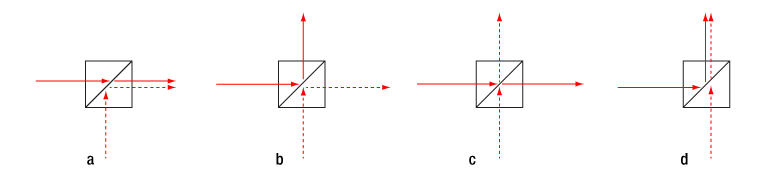
Figure 6.1 The four possible outcomes of a pair of photons incident on a 50/50 beamsplitter.
The following HOM interference experiment can be used to determine how indistinguishable a pair of photons are from an SPDC source. A diagram of one implementation of this experiment is shown in Figure 6.2. The signal and idler outputs of the SPDC810N source are collimated using TC18FC-780 triplet fiber collimators. A WPH05M-808 half wave plate is used in one leg of the interferometer to fine tune the polarization matching of the two channels. In the other leg of the interferometer, one of the fiber collimators is mounted on a motorized translation stage to control the path length difference (time delay) between the signal and idler output channels. These two channels are then coupled back into fiber and sent into a 50/50 nonpolarizing beamsplitter. SPDMH2F single photon detectors are used to detect the photons and a time tagger from our EDU-QOP1(/M) quantum optics educational kit is used to determine the coincidence rate of the detected single photon events.
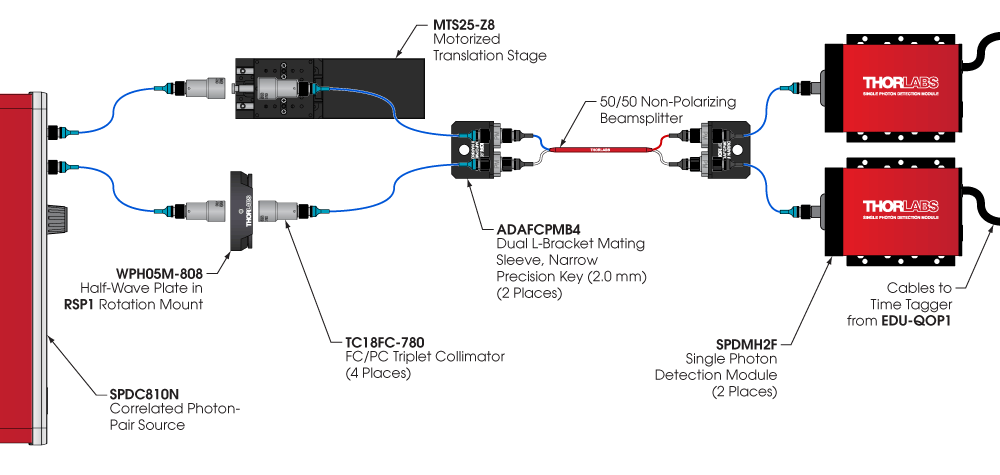
Figure 6.2 Experimental Set Up for HOM Interference Experiment
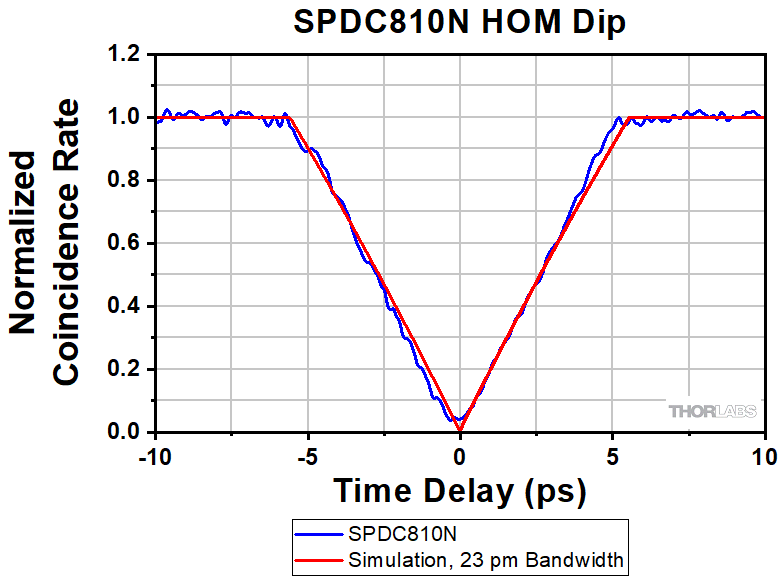
The photon pairs generated by the SPDC source are nominally indistinguishable in polarization after adjustment with the half-wave plate. When the SPDC sources are set to the crystal degeneracy temperature, the center wavelength and photon bandwidth of the signal and idler will also be identical. The signal and idler photons are generated simultaneously in the SPDC process, therefore when the time delay between the two outputs is set to compensate for any differential path length in the setup (effectively setting the total time delay to zero), the photons will arrive simultaneously and be indistinguishable. The inability to distinguish between the photons causes the coincidence rate to decrease to a minimum. As the motorized stage is scanned away from the zero-delay position, the photon pairs will no longer arrive at the beam splitter simultaneously, and the coincidence signal will increase to a maximum. Figure 6.3 shows the results of this stage scan across the zero-delay position. The coincidence rate has been corrected for dark counts, normalized to a maximum coincidence rate of 1, and fit to a simulation of the expected data with the photon bandwidth as the single free parameter. The simulation follows the process described in the linked reference. [1]
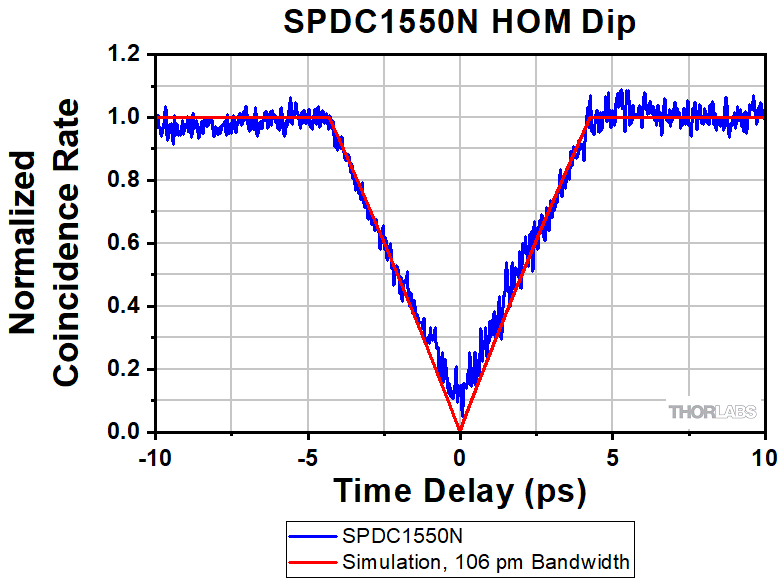
The HOM interference experiment is used to evaluate the SPDC810N and SPDC1550N devices, showing excellent visibility in both cases. The lower detection efficiency of the single photon detectors at the longer 1560 nm wavelength contributes to the higher noise in the data. For both, the photon bandwidth can also be determined from the simulation fits as shown in the graphs in Figures 6.3 and 6.4.
Reference
[1] C. Drago and A. M. Branczyk. "Hong-Ou-Mandel interference: a spectral-temporal analysis," Canadian Journal of Physics, 102(8), 411-421 (2024).
Click to Enlarge
Figure 6.3 SPDC810N HOM Dip for 23 pm Photon Bandwidth
Click to Enlarge
Figure 6.4 SPDC1550N HOM Dip for 106 pm Photon Bandwidth
Spontaneous Parametric Down Conversion and Phase Matching
Spontaneous Parametric Down Conversion (SPDC) is a common process for generating correlated photon pairs. In SPDC, a single pump photon generates two photons inside a nonlinear crystal, conserving both energy and momentum. These photons are created virtually simultaneously, so that one of the photons can be used to signal the existence of the other, making it possible to perform measurements on single photons. For this reason, the signal and idler photons are referred to as a herald (or heralding) and heralded photon. Additionally, degenerate type-II SPDC can be used to create polarization entangled photon pairs.
Optimizing for SPDC in our PPKTP crystals requires choosing a crystal appropriate to the wavelength of the pump laser and the appropriate temperature for the desired down conversion process. Tuning curves for each crystal offered are provided by the graphs in the Specs tab. Additional information and background, which can be helpful for interpreting the graphed data as well as more effectively using nonlinear crystals to generate down converted photons, is included in the expandable sections below. Information specific to our PPKTP crystals can be found in the section below titled How is the SPDC process tuned in periodically poled nonlinear crystals?
Click on a question to expand the corresponding passage that provides an answer, and then click again to contract the section.
What is nonlinear optics?
Click to Enlarge
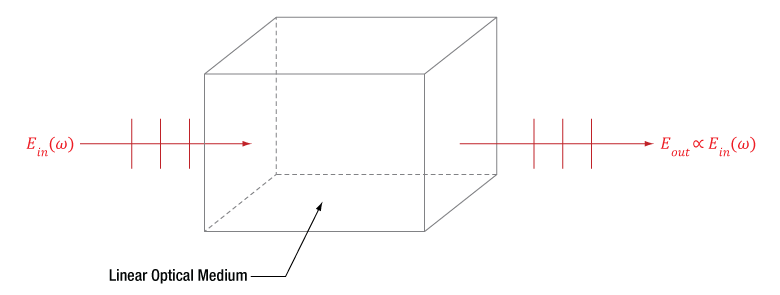
Figure 7.1 A beam of light accumulates phase and is attenuated as it propagates through a linear medium, but the photons of the beam do not interact with each other. Due to this, the input (Ein) and output (Eout) electric fields have the same frequency (ω) and are directly proportional.
Click to Enlarge
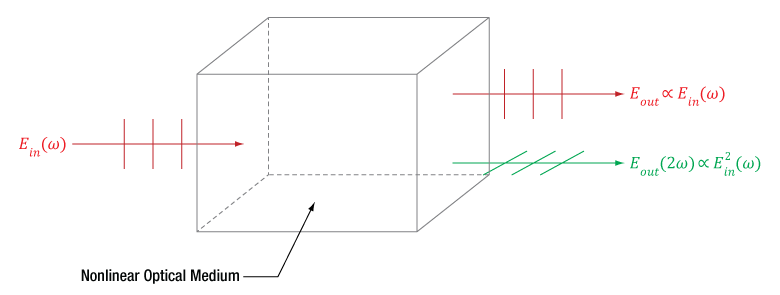
Figure 7.2 This nonlinear optical medium supports second harmonic generation and the input light is the same as in Figure 7.1. In addition to providing fundamental-frequency electric fields, as in Figure 7.1, the light output from this nonlinear medium also includes frequency doubled light, whose electric field Eout(2ω) is proportional to the square of the total input electric field.
The field of nonlinear optics refers to different optical phenomena that can occur when light alters the properties of the surrounding material. These phenomena are called nonlinear optics because the strength of the material's response is proportional to the square, cube, or other higher power of the light's total electric field. Since the light usually must be intense to produce a measurable nonlinear response, laser light is often used to generate desired nonlinear effects.
A material's nonlinear response occurs in addition to the linear response, which is proportional to only the first power of the light's electric field. The interaction between the light and the material is completely conventional (linear) when optical and material conditions are not appropriate for generating nonlinear phenomena. Then, light waves in a material propagate together without affecting one another, whether or not they are part of the same beam or pulse.
An example of a material's linear response to light is illustrated in Figure 7.1, in which an input beam is described by its electric field amplitude (Ein), frequency (ω), and polarization orientation (vertical). The beam accumulates phase and experiences conventional losses from effects like reflection and material absorption before it is output, but otherwise the beam is unaffected. The total electric field (Eout) output by the material has an amplitude that is directly proportional to the that of the input beam. In addition, the input and output light has the same frequency and polarization direction.
Nonlinear processes occur when the presence of the light in the material creates conditions in which different light waves can interact with one another. In some cases, light waves from the same beam or pulse interact, and in other cases light waves with significantly different frequencies and / or polarizations interact. Nonlinear phenomena include the generation of new frequencies of light, lensing of laser light propagating in uniform materials, and modulation effects. In the case of frequency generation, the light output by the nonlinear material will include a frequency of light different than any of the input beams' frequencies.
An example of nonlinear frequency generation is illustrated in Figure 7.2, in which the light is incident on a nonlinear optical material. While the incident light is the same as in Figure 7.1, the material supports second harmonic generation, and the electric field output from this crystal includes a new color, which has double the frequency of the input beams. The amplitude of this frequency-doubled light is proportional to the square of the total input electric field, and the losses accumulated by the two fundamental-frequency beams include the photons converted into frequency-doubled light.
What is spontaneous parametric down conversion (SPDC)?

Click to Enlarge
Figure 7.3 Conservation of momentum in non-collinear spontaneous parametric down conversion requires an angular deviation of the signal (ks) and idler (ki) photons to compensate for the larger magnitude of the sum of their momenta.
Click to Enlarge
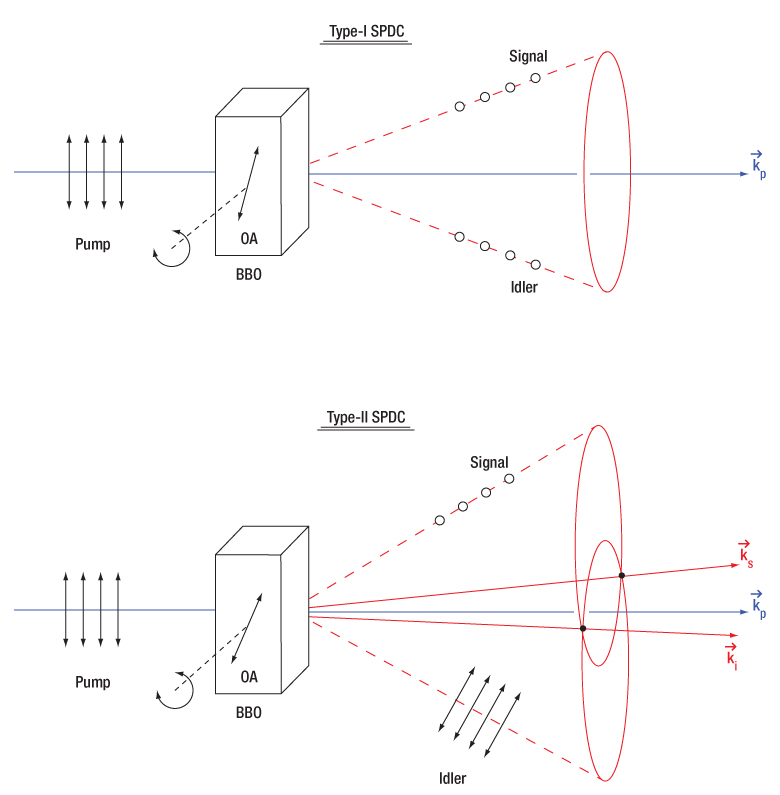
Figure 7.4 The signal and idler photons emitted during spontaneous parametric down conversion form either a cone (type-I SPDC) or a pair of cones (type-II SPDC). The two intersection lines between the signal and idler emission cones in type-II SPDC (labeled ks and ki, respectively) are the wavevectors that correspond to polarization entangled photons. The optical axis (OA) of the crystal can be changed by rotating the crystal, altering the phase matching conditions. This diagram shows noncollinear SPDC emission, but collinear emission with a gaussian profile is also possible.
Spontaneous Parametric Down Conversion
Spontaneous parametric down conversion (SPDC) is the reverse process to sum frequency generation (SFG). One common example of degenerate SFG, called second harmonic generation (SHG), is used to generate 532 nm wavelength photons from a 1064 nm pump laser. Unlike SFG, however, SPDC cannot be explained by classical fields. The SPDC process is called spontaneous (as opposed to stimulated) because the photon pair is created without the presence of an external electromagnetic field at the signal wavelength. Classical theories only allow for the generation of an idler and signal beam if a weak signal beam already exists, a process called parametric amplification. Therefore, the existence of the SPDC process can only be explained with quantum mechanics.
Conservation of Energy and Momentum in SPDC
Since energy and momentum are conserved in the SPDC process, the energy and momentum of the photon being down converted must be equal to the energy and momentum of the pair of output photons. The implication of this conservation is that experimental parameters must be set up to allow for conservation of energy and momentum during SPDC or else the process cannot proceed. The following example demonstrates how this conservation determines experimental parameters such as the photon output angles, polarization states of the output photons, and the nonlinear crystal cut angle.
In general, the output idler and signal photons will have propagation directions that fall on the surface a cone (type-I SPDC) or a pair of cones (type-II SPDC), as shown in Figure 7.4. These conical emission patterns can be observed as annuluses when viewed on a plane. Conservation of momentum requires that the sum of the wave vectors for these resulting output photons be equal to that of the input pump photon.
To simplify the calculations, let's look at the collinear case of SPDC, where the pump, signal, and idler photons are all propagating in the same direction. In this case, both the energy and momentum conservation relations simplify to scalar equations:
and
Here, ω represents the angular frequency of the photon and k the magnitude of the wave vector. The indices p, s, and i stand for pump, signal, and idler, respectively. The frequencies and wavevectors of each of these three photons are not independent but linked via the expression
where n(ωp) is the frequency-dependent index of refraction of the crystal at the pump frequency ωp, and c is the speed of light in vacuum. The signal and idler photons have analogous relations which together allow for the conservation of momentum expression to be rewritten as:
Degenerate SPDC
For the further simplifying case of degenerate SPDC, we can assume the wavelength (and thus frequency ω) of the signal and idler photons are the same and thus the previous expression simplifies to:
where (ωs,i) is the frequency of the degenerate signal and idler photons. Since ωp = 2 (ωs,i) for energy conservation, this demonstrates that we need the same index of refraction for both the short-wavelength pump and long-wavelength signal/idler photons, i.e. n(ωp) = n(ωs,i). This can be accomplished through the use of birefringent crystals, which have different indices of refraction for different polarizations of light. The crystal orientation can be rotated with respect to the input polarization of the pump beam to create the appropriate phase matching conditions to conserve energy and momentum and allow for spontaneous parametric down conversion.
Categories of SPDC
Stepping back from the simple case above, SPDC can be broken down into three categories all dealing with how the process is phase matched: collinear vs non-collinear wavevector orientations, type-0 versus t
Additional discussion on the SPDC categories and tuning between them is found below in the How is the SPDC process tuned in homogeneous nonlinear crystals? section.
Can all crystals be used for SPDC?
Only optical materials which have a non-zero χ(2) parameter support SPDC, and not all crystals fulfill this requirement. An example of a crystal that can be used for SPDC is β-BBO. A material is crystalline when its atoms, ions, or molecules are arranged in a repeating pattern. If there is no central point around which the crystal pattern is symmetric (i.e. if the crystal is not centrosymmetric), the crystal has a non-zero χ(2) parameter and can be used for SPDC.
Click to Enlarge
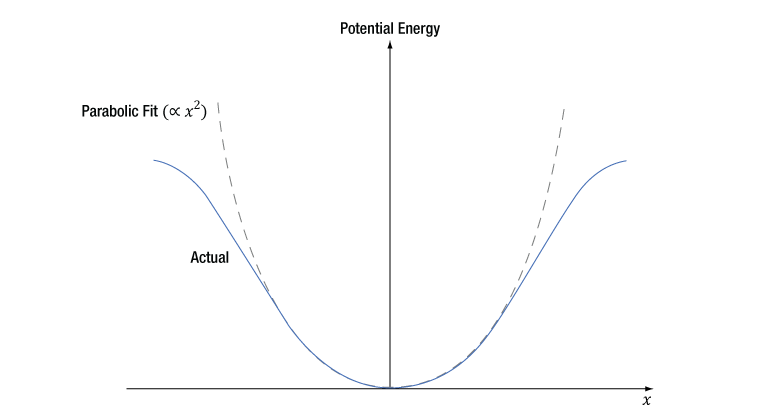
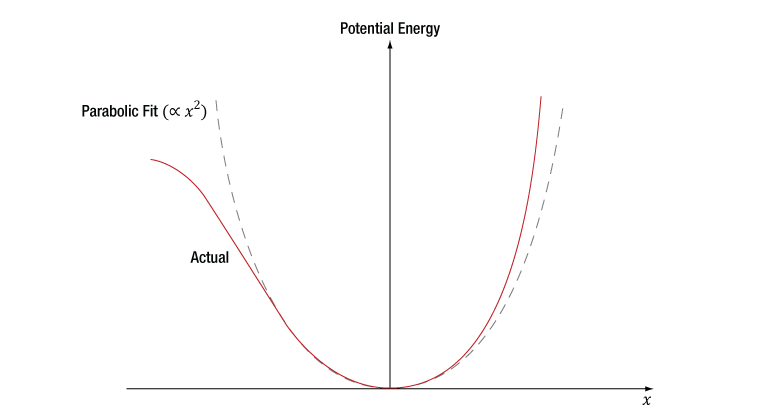
Figure 7.6 When light's oscillating electric field interacts with a centrosymmetric material, an electron's induced potential energy, which is illustrated as a function of the electron's displacement (x) from its equilibrium position, is symmetric and described by a polynomial function consisting of even powers of x.
Click to Enlarge
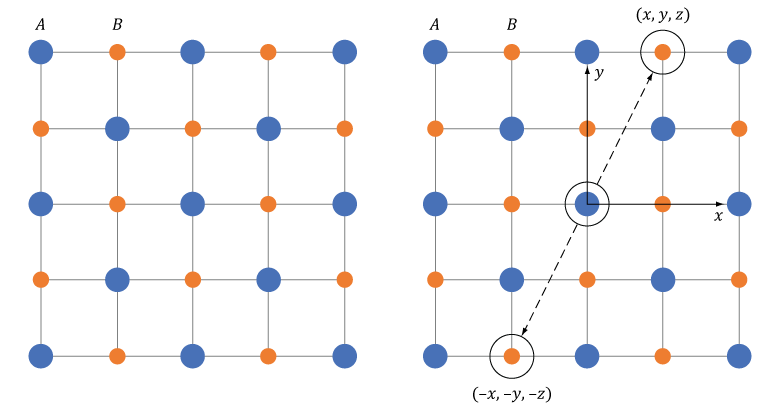
Figure 7.5 This cubic crystal structure includes two different ions, A and B, in a repeating pattern. The crystal structure is centrosymmetric since the crystal at point (x, y, z) and its inverse (-x, -y, -z) are identical.
Click to Enlarge
Figure 7.8 When light's oscillating electric field interacts with a non-centrosymmetric material, an electron's induced potential energy, which is illustrated as a function of the electron's displacement (x) from its equilibrium position, is asymmetric for larger displacements. This curve is described by a polynomial function consisting of even and odd powers of x.
Click to Enlarge
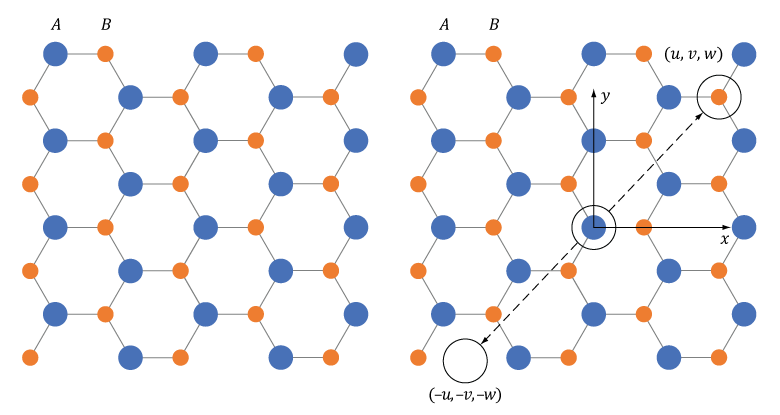
Figure 7.7 This wurtzite crystal structure includes two different ions, A and B, in a repeating pattern. The crystal structure is not centrosymmetric since there is at least one point (u, v, w) which is not identical to its inverse (-u, -v, -w).
Centrosymmetric Crystal
The repeating crystalline pattern of one type of centrosymmetric crystal is illustrated in Figure 7.5. As is true for all centrosymmetric crystals, the structure at point (x, y, z) is identical to the structure at the inverse location (-x, -y, -z). Due to the crystal's structural symmetry, the material's response is the same whether the incident light's electric field vector points in one direction or in the opposite direction.
The material’s response to light occurs due to interactions between the light’s oscillating electric field and the electrons in the material. An electron bound to an atom in the material experiences forces contributed by the atom and the light’s electric field, as well as the surrounding atoms in the material. The blue curve in Figure 7.6 was calculated using the Lorentz model of an atom, which takes these forces into account using a classical mechanics approach. This model can also be used to estimate the χ(2) parameter.
In Figure 7.6, the X-axis corresponds to the position of the electron, which is in equilibrium at x = 0. The input light’s oscillating electric field moves the electron back-and-forth between positive and negative displacements. The greater the intensity of the electric field, the larger the displacement of the electron. The central and surrounding atoms exert a restoring force on the displaced electron, returning it to equilibrium. This restoring force provides the electron with potential energy, which is plotted on the Y-axis and increases as the electron moves further from equilibrium.
At moderate displacements, the central atom exerts the majority of the restoring force, and the electron’s corresponding potential energy is symmetric and approximately parabolic (the dashed gray curve is a parabolic fit). At larger displacements, achieved using higher-intensity light, surrounding atoms contribute more to the restoring force, as well as the electron’s potential energy. At these larger displacements, the electron’s potential energy deviates from parabolic but remains symmetric.
The symmetric material response is a consequence of the centrosymmetric structure of the crystal. In order to support SPDC, this curve would have to be asymmetric. Mathematically, a non-zero χ(2) parameter requires the polynomial describing the curve to include odd powers of x, while the polynomial describing the curve in Figure 7.6 includes only even powers of x.
Non-Centrosymmetric Crystal
An example of a non-centrosymmetric material is shown in Figure 7.7. In the case of these materials, there is aways at least one location (u, v, w) for which the crystal structure differs from the crystal structure at the inverse location (-u, -v, -w).
The potential energy of an electron, as a function of its displacement from its equilibrium position, has been calculated for a non-centrosymmetric material using the Lorentz model of the atom (Figure 7.8). When the incident light has low intensity, the displacement of the electron from its equilibrium position is small, and the majority of the restoring force is provided by the central atom. Within this limited region, the electron's corresponding potential energy function is symmetric and approximately parabolic, which indicates a linear optical material response. When illuminated by higher-intensity light, the electron's displacement is greater and the surrounding atoms contribute more to the restoring force. Since the distribution of the surrounding atoms is not symmetric, neither is the restoring force nor the potential energy well confining the electron for these higher displacements.
The polynomial needed to model this asymmetric curve includes even, as well as odd, powers of x. It is the non-zero cubic (x3) terms in this polynomial that provide a non-zero χ(2) parameter. A third-order polynomial term is required for the generation of the second-order nonlinearities quantified by the χ(2) parameter, since the x3 term is the lowest-order correction to the linear optics model. Because the asymmetric response only becomes significant for larger electron displacements, high-intensity light is required to induce SPDC.
Uniaxial Crystal
A secondary requirement for efficient production of light through nonlinear processes, which will be discussed in a section below, is the so-called phase matching condition. At a high level, phase matching is the conservation of momentum between the input and output photons of the nonlinear process. This is frequently accomplished by utilizing the birefringence of anisotropic optical materials.
Uniaxial crystals are a specific type of anisotropic material, where two of the three principal refractive indices are the same. The name “uniaxial” is derived from there being a single propagation axis in these crystals, known as the optical axis or c-axis, on which the index of refraction is the same for all polarization orientations. Many common optical materials belong to the uniaxial class: calcite, quartz, sapphire, and β-BBO.
Reference:
Robert W. Boyd, Nonlinear Optics (Academic Press, New York, 1992) pp. 17 - 52.
Can a crystal's refractive index depend on the light's polarization orientation within the crystal?
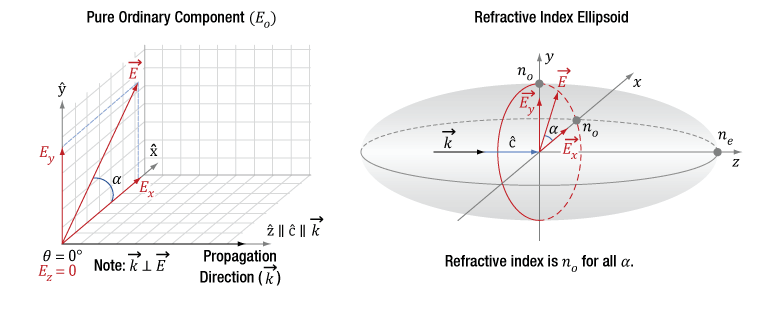
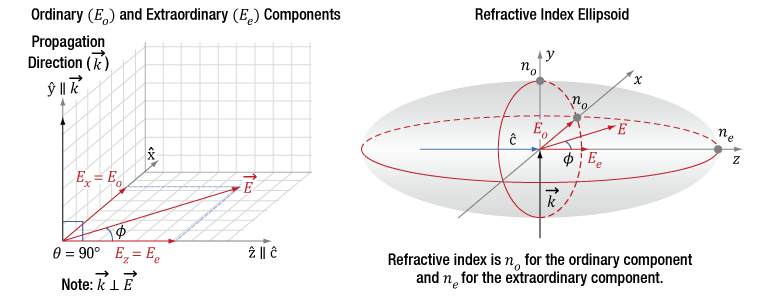
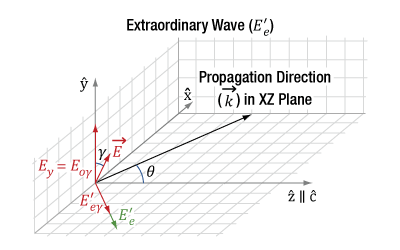
Certain materials have a refractive index that depends on the orientation of the light's electric field polarization. An example is birefringent materials, which include uniaxial crystals like β-BBO. Uniaxial crystals characteristically have two principal refractive indices, which are called the ordinary (no) and extraordinary (ne) refractive indices. The principal refractive indices are the maximum and minimum the material can provide. Since light’s electric field (E) is always polarized perpendicular to the propagation direction (k), both the propagation direction and polarization state must be known to determine the refractive indices experienced by the light's polarization components.
A Cartesian coordinate system, with the Z-axis aligned along the crystal’s optic axis (c), can be used to relate the light's polarization components (Ex, Ey, and Ez) to a birefringent crystal's geometry.
In uniaxial crystals, the refractive index can be determined by referencing the angles of the propagation direction and polarization orientation relative to the crystal's optic axis (c).
Since the crystal is uniaxial, the refractive index for fields polarized orthogonal to the crystal's optic axis is no. For fields parallel to the crystal's optic axis, the refractive index is ne. The two components (Ex and Ey) of light polarized orthogonal to the crystal's optic axis have refractive indices equal to no, since the crystal is uniaxial. Light polarized parallel (Ez) to the crystal’s optic axis has a refractive index equal to ne.
It is also possible for birefringent materials to provide a refractive index value between no and ne, which is discussed in a following section.
Click to Enlarge
Figure 7.9 The diagram on the left indicates the propagation direction (k) of the incident light is along the optic axis (c) of the crystal. The incident light can be decomposed into orthogonal polarization components Ex and Ey. The diagram on the right is a refractive index ellipsoid, with a conic section (red circle) at the XY-plane. This constant-radius circle shows the refractive index is always no in this case and the crystal does not affect the light's polarization.
Light Propagating Parallel to the Optic Axis
(Example: Optical Windows)
Light propagating along the optic axis (Z-axis) of a birefringent material always has a refractive index equal to no. This is a defining trait of the optic axis.
The left side of Figure 7.9 illustrates the electric field components of light propagating along the crystal's optic axis. These polarization state components can include Ex and Ey, but not Ez. In other words, the electric field vector is orthogonal to the Z-axis, so the angle φ equals 90°. The relative magnitude of Ex and Ey depends on angle α.
The right side of Figure 7.9 uses an ellipsoidal volume, the so-called index ellipsoid, to map all possible refractive indices provided by the material for all combinations of light propagation directions and polarization orientations. In the case of this material, the maximum possible refractive index is ne and the minimum is no. The opposite can be true for other materials. The red circle drawn on the ellipsoid is a conic section that marks the refractive indices that light propagating along the optic axis will experience. The refractive index of both Ex and Ey components equals no. Due to this, E has a refractive index of no, regardless of the orientation of the E vector in the XY-plane. Therefore, the Ex and Ey components travel with the same phase velocity, and the polarization state stays the same as the light propagates.
Optical windows made from uniaxial crystals, such as sapphire (for example Item # WG31050), are typically cut or polished so that normally incident light propagates parallel to the optic axis. This is done so that the window has no effect on the polarization state of the transmitted light, as described above. When the end faces are orthogonal to the optic axis like this, the crystal is often described as Z-cut or C-cut.
Click to Enlarge
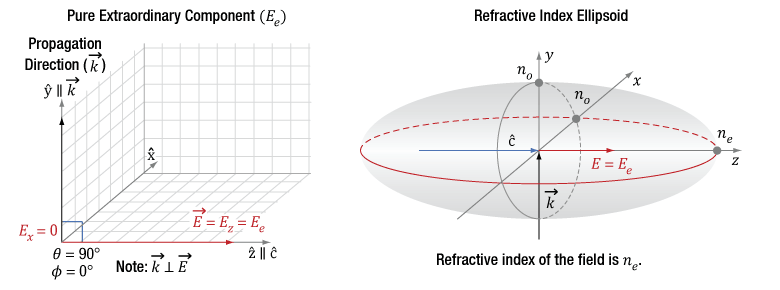
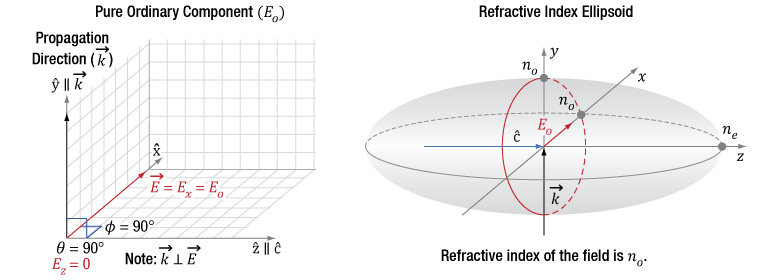
Figure 7.10 The diagram on the left indicates the incident light's propagation direction (k) and polarization state orientation (E), which can be decomposed into orthogonal components Ex and Ez. The propagation direction is aligned to the Y-axis and is orthogonal (θ = 90°) to the optic axis (c) of the crystal. The diagram on the right is a refractive index ellipsoid, with conic sections (red ellipses) drawn in the XZ- and XY-planes. The refractive index (ne) of the extraordinary component (Ee = Ez) is indicated by the intersection of the Z-axis and ellipse, while the refractive index (no) of the ordinary component (Eo = Ex) is indicated by the intersection of the X-axis and the ellipse. The angle φ determines the two components' relative magnitudes.
Click to Enlarge
Figure 7.11 The diagram on the left indicates the incident light's propagation direction (k), which is aligned to the Y-axis, which is orthogonal (θ = 90°) to the optic axis (c) of the crystal. Since φ is 0°, the only polarization component is Ez, which is also the extraordinary component. The diagram on the right indicates this component has a refractive index of ne.
Click to Enlarge
Figure 7.12 The diagram on the left indicates the incident light's propagation direction (k), which is aligned to the Y-axis, which is orthogonal (θ = 90°) to the optic axis (c) of the crystal. Since φ is 90°, the only polarization component is Ex, which is also the ordinary component. The figure on the right indicates this component has a refractive index of no.
Light Propagating Perpendicular to the Optic Axis
(Example: Wave Plate)
When linearly polarized light incident on a birefringent material propagates in a direction orthogonal to the optic axis (θ = 90°), the light may have components polarized both parallel and perpendicular to the optic axis (Z-axis). This is illustrated in Figure 7.10, in which the light’s propagation direction is aligned to the Y-axis for convenience. The refractive index of the electric field component parallel to the optic axis (Ez) is ne, and the component perpendicular to the optic axis (Ex) is no. This is the largest refractive index difference that can exist between two polarization components in the material.
The vertical, red circle on the right side of Figure 7.10 is the conic section of the index ellipsoid in a plane perpendicular to the k-vector. The horizontal, red elliptical conic section indicates a difference between the refractive indices of the orthogonal principal polarization axes of ![]() and
and ![]() .
.
Due to different refractive indices, the two polarization components travel at different velocities as they propagate through the material. This causes a phase shift between the two polarization states Ez and Ex.
Wave plates are often fabricated from uniaxial birefringent materials, with the optic polished and mounted so that normally incident light propagates orthogonal to the optic axis. Markings on the wave plate housing, such as the ones on Item # WPQ05M-266, or flat features on the perimeter of the optic, identify the orientations of the ordinary and extraordinary axes, or for a typical waveplate made of crystal quartz the so-called fast and slow axes, respectively.
Light polarized parallel to the fast axis travels with a faster velocity in the material due to the lower refractive index, compared with light polarized parallel to the slow axis. Quartz, a commonly used waveplate material, is a positively uniaxial crystal with a smaller ordinary refractive index compared to its extraordinary index. For quartz, the fast axis is the ordinary axis.
Tuning a wave plate requires rotating the optic in the XZ-plane, around the Y-axis, so that the light's propagation direction is maintained perpendicular to the optic axis. This rotation changes the angle φ, while keeping θ = 90°.
When the angle φ is between 0° and 90°, the linear polarization state has both orthogonal Ex and Ez components, and the wave plate will delay one component relative to the other. However, note that since θ is unchanged, there is no change in the indices of refraction of the two principal orthogonal polarization orientations along ![]() and
and ![]() .
.
When φ = 0°, as illustrated in Figure 7.11, the light's polarization state is oriented along the optic axis. This provides an extraordinary component (Ez = Ee) without an ordinary component. This component has a refractive index equal to ne. Since there is only one polarization component, the wave plate does not affect the polarization state.
The polarization state is similarly unaffected when the linear polarization state is aligned with the X-axis (φ = 90°), as seen in Figure 7.12. In this case, there is an ordinary component (Ex = Eo) without an extraordinary component and the refractive index is no.
Click to Enlarge
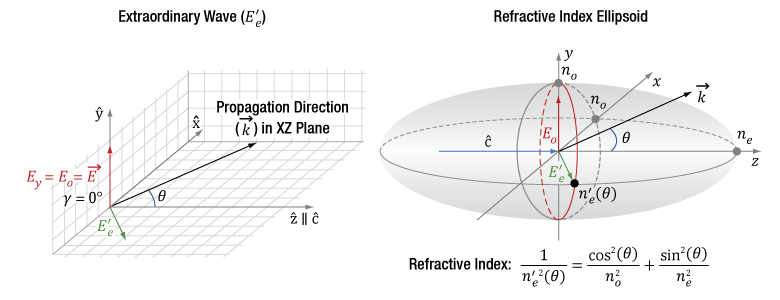
Figure 7.13 In the diagram on the left, the propagation direction (k) of the incident light and the optic axis (c) of the uniaxial birefringent crystal are in the same plane (XZ plane). The angle (θ) between k and c is arbitrary. The input fundamental field, represented by the red vector, is parallel to the Y-axis. The SHG light is polarized perpendicularly, represented by the green vector in the XZ plane. Rather than decompose the SHG polarization into components Ex and Ez, the light is typically described as an extraordinary wave (E'e) with a refractive index, n'e. In the diagram on the right, n'e, which depends on θ, is indicated by the intersection of the conic section illustrated by the red ellipse with the XZ plane.
Click to Enlarge
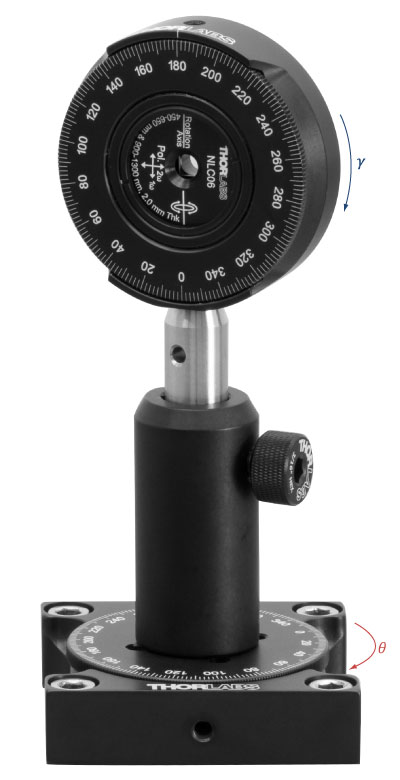
Figure 7.15 How θ and γ are defined in a laboratory setup.
Click to Enlarge
Figure 7.14 In the diagram above, the propagation direction (k) of the incident light and the optic axis (c) of the uniaxial birefringent crystal are in the same plane (XZ-plane). The angle (θ) between k and c is arbitrary. In this case, the incident fundamental field (E), represented by the red vector, is rotated off of the laboratory reference frame by an angle γ, and thus only a portion of the fundamental (Eoγ) is converted by SHG into the resulting polarization E'e, represented by the green vector.
Light Propagating at an Arbitrary Angle
(Example: Nonlinear Crystals)
This is a case study using type-I second harmonic generation (SHG) as an example of an application of birefringent crystals in nonlinear optics. SHG is the reverse case of degenerate SPDC, so this treatment will be instructive.
In uniaxial crystals, the field polarizations are arranged as in Figure 7.13 for type-I second harmonic generation (SHG). The k-vector is at an angle θ from the optic axis, ![]() , and in the XZ plane. The input fundamental electric field (Eo) is polarized parallel to one of the principal ordinary axes, in this case the Y-axis, and has a refractive index of no. The index of refraction for light polarized in the ordinary direction, parallel to
, and in the XZ plane. The input fundamental electric field (Eo) is polarized parallel to one of the principal ordinary axes, in this case the Y-axis, and has a refractive index of no. The index of refraction for light polarized in the ordinary direction, parallel to ![]() , is independent of changes to θ.
, is independent of changes to θ.
The SHG light is polarized in the XZ plane and is orthogonal to both the Eo and the k-vector. Rather than decompose the polarization of the SHG light into Ex and Ez components, the electric field is typically described as an extraordinary wave (E'e). The refractive index for this extraordinary wave, n'e, changes as a function of θ. n'e(θ) can be calculated using the equation in Figure 7.13. The ellipse defining the extraordinary index of refraction as a function of θ is a conic section of the index ellipsoid. The two extreme cases are 1) θ = 0°, where the field is polarized along the other principal ordinary axis, ![]() , and the index of refraction is no, or 2), θ = 90°, where the field is polarized along the principal extraordinary axis,
, and the index of refraction is no, or 2), θ = 90°, where the field is polarized along the principal extraordinary axis, ![]() , and the index of refraction is ne. The prime (') notation is used to denote index of refraction for cases in between the two extreme cases of θ.
, and the index of refraction is ne. The prime (') notation is used to denote index of refraction for cases in between the two extreme cases of θ.
Figure 7.14 shows a departure from an ideal polarization orientation for type-I SHG, where the incident fundamental field has a linear polarization but is rotated by a degree γ from the principal ordinary axis ![]() . The fundamental field now driving the type-I SHG process is the Eoγ component of the incident field. At γ = 90°, there would be zero SHG output, since the drive field Eoγ = 0.
. The fundamental field now driving the type-I SHG process is the Eoγ component of the incident field. At γ = 90°, there would be zero SHG output, since the drive field Eoγ = 0.
In practice, γ is nonzero when the polarization states of light in a laboratory reference frame are not matched to the intrinsic principal axes in the crystal frame. To orient the two reference frames together, e.g. the vertically polarized light from the laser on the optical table is parallel to ![]() in the crystal, we mount the nonlinear crystal in a rotation stage to finely adjust γ to zero, first by eye using the markings on the housing and then further, if necessary, using the SHG output power as feedback. Figure 7.15 shows the orientation of γ in a laboratory frame rotation of the crystal. In this example case, the nonlinear crystal is mounted in an RSP1 rotation mount on top of an RP01 rotation stage. Changes in γ and θ adjust the orientation of the optic axis,
in the crystal, we mount the nonlinear crystal in a rotation stage to finely adjust γ to zero, first by eye using the markings on the housing and then further, if necessary, using the SHG output power as feedback. Figure 7.15 shows the orientation of γ in a laboratory frame rotation of the crystal. In this example case, the nonlinear crystal is mounted in an RSP1 rotation mount on top of an RP01 rotation stage. Changes in γ and θ adjust the orientation of the optic axis, ![]() . In this case, adjustments in γ have been used to align
. In this case, adjustments in γ have been used to align ![]() with the horizontal plane and one of the principle ordinary axes vertically. For a vertically polarized input beam, this orientation allows the rotation stage to be used to adjust θ.
with the horizontal plane and one of the principle ordinary axes vertically. For a vertically polarized input beam, this orientation allows the rotation stage to be used to adjust θ.
How is the SPDC process tuned in homogeneous nonlinear crystals?
Click to Enlarge
Figure 7.15 The signal and idler photons emitted during noncollinear spontaneous parametric down conversion form either a cone (type-I SPDC) or a pair of cones (type-II SPDC). The two intersection lines between the signal and idler emission cones in type-II SPDC (labeled ks and ki, respectively) are the wavevectors that can correspond to polarization entangled photons. This type-II SPDC diagram shows noncollinear SPDC emission, but collinear emission with a gaussian profile is also possible.

Click to Enlarge
Figure 7.16 For SPDC, it is necessary for the pump and signal/idler photons to experience the same index of refraction despite their different wavelengths. Birefringent materials like β-BBO allow for this by having different indices of refraction for two crystal axes so that photons with different polarizations and different wavelengths can be phase matched.
Tuning Type-I, Degenerate, Non-Collinear SPDC
In the following example, degenerate non-collinear spontaneous parametric down conversion (SPDC) with a 405 nm pump is used to demonstrate how tuning is performed. Using the same logic, degenerate and non-degenerate SPDC tuning can be achieved for any pump wavelength. This example, where the degenerate signal and idler have the same polarization, perpendicular to that of the pump, is called type-I SPDC, as shown in the upper panel of Figure 7.15. In contrast, for type-II SPDC, the signal and idler have polarizations perpendicular to each other, with one being parallel to the pump polarization, as shown in the lower panel of Figure 7.15.
As discussed previously, for SPDC to occur, the index of refraction within the nonlinear crystal for the pump at 405 nm must be the same as the index of refraction for both the signal and idler at 810 nm. The refractive index as a function of wavelength for β-BBO is shown in Figure 7.16. The red solid curve indicates the refractive index for the ordinary beam (no). The black dashed curve is the refractive index for the extraordinary beam (ne) if the input beam is orthogonal to the crystal plane. By rotating the crystal axes relative to the wavevector of the incident pump, the refractive index curve can be moved until ne (405 nm, pump) = no (810 nm, signal/idler). This is called phase matching and allows for efficient SPDC from pump photons at 405 nm to signal and idler photon pairs at about 810 nm each. In this example, the optic axis of the crystal must be at an angle of 29.2° relative to the incident 405 nm pump beam to allow for optimal phase matching. Typically, a crystal cut to a similar angle (like our NLCQ1, NLCQ2, or NLCQ3 crystals for this example) would be used to allow for near-normal incidence and maximizing of the clear aperture.
Thorlabs' β-BBO crystals are designed to provide near-phase-matched conditions for normally incident input light for a specified set of wavelengths. The faces of the β-BBO crystals are cut such that the angle between the normally incident light and the optic axis is approximately the phase-matching angle for the specified frequencies. See the Specs tab for detailed specifications for the crystals currently available. The phase matching angle can be tuned by rotating the crystal to alter the angle between the optical axis (OA) and the incident pump as shown in Figure 7.15. An adjustment of typically only a few degrees can either optimize the performance of the crystal in the setup or match another wavelength within the crystal's operating range.
Tuning Between Type-I and Type-II SPDC
Depending on the exact phase matching parameters, the signal and idler photon pairs either leave the crystal either collinearly with the same mode as the pump beam, or non-collinearly on a cone with a small opening angle. The angle of the cone and wavelengths of the signal/idler pair can be tuned by adjusting the angle of incidence to the crystal.
For type-I SPDC (see the upper panel of Figure 7.15), in the specific example discussed above, the degenerate noncollinear signal and idler photons emit in a singular annular cone with a half angle of 2.88°. Rotating the crystal's optical axis to an angle of 28.64° changes the degenerate phase matching condition from non-collinear to collinear, collapsing the conical emission pattern to a Gaussian spatial mode collinear with the pump.
Due to the large difference in angle between type-I and type-II SPDC, it is often necessary to use crystals with different cut angles. For example, Thorlabs' NLCQ1 β-BBO crystal is cut at 29.2° to enable type-I phase matching with a 405 nm pump and degenerate 810 nm output at near-normal incidence. For type-II SPDC at the same wavelengths, Thorlabs' NLCQ4 BBO crystal cut at 41.8° would allow for phase matching at near normal incidence.
For type-II SPDC (see the lower panel of Figure 7.15), the signal and idler have distinct noncollinear emission cones each with a half angle of 5°. The signal and idler emission cones are separated from each other by a half angle of 1.7°. This results in the two cones intersecting at two lines. For larger increased negative angular offset (larger optic axis angle relative to the pump propagation), the individual cone half angles increase but the separation is relatively un-changed. Due to the increased cone half angle, the intersection lines of the two emission cones move outwards (transverse). As the AOI is tuned towards the collinear case, the two noncollinear annular emission cones separate and then collapse back to the collinear Gaussian modes.
It is important to note that for a pump wavelength of 405 nm, the wavelength of the signal and idler photons will not always be exactly 810 nm. It is also allowed that photon pairs can be of differing wavelengths, such as 812 nm and 808 nm. In those cases, the photon with the longer wavelength (lower energy) makes a slightly larger angle with the pump beam and vice versa. This wavelength deviation is limited by how well the phase matching is fulfilled at the different wavelengths, as the efficiency of the SPDC process will drop sharply with non-optimal phase matching.
The broad phase matching criteria for these crystals allows for photon pairs to be emitted under a vast range of wavelengths and angles. This means that photons generated by SPDC are distributed over a large spatial region. When measuring with two detectors in coincidence, one must be careful that detectors are positioned in the correct location so that they are able to detect photons from the same signal/idler pair.
The Effect of Crystal Thickness on SPDC
While phase matching can be achieved with a wide variety of wavelengths, crystals, and geometries, optimizing the system for the desired output introduces many more variables that should be considered. One such factor is the thickness of the crystal. Thicker crystals can provide a higher photon pair generation rate for a given pump power as there is a longer path for the light to interact with the crystal. However, increasing thickness also blurs the wavelength-position correlation of the SPDC photons, as pairs created at different spots in the crystal have different points of origin for the cone on which they are emitted. In type-II SPDC, the birefringent material of β-BBO causes differing group velocities in the ordinary and extraordinary axes due to different indices of refraction, causing temporal walk-off between the perpendicularly polarized signal and idler photons. This effect acts to label the signal and idler photons, reducing the quality of entanglement. As this temporal walk-off is a propagation effect, it scales linearly with increasing crystal thickness.
Thicker crystals also tighten the pump bandwidth for a given set of phase matching conditions as seen in Figure 7.17. More consequentially, the thicker crystals also result in tighter angular bandwidth for the emitted signal and idler photons, see Figure 7.18. This tighter angular distribution reduces the wavelength-position correlation and can make it more challenging to isolate specific photon pairs, since in an actual experiment an iris is typically used to spatially filter the output signal and idler beams, thus passing a more restricted range of wavelengths.
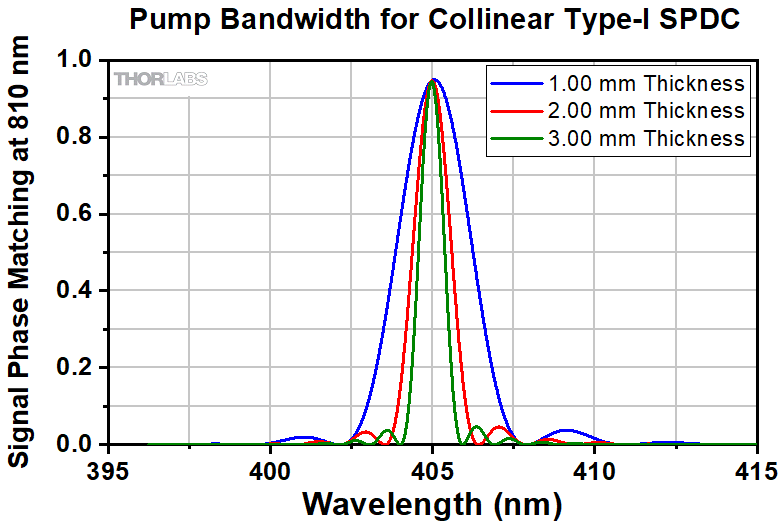
Click to Enlarge
Figure 7.17 As crystal thickness increases, the pump bandwidth that is phase-matched gets narrower. In this series of calculations, a fixed output wavelength was chosen and the resulting pump wavelengths that can achieve phase matching are plotted. This theoretical data was calculated with the web tool SPDCalc.
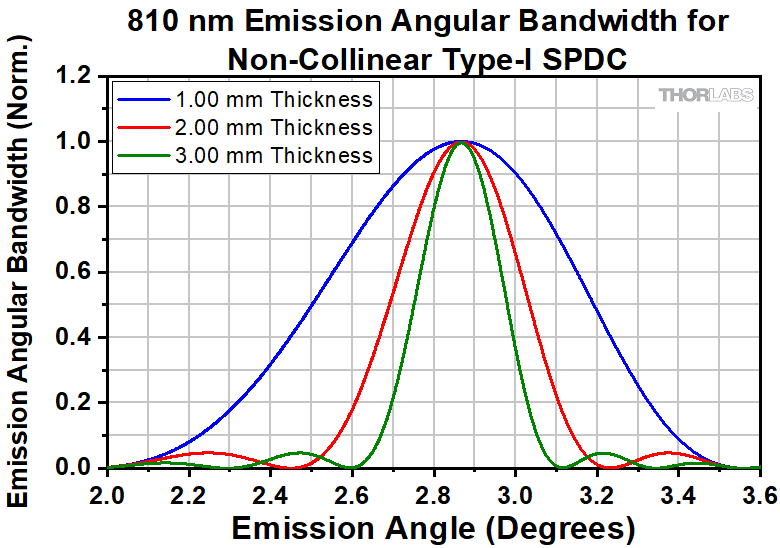
Click to Enlarge
Figure 7.18 The angular dispersion of the emitted signal and idler photons becomes tighter with increasing crystal thickness. This theoretical data was calculated with the web tool SPDCalc.
How is the SPDC process tuned in periodically poled nonlinear crystals?
Click to Enlarge
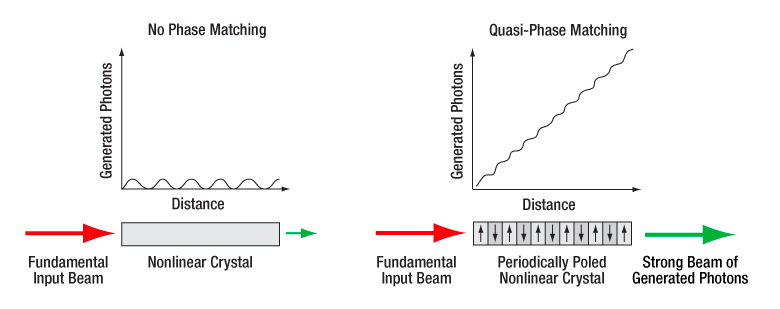
Figure 7.19 Quasi-phase matching is achieved in periodically poled materials by repeatedly inverting the crystal domain orientation at the length that maximizes constructive interference between the newly generated photons and the previously generated photons from earlier in the crystal. The optimal poling period depends on the crystal properties as well as the wavelengths of the pump, signal, and idler photons. In a non-phase matched crystal, the generated photons build up and then decay, while in a quasi-phase matched crystal, the generated photons build up to a local maximum, the domain is inverted and buildup occurs again to a next maximum, and the process repeats itself, leading to a continual buildup of generated photons.
Phase Matching and Quasi-Phase Matching
Different crystals used for SPDC are designed for different methods of phase matching. Traditional phase matching is performed for homogeneous birefringent crystals, which have different indices of refraction for different polarizations of light. The crystal orientation can be rotated with respect to the input polarization of the pump beam to create the appropriate phase matching conditions to conserve energy and momentum and allow for nonlinear processes like SHG, SFG, or SPDC to be optimally efficient. In quasi-phase matching, the crystal itself is engineered through periodic poling to correct for the differing phases within the material instead of by tuning the angle of incidence.
By designing a crystal such that a photon passing through will experience a periodic reversal of the crystal’s polarity, at a particular wavelength, this will allow the generation of SPDC photons to build constructively over the path length through the crystal, as illustrated in Figure 7.19.
Tuning Type-0 and Type-II, Degenerate, Collinear SPDC
This periodically poled crystal structure allows for type-0 SPDC, which was not achievable in homogenous crystals. Figure 7.20 illustrates the difference in signal and idler outputs between our periodically poled nonlinear crystals that are designed for type-0 or type-II SPDC. The case where the degenerate signal and idler have the same polarization, parallel to that of the pump, is called type-0 SPDC, as shown in the upper panel of Figure 7.20. In contrast, for type-II SPDC, the signal and idler have polarizations perpendicular to each other, with one being parallel to the pump polarization, as shown in the lower panel of Figure 7.20.

Click to Enlarge
Figure 7.20 The signal and idler photons emitted during collinear spontaneous parametric down conversion have polarization aligned either parallel to the pump photons (type-0) or with the signal perpendicular to the pump and the idler parallel to the pump (type-II).
Thorlabs' periodically poled potassium titanyl phosphate (PPKTP) crystals are designed for quasi-phase matching with the crystal temperature around 60 °C and either a pump wavelength around 405 nm (for Item #s NLCK1 and NLCK2) in order to efficiently produce degenerate SPDC photons at around 810 nm, or a pump wavelength around 775 nm (for Item #s NLCK3 and NLCK4) for SPDC at around 1550 nm.
Tuning Degeneracy in Quasi-Phase Matched SPDC Crystals
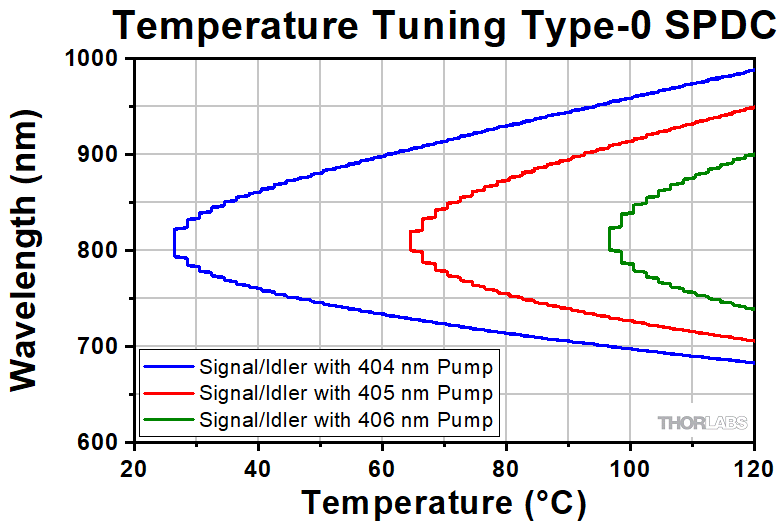
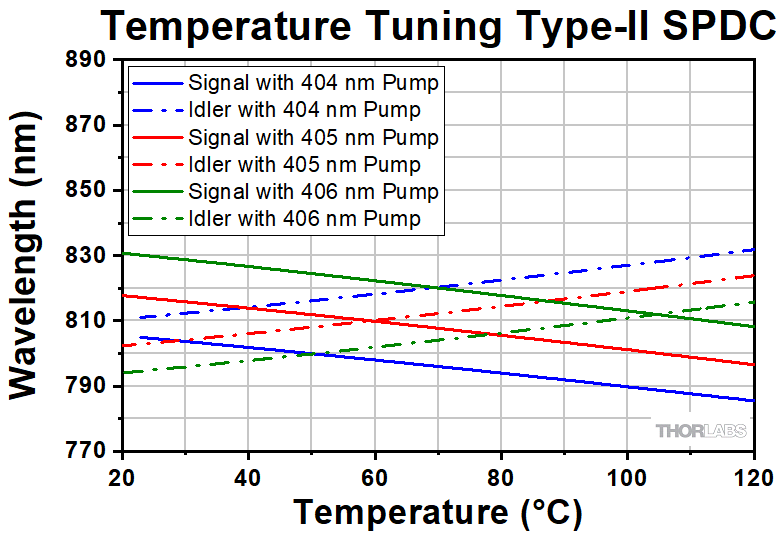
As an example, let's look at some data for the case of degenerate collinear SPDC with a 405 nm pump to demonstrate how tuning is performed. Using the same logic, degenerate and non-degenerate SPDC tuning can be achieved for any pump wavelength. It is important to note that for a pump wavelength of 405 nm, the wavelength of the signal and idler photons will not always be exactly 810 nm. It is also allowed that photon pairs can be of differing wavelengths, such as 812 nm and 808 nm, which is known as non-degenerate SPDC. The resulting wavelengths of the signal and idler photons in quasi-phase matched crystals are determined by the pump laser wavelength and the temperature of the crystal. Figure 7.21 shows the temperature dependence of the SPDC photon wavelengths for different pump wavelengths in type-0 crystals while Figure 7.22 shows this dependence for type-II crystals.
The Effect of Crystal Thickness on SPDC in Periodically Poled Crystals
As mentioned previously, longer crystals can provide a higher photon pair generation rate for a given pump power as there is a longer path for the light to interact with the crystal. However, increasing thickness also decreases the spectral phase-matching bandwidth, affecting the range over which quantum photon correlation effects can be observed. Periodically poled crystals are designed to limit group velocity walk-off between the pump, signal, and idler photons, leading to efficient SPDC.
Click to Enlarge
Figure 7.21 In our type-0 PPKTP nonlinear crystals, temperature can be adjusted to accommodate degeneracy with a different pump wavelength or to tune the SPDC away from degeneracy and produce two SPDC photons with different wavelengths.
Click to Enlarge
Figure 7.22 In our type-II PPKTP nonlinear crystals, temperature can be adjusted to accommodate degeneracy with a different pump wavelength or to tune the SPDC away from degeneracy and produce two SPDC photons with different wavelengths.
Fiber Cleaning Techniques
This tab details a technique for cleaning fiber bulkheads and connectors using the FBC250 Fiber Bulkhead and Connector Cleaner, included with the Correlated Photon-Pair Sources.
Fiber Cleaning Using the FBC250 Cleaner
Cleaning Fiber Bulkheads
Click to Enlarge
Figure 8.1 To clean a 2.5 mm fiber bulkhead with a FBC250 cleaner, remove the guide cap completely from the device, and insert the tip of the cleaner into the bulkhead. Rotate the cleaner handle from the LOCK position to the CLEAN position, and then carefully push the handle toward the bulkhead to advance the cleaning string that cleans the connector. A click indicates that the cleaning is complete. To clean a 2.5 mm SC, ST, FC, or ES200 fiber connector, expose just the top of the guide cap, insert the tip of the FBC250 cleaner into the connector and proceed with the same steps.
Replacing the Cartridge
Click to Enlarge
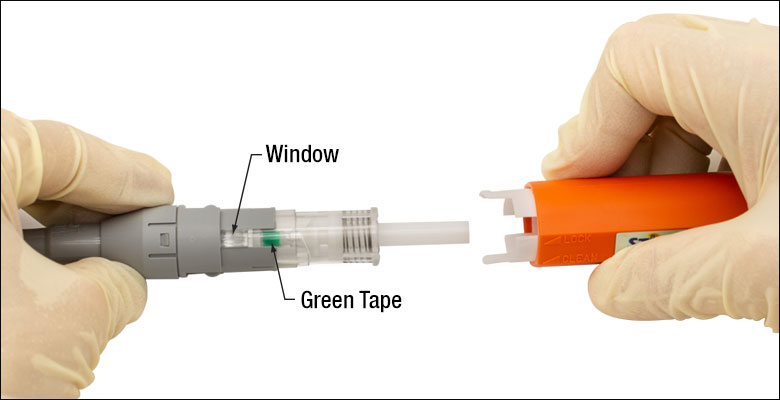
Figure 8.2 A new FBC250R cartridge is shown being installed. The cartridge will need to be replaced when the green tape appears in the indicator window. To remove the cartridge in the FBC250 cleaner, remove the guide cap completely and detach the old cartridge by firmly pulling it away from the handle. Perform this last step with care.
Click to Enlarge
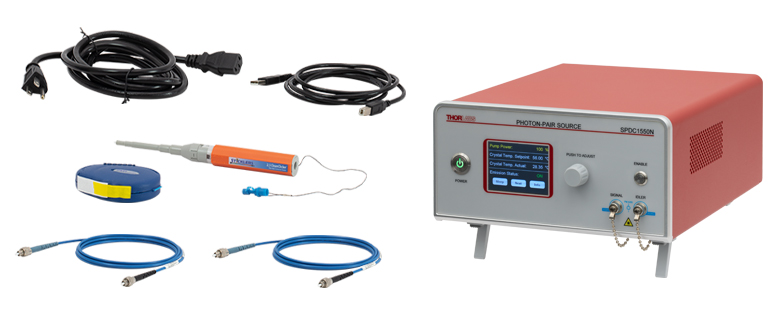
Figure 7.1 Shipping contents of The SPDC810N and SPDC1550N Sources
The SPDC810N and SPDC1550N Narrowband Correlated Photon-Pair Sources ship with the following components:
- Benchtop, Narrowband Photon-Pair Source
- Interlock-Shorting BNC Connector
- Region-Specific Power Cord
- USB Type A to Type B Cable, 2 m Long
- Two AR-Coated Patch Cables
- SPDC810N: Item # P1-780PMAR-2
- SPDC1550N: Item # P1-1550PMAR-2
- FBC250 Fiber Connector and Bulkhead Cleaner
- FCC-7020 Fiber Connector Cleaner
Click to Enlarge
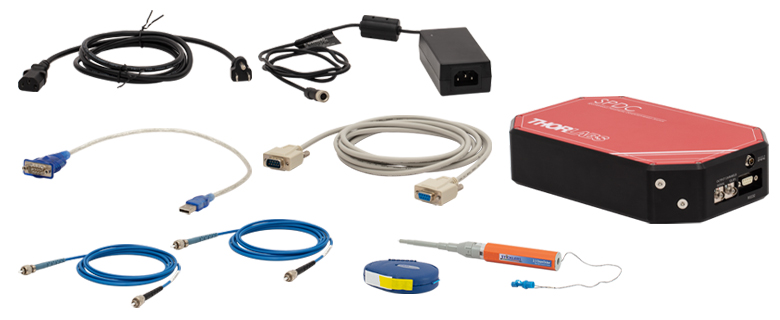
Figure 7.2 Shipping contents of the SPDC810 Source
The SPDC810 Correlated Photon-Pair Source ships with the following components:
- Compact Correlated Photon-Pair Source
- DS12 Power Supply
- RS232 Cable, 10' Long
- USB to Serial Converter,1.50' Long
- Two P1-780PMAR-2 AR Coated Patch Cables
- FBC250 Fiber Connector and Bulkhead Cleaner
- FCC-7020 Fiber Connector Cleaner
Selected Publications Using Thorlabs' Correlated Photon-Pair Sources
2024
Farella, B., Medwig, G., Abrahao, R. A., & Nomerotski, A. (2024). Spectral characterization of an SPDC source with a fast broadband spectrometer. AIP Advances, 14(4).
Lafler, R., Eickhoff, M. L., Newey, S. C., Gonzalez, Y. N., Stoltenberg, K. E., Camacho, J. F., ... & Lanning, R. N. (2024). Two-way quantum time transfer: A method for daytime space-earth links. Physical Review Applied, 22(2), 024012.
2023
Nomerotski, A., Chekhlov, M., Dolzhenko, D., Glazenborg, R., Farella, B., Keach, M., ... & Svihra, P. (2023). Intensified Tpx3Cam, a fast data-driven optical camera with nanosecond timing resolution for single photon detection in quantum applications. Journal of Instrumentation, 18(01), C01023.
| Posted Comments: | |
Suryadi Soekardjo
(posted 2025-07-23 17:37:46.477) I'm currently integrating my new Thorlabs Narrowband Correlated Photon-Pair Source (model SPDC810N) into my setup, which includes Si-based single-photon detectors and a Swabian Time Tagger. My preliminary results are showing very low coincidence counts, less than 10 Hz.
To troubleshoot this, could you provide detailed recommendations for optimizing the system's setup to achieve higher correlated photon click rates? Specifically, I need to know the precise operational temperature required for the PPKTP crystal to ensure optimal phase matching and efficient correlated photon pair generation. EGies
(posted 2025-08-13 05:55:33.0) Thank you for contacting Thorlabs. I have reached out to you directly regarding further troubleshooting steps. Prahlada B L
(posted 2025-06-11 10:28:45.217) Please share me some information on second order correlation measurement system SPDC810 and SPDC810N along with literature.
Do you provide complete setup for the second order correlation measurement or g2 EGies
(posted 2025-06-19 11:41:59.0) Thank you for contacting Thorlabs. The “Single-Photon Output” tab on the web (https://www.thorlabs.com/newgrouppage9.cfm?objectgroup_id=13675&tabname=single-photonoutput) gives a general overview regarding the g2 measurement. I have reached out to you directly to discuss your particular application. John Smith
(posted 2025-06-09 18:20:13.16) Hello,
I am currently working with this photon-pair source and I wanted to know if it is possible to have more information on how the temperature changes can vary the wavelength and if that affects in some way the generation of pairs. I was also interested in having a more complete understanding of the SPDC process happening inside the source.
Thank you for your answer. tdevkota
(posted 2025-06-13 04:21:31.0) Thank you for contacting Thorlabs. Please refer to our SPDC Tutorial (https://www.thorlabs.com/newgrouppage9.cfm?objectgroup_id=17247&tabname=SPDC%20Tutorial) for more information on the SPDC process. The last section discusses how the pump laser wavelength and crystal temperature influence the wavelengths of the signal and idler photons. I have reached out to you directly to further discuss the effects of crystal temperature specific to your device. kx y
(posted 2024-10-16 13:06:21.157) Hello, I need very precise wavelength degeneracy for SDPC810N, but it difficult to determine the crystal temperature corresponding to the optimal wavelength degeneracy without a single photon spectrometer and with a large tunable range of crystals (20-60℃). May I know that the crystal temperature range corresponding to the optimal degeneracy, or whether there is any experience value or test report? Thank you very much! tdevkota
(posted 2024-10-18 09:49:35.0) Thank you for contacting Thorlabs. We can provide the degeneracy temperature for the unit which we find during the device's performance verification. You will need to adjust the temperature of the crystal about this value to ensure proper optimization. I've reached out to you directly to share more details. kx y
(posted 2024-07-09 22:45:14.573) 1.For SPDC180N(photon bandwidth ~10nm), are the signal and the idle degenerate?
2.For SPDC810N, the pumping laser is pulsed light or continuous light? jpolaris
(posted 2024-07-12 06:29:53.0) Thank you for contacting Thorlabs. I believe you may have had a typo in the part number you gave in your first question. (1) SPDC810 (~10 nm photon bandwidth) is factory configured so that the integrated spectra of the signal and idler are degenerate at full pump power. For SPDC810N (< 0.25 nm photon bandwidth), you can tune in and out of degeneracy by adjusting the temperature of the internal nonlinear crystal. This can be achieved by using the knob on the front panel of SPDC810N. This may be needed for applications requiring a more precise degree of wavelength degeneracy.; (2) Yes, the SPDC810N pump is CW. Sangbae Kim
(posted 2024-05-21 08:30:02.157) I hope this email finds you well.
I am writing to inquire about the configuration of the SPDC810N. While it is not explicitly stated whether it is based on a Sagnac configuration, it appears to be utilizing a type-II collinear SPDC process to generate polarization-entangled photons. However, for the purpose of representing Bell states, it is necessary for the SPDC810N to have a Sagnac configuration during the generation process of SPDC photon pairs internally.
Could you please confirm whether the SPDC810N is configured in a Sagnac setup or a standard linear configuration?
Thank you for your attention to this matter. I look forward to your prompt response.
Best regards, jpolaris
(posted 2024-05-30 12:37:20.0) Thank you for contacting Thorlabs. SPDC810N is not an entangled source, and it does not utilize a Sagnac configuration. Rather, it utilizes a single-pass ppKTP arrangement. Two orthogonally polarized photons are produced as a pair, and then split by their polarization state. These photons are then delivered through independent bulkheads. I have reached out to you directly to discuss further. marc fleury
(posted 2023-06-13 09:04:01.347) Any information of the state of polarization of the photons?
Is this a SPDC source of entangled photons? If so what quantum state are they in ? Can I perform a Bell violation measure with this setup? cdolbashian
(posted 2023-06-16 09:46:03.0) Thank you for reaching out to us with this inquiry. Regarding the polarization states, the pair of photons are split by polarization and thus the wavefunctions can no longer be written of the two states as we have already "measured" the state. I will reach out to you to discuss the rest of your inquiries. user
(posted 2023-05-02 14:09:06.023) We have bought SPDC810 and hoped to use polarization-entangled photons in the beginning. But it seems this unit doesn't have polarization-entangled photons. I wonder if you could update/modify our SPDC810 to make it emit entangled photons. jdelia
(posted 2023-05-02 03:47:57.0) Thank you for contacting Thorlabs and for providing this valuable feedback. While this not a feature we currently offer, I can certainly pass along your request for a polarization-entangled version of the SPDC810 to our design engineers through our internal suggestion forum for consideration as a future product. user
(posted 2023-03-19 18:48:18.373) I see that the polarization-entangled photons produced have orthogonal polarizations. I'm interested to know at what roughly what percentage will pairs produced be horizontal/vertical versus diagonal/antidiagonal. Thanks in advance. jdelia
(posted 2023-03-22 11:24:18.0) Thank you for contacting Thorlabs. This unit does not have polarization-entangled photons. We have reached out to you directly to discuss your application. user
(posted 2022-10-20 20:53:20.513) 1. The polarization of signal and idler are always same (Say, signal always horizontal and idler always vertical) or different (Say signal can be V when idler is H and vise versa ) in their channels.?
2. Is it possible to achieve more lifetime.? cdolbashian
(posted 2022-10-31 01:05:53.0) Thank you for your inquiries. I have reached out to you directly to address your inquiries! user
(posted 2022-09-08 20:18:49.1) Like SPDC810 for 810nm, do you have the SPDC for 1550.
Thank you cdolbashian
(posted 2022-09-19 10:31:35.0) Thank you for reaching out to us with this inquiry. While it doesn't seem like this is a product which we currently have, I have reached out to you directly to discuss a potential alternative. Aitor Villar
(posted 2022-02-17 12:07:04.29) Dear Mr./Mrs.,
For import/export matters, may I know what would be the Harmonised System Code for this particular device? Thanks a lot. cdolbashian
(posted 2022-02-24 05:02:44.0) Thank you for reaching out to us Aitor. The HTS code for the SPDC810 is 9013.20.0000. Thomas Tsang
(posted 2021-06-08 15:58:08.723) We recently received our SPDC810
s/n TP02386869
PO # 00000394720
This device does not come with a PC control software other than RS232 driver. We were unable to verify that it is operating nor can we find any control software we can download from ThorLabs.
Please advice. YLohia
(posted 2021-06-09 02:10:21.0) Hello Thomas, thank you for contacting Thorlabs. We are about to release the software for the SPDC810. It should be available to download on this page soon, but we don't have a set release date at the moment. I've reached out to you directly with a pre-release version of it. tingting gu
(posted 2021-04-11 20:57:17.22) 1.Hello, are there any single photons with wavelengths between 600 and 700 nanometers?
2.Does this product include a pumped laser? Do I need to buy it separately?
3.Can we control the output velocity of single photon by adjusting the power of laser?
4.Does your company have TCSPC equipment? These devices are used to demonstrate single-photon properties. YLohia
(posted 2021-04-21 11:42:26.0) Hello, the output for the SPDC810 is 810 ± 2 nm (nothing between 600-700 nm). These is a turnkey system-- it contains a pump laser. Controlling the velocity of photons (speed of light) is not possible. This cannot be changed by controlling the power of the pump laser. We offer the SPCM20A Single Photon Counter Module, but it does not perform time correlated single photon counting. To make time correlated single photon counting, you would need additional electronics. Chris Ebbers
(posted 2021-03-09 12:14:50.097) Could we set up a virtual demo / virtual walkthrough regarding the SPDC 810 nm source?
Thank you
Chris Ebbers YLohia
(posted 2021-03-12 04:02:03.0) Hello again Chris, we will reach out to you directly to discuss this. Christopher Ebbers
(posted 2021-01-05 12:22:55.733) 1. Is there a manual available online for the SPDC810?
2. Are there any plans to create on of your famous teaching kits which would include the SPDC810, 2 silicon Avalanche photodiodes, beamsplitter, polarizers, & waveplates & manual with 5 or 6 experiments?
Thanks in advance YLohia
(posted 2021-01-06 10:27:56.0) Thank you for contacting Thorlabs. The manual can be accessed by clicking the red document icon next to the part number or by following this link (https://www.thorlabs.com/_sd.cfm?fileName=TTN209244-D02.pdf&partNumber=SPDC810). We will contact you directly to discuss your request about the educational kit. CHRISTIAN D'HEM
(posted 2020-12-07 13:00:46.047) Could you provide a SPDC810 with a Maxpairs/second between 10-100 Mhz (preferably 100)
Best regards YLohia
(posted 2020-12-08 02:48:34.0) Hello Christian, thank you for contacting Thorlabs. We have reached out to you directly to discuss the feasibility of offering this. user
(posted 2020-09-05 19:00:59.663) Is it possible to request a minor tuning of the center wavelength of the source. Specifically, could it be possible to have it at a slightly lower wavelength of 795 or 800nm? YLohia
(posted 2020-09-08 11:11:32.0) Thank you for contacting Thorlabs. Our engineers will reach out to you directly to discuss the possibility of offering this. |

 Zoom
Zoom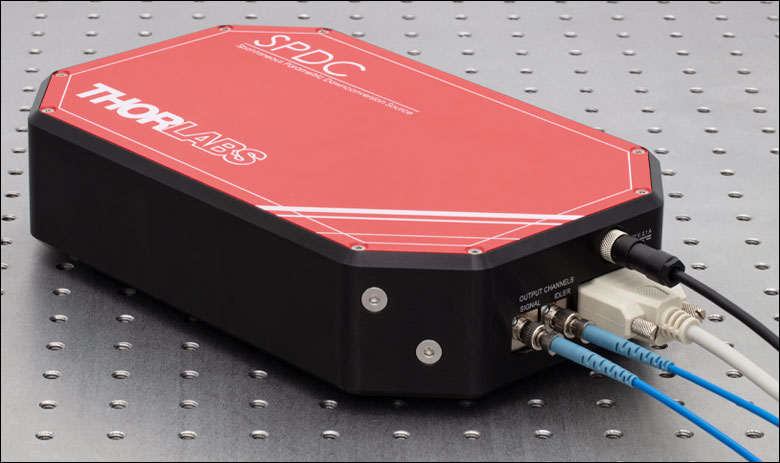
Click to Enlarge
Figure G1.1 SPDC810 Photon-Pair Source with Included P1-780PMAR-2 Patch Cables Connected to Signal and Idler Outputs
- >0.45 High Heralding Ratio
- >450 000 Coincident Pairs per Second
- Pump Laser Power Adjustable Up to 150 mW
- ±2.5 nm Wavelength Stability
- Photon Bandwidth: ~10 nm
- Remote Operation via Serial RS232
The SPDC810 Correlated Photon-Pair Source has an integrated 405 nm pump laser and NLCK2 PPKTP nonlinear crystal, generating photon pairs at a rate of >450 000 coincident pairs per second with a heralding ratio of >0.45. It is also temperature controlled, resulting in a wavelength stability of ±2.5 nm. For adequate cooling, the unit requires 1" of clearance on all sides.
The SPDC810 source is factory-aligned and ready to use. If misalignment occurs but signal is still detected, X- and Y-axis adjustments to the internal mirrors can be made through the access holes, which are covered by two hex screws, in the side of the housing; see the manual for details. The hex screws and internal adjusters accept a 5/64" or 2 mm balldriver (not included). Please contact Tech Support if no signal is detected.
The unit is shipped with a 12 V power supply with an M8 connector and an RS232 cable for operating the pump laser. For more information about these connectors, please see the Front and Back Panels tab. A complete list of the shipped components can be found in the Shipping List tab.

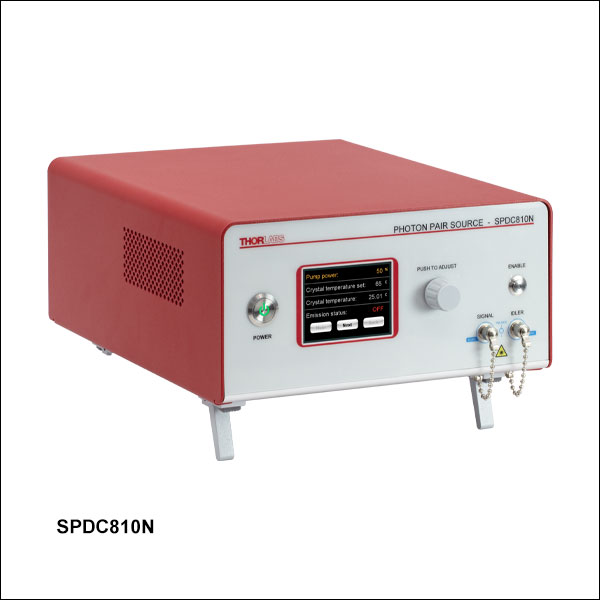 Zoom
Zoom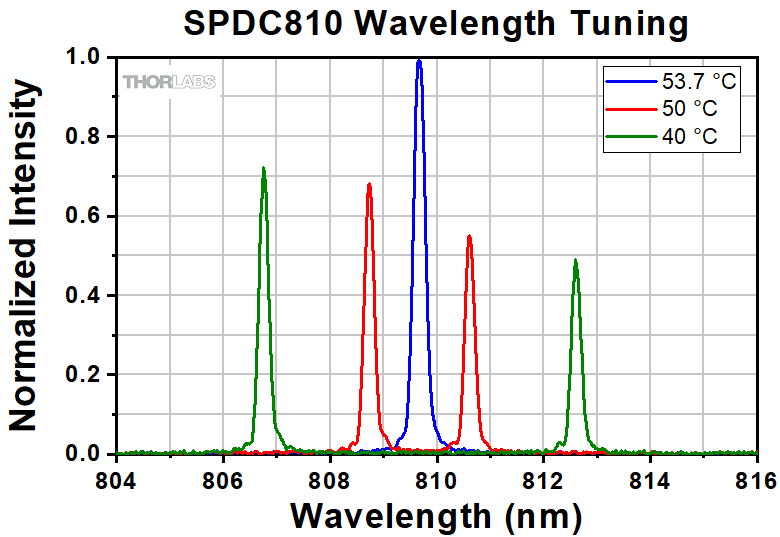
Click to Enlarge
Figure G2.1 The temperature of the NLCK2 nonlinear crystal in the SPDC810N source can be adjusted to change the output photon wavelength, for tuning in and out of degeneracy.
- >0.30 High Heralding Ratio
- >100 000 Coincident Pairs per Second
- Pump Laser Power Adjustable Up to 40 mW
- ±0.1 nm Wavelength Stability
- <0.25 nm Photon Bandwidth
- >8 nm Wavelength Tuning Range
- Control via the Front Panel or Remotely through USB
The SPDC810N Narrowband Correlated Photon-Pair Source is a turnkey system featuring a single-frequency, integrated 405 nm pump laser and NLCK2 PPKTP nonlinear crystal, generating photon pairs at a rate of >100 000 coincident pairs per second with a heralding ratio of >0.30. The photon-pair output at 810 nm has a photon bandwidth of <0.25 nm. The nonlinear crystal is temperature controlled, resulting in a wavelength stability of ±0.1 nm. To tune in and out of degeneracy, the temperature of the nonlinear crystal can be adjusted to change the output photon wavelength, as seen in Figure G2.1. For adequate cooling, the unit requires 1" of clearance on all sides.
The pump laser's power and the crystal temperature can be adjusted and monitored directly with the on-unit controls and touchscreen display. Alternatively, a USB 2.0 Type-B port on the back of the unit allows it to be connected to a PC and controlled remotely using the SPDC810 Software (available for download from the Software tab).
This SPDC Source is factory-aligned and ready to use. There are no user-serviceable parts in the unit, please contact Tech Support for servicing.

 Zoom
Zoom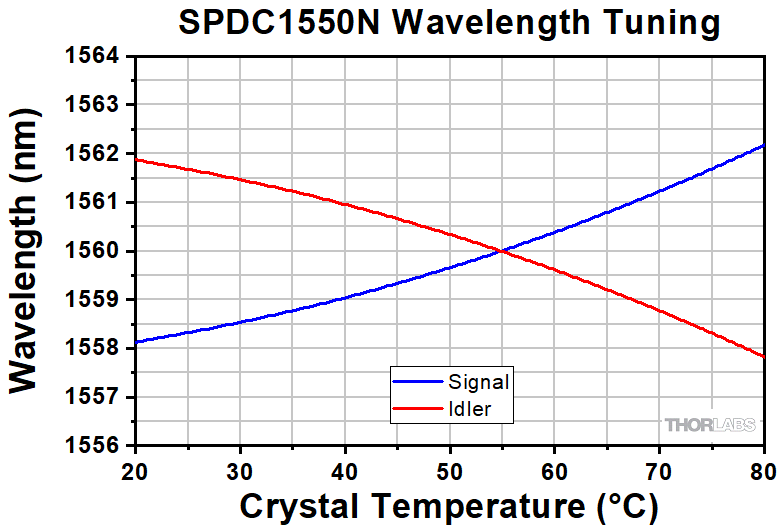
Click to Enlarge
Figure G3.1 The SPDC1550N source can be tuned in and out of degeneracy by adjusting the temperature of the NLCK4 nonlinear crystal.
- >0.30 High Heralding Ratio
- >100 000 Coincident Pairs per Second
- Pump Laser Power Adjustable Up to 40 mW
- ±0.1 nm Wavelength Stability
- <0.25 nm Photon Bandwidth
- 3 nm Wavelength Tuning Range
- Control via the Front Panel or Remotely through USB
The SPDC1550N Narrowband Correlated Photon-Pair Source is a turnkey system featuring a single-frequency, integrated 780 nm pump laser and NLCK4 PPKTP nonlinear crystal, generating photon pairs at a rate of >100 000 coincident pairs per second with a heralding ratio of >0.30. The C-band photon-pair output at 1560 nm has a photon bandwidth of <0.25 nm. The nonlinear crystal is temperature controlled, resulting in a wavelength stability of ±0.1 nm. To tune in and out of degeneracy, the temperature of the nonlinear crystal can be adjusted to change the output photon wavelength by more than 3 nm, as seen in Figure G3.1. For adequate cooling, the unit requires 1" of clearance on all sides.
The pump laser's power and the crystal temperature can be adjusted and monitored directly with the on-unit controls and touchscreen display. Alternatively, a USB 2.0 Type-B port on the back of the unit allows it to be connected to a PC and controlled remotely using the SPDC Software (available for download from the Software tab).
This SPDC Source is factory-aligned and ready to use. There are no user-serviceable parts in the unit, please contact Tech Support for servicing.