 Products Home
Fiber End Face Interferometer
- Rapidly Characterize End Face Geometry of Fiber Connectors
- Measurements Based on IEC Test Standards
- Includes NIST-Traceable Calibration Standards
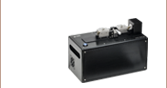
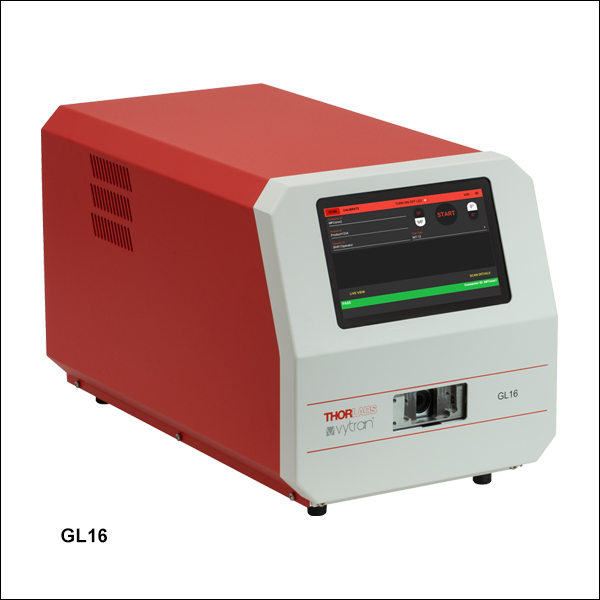
GL16
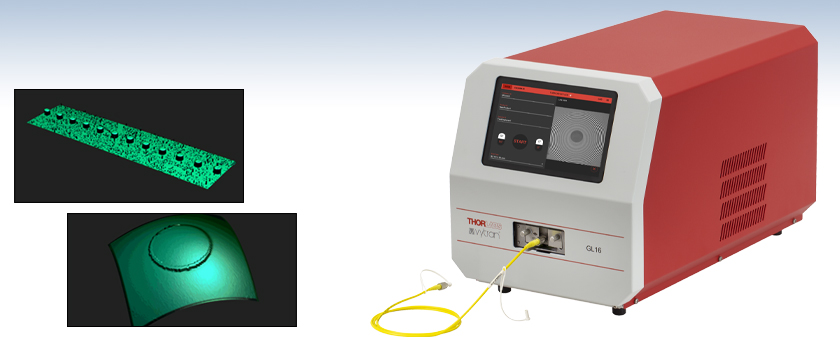
All-in-One Interferometer (Example Cable Not Included)
3D Scan of 12-Fiber Linear Array in MT-Style Ferrule
3D Scan of Single Mode Fiber in FC/PC Connector


Please Wait

Features
- 3D Interferometer for Measuring End Face Geometry
- Non-Contact Scanning White Light Interferometry
- Fully Compliant with Industry Standards, e.g., IEC and Telcordia
- Compatible with All Major Connector Types (See Table Below)
- NIST-Traceable Standards for Calibration of Magnification and Tilt Stage
- Full Scan Information Available in ≤8 Seconds (Typical) on Integrated Touchscreen
- Browser-Based Application Supports Remote Access Operation
- Data Exportable to .CSV Format, SQL Database, or Scan Report
Thorlabs' GL16 End Face Interferometer measures and images the end face geometry of single- and multi-fiber connectors. A non-contact technique called scanning white-light interferometry (SWLI) provides high accuracy, repeatability, and reliability for fiber connector testing, particularly for pass/fail testing using IEC or Telcordia requirements. The system can be controlled locally through the touchscreen display or remotely through a browser-based application (see Software tab for details), allowing it to be easily integrated on the production floor.
All the system components are fully integrated in the enclosed housing. A wide-bandwidth 570 nm LED light source is used with a Michelson interferometric objective lens to measure the phase shift for step height changes as large as 35 µm. A piezoelectric stage moves the interferometric objective lens relative to the connector and collects the resultant interference patterns using a high-resolution camera. A 3D height map of the connector surface is created and then used to calculate the fiber geometry parameters with lateral resolution of 2.2 µm and height resolution of 1.1 nm (see Measurement tab for details). White-light interferometry is able to characterize undercut or protruded fibers that would be missed using a monochromatic interferometer (see Interferograms tab for details).
The included GL16M4 MT-style fixture enables 8-second measurement of up to 72 fibers at a time in 12-fiber-row ferrules. The GL16 interferometer is capable of measuring a variety of additional fiber types and connector styles (shown in the table below) by swapping out the included fixture. Choose the appropriate mounting assembly below for your connector type and the number of fibers to be measured.
| System Specifications | ||
|---|---|---|
| Accepted Fiber Diameters | Single Fiber | 60 - 280 µm |
| Multi-Fiber | 60 - 250 µm | |
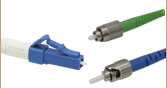
| Accepted Connectors | Single Fiber | FC/PC, FC/APC, SC/PC, LC/PC |
| Multi-Fiber | MT-Style Ferrule (MT12 or MT16) MPO-Style Connectora (MPO12 or MPO16) |
|
| Measurement Lateral Resolution | 2.2 µm | |
| Measurement Height Resolutionb | 1.1 nm | |
| Field of View (W x H) | 4.2 mm x 2.4 mm | |
| Depth Scan Range | 70 µm | |
| Total Measurement Time | Single Fiber | 4 s (Typical) |
| Multi-Fiber | 8 s (Typical) | |
| Hard Drive (SSD) Storage | 500 GB | |
| Weight | 10.4 kg (23 lbs) | |
| Electrical Power | 120 / 240 VAC, 50 / 60 Hz at 1 A | |
| Dimensions (L x W x H) | 10.15" x 18.38" x 11.14" (257.8 mm x 466.9 mm x 238.0 mm) |
|
Click to Enlarge
Interferometric scans are used to measure the fiber and connector geometry and compare the results against a database of industry-standard pass/fail conditions. The fiber is imaged as a dark circle while the center of the interference rings indicates the center of the connector surface.
| Measurement Parameters | |||
|---|---|---|---|
| Parameter | Range | Repeatabilitya | Reproducibilityb |
| Radius of Curvature | 3.0 mm - Flat | 0.15% | 0.30% |
| Fiber Height | -35 - 35 µm | 0.001 µm | 0.002 µm |
| Apex Offset | 0 - 500 µm | 0.3 µm | 0.7 µm |
| Polish Anglec | 0° ± 0.5° or 8° ± 0.5° | 0.002° | 0.015° |
| Key Error | -90° - 90° | 0.002° | 0.03° |
Click to Enlarge
Figure 2: Diagram illustrating linear apex offset in a single axis.
Click to Enlarge
Figure 1: Diagram illustrating fiber height measurement methods
Single-Fiber Measurement Definitions
Radius of Curvature
The average curvature radius (in mm) for the connector end face is defined as the radius of the best-fit curvature over the specified fitting area calculated by using a least-squares method. Although typically a sphere is the best-fit model, an ellipsoid may be used for a high or low radius of curvature (ROC).
Fiber Height
Fiber height is the amount of undercut or protrusion (in nm) of the fiber in the connector. It is defined as the difference between the height at the center of the fiber and the projected height of the ferrule at the same location. The projected height of the ferrule can be determined using either a spherical method or planar method (shown in Figure 1). The spherical method is recommended in the TIA and IEC test procedures for FC/PC or FC/APC connectors, while the planar height method is often used for flat-polished connectors.
Apex Offset
The linear apex offset is defined as the distance from the apex (high point) of the ferrule’s spherical end face to the center of the fiber measured in a plane perpendicular to the fiber axis (see Figure 2). These measurements are given in terms of their X and Y components.
Polish Angle (APC or Flat-Polish Connector Only)
The polish angle is defined as the nominal tilt of the connector end face polish. This value is only measured when the scan is set up for an angled polish connector (APC) or a connector with a flat end face polish.
Key Error (APC Connector Only)
Key error is the angular direction of the polish offset for APC connectors, defined as the angle of the line drawn from the fiber center to the end face apex. This value can be used to help refine or correct the procedure used to polish an angled connector surface. This value is only measured when the scan is set up for an APC connector.
| Measurement Parameters | |||
|---|---|---|---|
| Parameter | Range | Repeatabilitya | Reproducibilityb |
| Ferrule Radius of Curvature | 3.0 mm - Flat | 0.15% | 0.30% |
| Fiber Radius of Curvature | |||
| Fiber Height | 0 - 35 µm | 0.005 µm | 0.010 µm |
| Adjacent Height DIfferential | |||
| End Face Angle (X/Y) | -0.5° - 0.5° | 0.001° | 0.01° |
| Fiber Plane Angle (X/Y) | |||
| Minus Coplanarity | 0 - 35 µm | 0.003 µm | 0.005 µm |
| Core Dip | 0 - 0.5 µm | 0.005 µm | 0.01 µm |
| Geometry Limit | 0 - 50 | 0.4 | 0.4 |
Click to Enlarge
Figure 3: Diagram illustrating the fit planes for determining minus coplanarity for a 12-fiber multi-fiber connector.
Click to Enlarge
Figure 4: Schematic illustrating core dip measurement for a single fiber.
Multi-Fiber Measurement Definitions
Ferrule Radius of Curvature
Ferrule ROC is measured as the X and Y radii of curvature determined by fitting an ideal bi-parabolic surface to the actual surface of the connector excluding fibers over the region of interest.
Fiber Radius of Curvature
Fiber ROC is measured for each fiber in the tested ferrule or connector. Each radius is determined by fitting an ideal sphere to the fiber end face.
Fiber Height
Fiber height is the distance between the height of each fiber and a plane that best fits data from the region of interest (as defined in IEC/TIA testing specifications).
Adjacent Height Differential
Adjacent height differential indicates the largest difference in fiber height measurement for any given fiber with respect to its immediate neighbor fibers within its row and/or to an adjacent row. Each fiber is compared to at least 2, and up to 4 other fibers.
End Face Angle
End face angle is the angular deviation (in degrees) of the connector end face from a plane perpendicular to the center lines of the guide holes. An end face angle is measured along both the X-axis and Y-axis of the plane.
Fiber Plane Angle
The angle of the plane that best fits all of the fiber end faces on the connector is defined relative to a plane perpendicular to the averaged center lines of the two connector guide holes. A fiber plane angle is measured along both the X-axis and Y-axis of the plane. For the case of a connector with only one row of fibers, the fiber array’s Y angle is determined by a best fit to the ferrule.
Minus Coplanarity
Minus coplanarity describes the fiber height difference between the least protruded (lowest) fiber and the best fit fiber plane for an array or line of fibers in a multi-fiber connector. A low value indicates that the fiber end faces are nearly coplanar while a large value indicates a large variance in fiber height, which can lead to issues during fiber mating. As shown in Figure 3, the best fit coplanarity plane is the plane or line that best represents the fiber height of all fibers in the connector. The minus coplanarity and total coplanarity are both measured perpendicular to the best fit plane, not the connector surface plane.
Core Dip
Core dip denotes the dip (positive value) or protrusion (negative value) of the fiber core relative to the fiber cladding, which can increase insertion loss during mating. This typically occurs during the polishing process because of differences in the polishing rates between the fiber core, which is sometimes a softer material, and the fiber cladding. In a multi-fiber connector, significant amounts of core dip may affect the amount of light transmission between two connectors when mated.
Core dip is measured by fitting an ideal paraboloid to the curvature of the region of interest. A plane is then found that passes through points on this paraboloid at a specified radius away from the fiber center (15 µm for IEC industry standards). The core dip is the difference between the height on the plane at coordinates matching the position of the fiber center and the height of the lowest point on the fitted paraboloid. Figure 4 illustrates how to determine both the low point and the theoretical fiber height.
Geometry Limit
Geometry limit is a calculated merit function that is used to quantitatively assess the geometric parameters of a multi-fiber connector end face, determine the acceptability for physical mating, and acts as a predictor for signal loss during mating. This calculation relates several parameters, including X-axis end face angle, minus coplanarity, and radius of curvature, to the characteristic ferrule compression force. For a given set of end face conditions, a low geometry limit indicates better mating performance. The upper limit of acceptable geometry limit values is set by IEC testing specifications.
The GL16 Fiber End Face Interferometer features a measurement software program that is fully integrated into the system. The intuitive controls and customization options ensure that it is easy to use right out of the box while also providing sufficient flexibility to accommodate any user requirements during the measurement process. The GL16 interferometer is equipped with both local and remote system operation. Locally, the system can be controlled via the touch-screen display or using a keyboard or mouse peripheral via the USB 3.0 port located at the rear of the system. Remote control of the system can be accomplished by connecting the interferometer to a network via the Ethernet port located at the rear of the system and then accessing the controls via an easy-to-use browser application. Measurement data in the form of .CSV or PDF format can be accessed and copied using the remote control functionality.
Multi-Fiber Software Features
When used with a multi-fiber connector, such as an MT-style ferrule or MPO-style connector, the software tailors the user interface, measurement parameters, and field of view to accommodate these connectors. The GL16 interferometer includes scan setup profiles for MPO-style connectors by default. Additionally, users can create new profiles and parameter rulesets to accommodate other connectors via the scan setup dialog. The images below show screenshots of the software when scanning a 12-fiber ferrule using an IEC standard ruleset.
Click to Enlarge
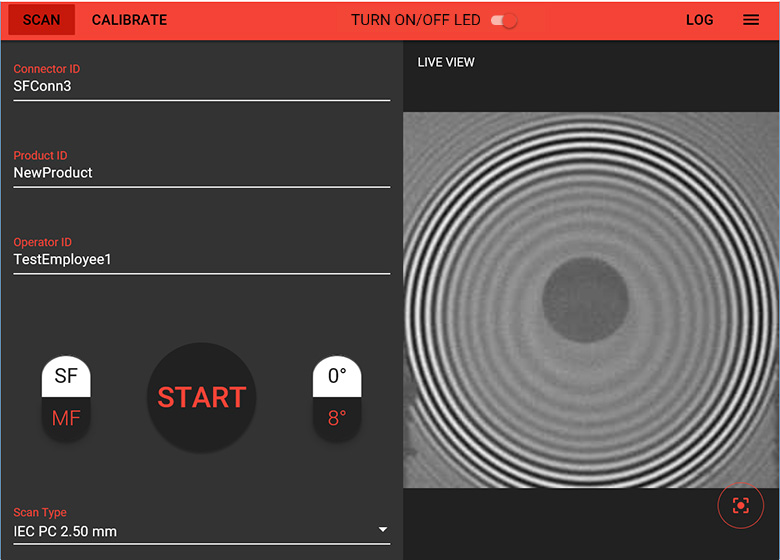
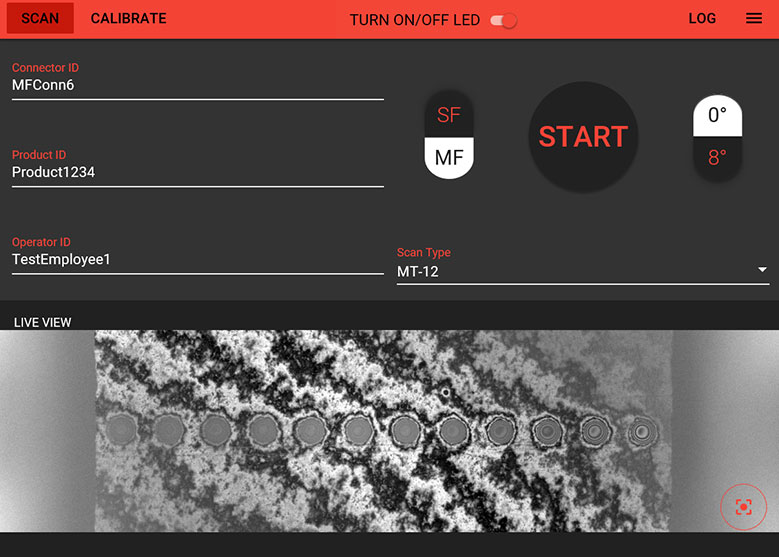
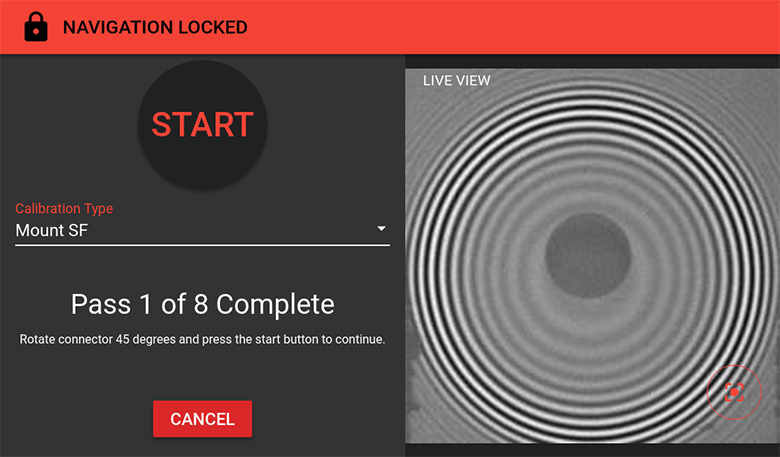
Scan Control Screen
Displays main scan controls, live sample image, and the result of the last scan performed. When the system is first initialized, a live view image is not shown. An on/off switch allows the bright LED source to be turned off when not in use.
Click to Enlarge
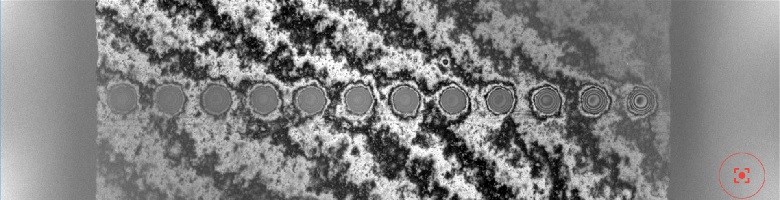
Live View
This live image from an MT12 connector is displayed on the scan control screen (left image). The outer diameters of the 12 fibers mounted in the connector are visible in the scan. The red button in the lower right of the image is used to focus the view.
Click to Enlarge
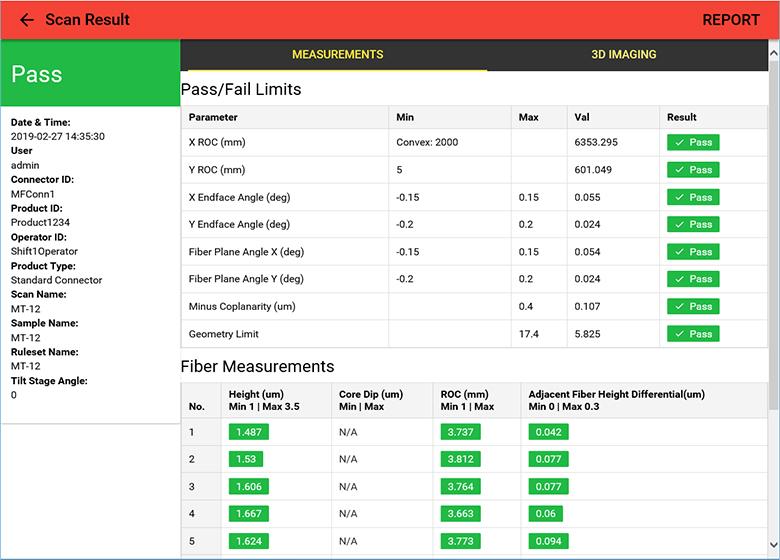
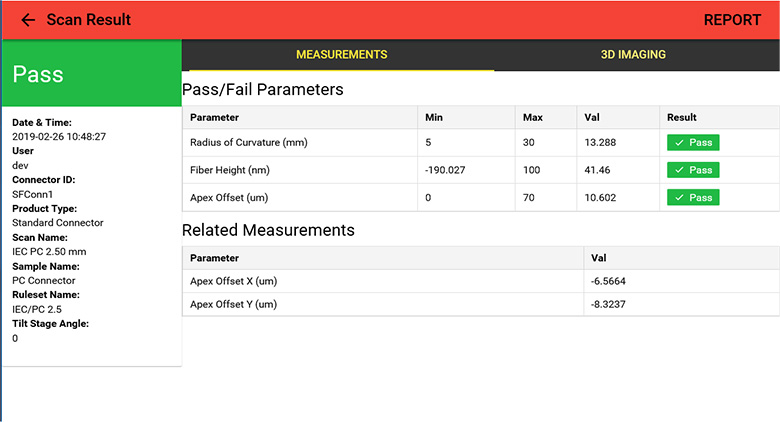
Scan Result
Displays the pass/fail limits of the scanned parameters, the measured result, and the pass/fail result for each fiber in the multi-fiber connector. The report can be exported to a printable scan report; click here for a sample.
Click to Enlarge
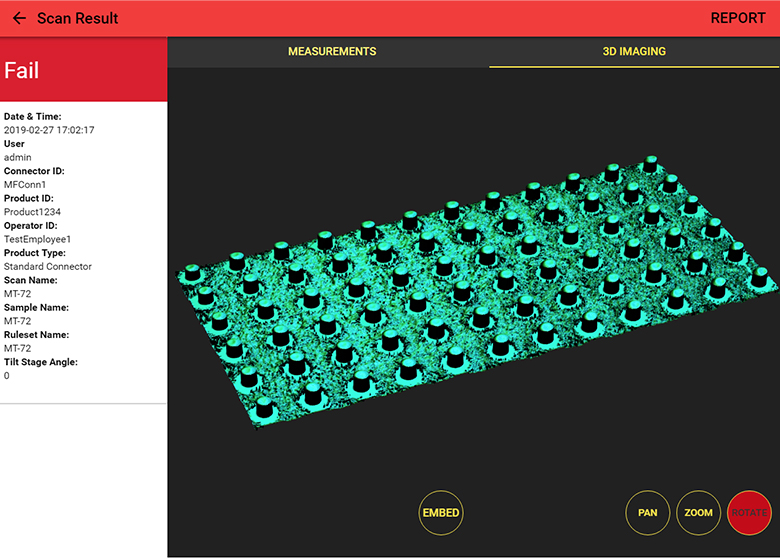
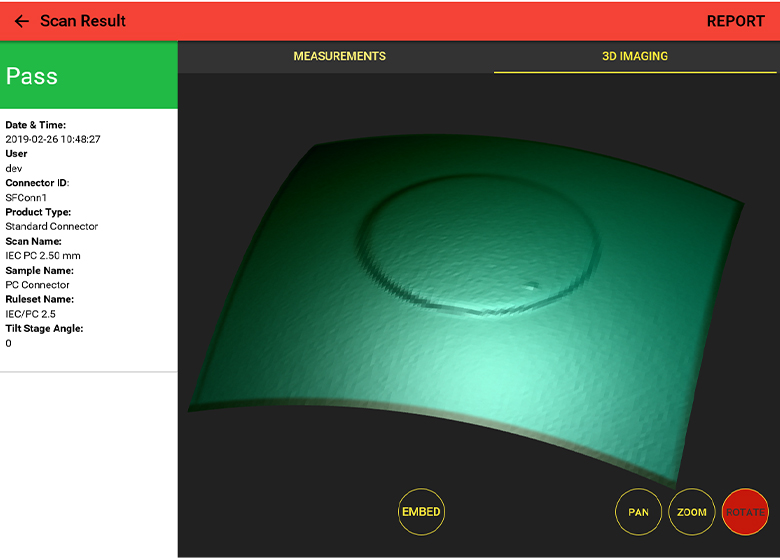
3D Scan Result
Displays the 3D image based on the results of the interferometric scan.
Single-Fiber Elements
The GL16 interferometer can handle both multi-fiber and single-fiber connector types. When switching connector mounts, Thorlabs recommends performing a mount calibration using either the included calibration ferrule (multi-fiber connectors) or leveling tool (single-fiber connectors) and following the instructions on the calibration screen.
Click to Enlarge
Calibration Screen
Displays the calibration options available for magnification, tilt stage, and four types of connector mounts.
Click to Enlarge
Live View and Scan Control
Displays main scan controls, live sample image, and the live scan image from the sample. The outer diameters of the 12 fibers mounted in the connector are visible in the scan. The red button in the lower right of the image is used to focus the view.
Click to Enlarge
Scan Result
Displays the pass/fail limits of the scanned parameters, the measured result, and the pass/fail result for each parameter. The report can be exported to a printable scan report; click here for a sample.
Click to Enlarge
3D Scan Result
Displays the 3D image based on the results of the interferometric scan.
Data Management
Results from a scan, including all physical parameters, are stored in an internal SQL database. At the end of a successful scan, the result logs show the pass/fail status of each connector scanned and the cause(s) of a failed device. Further detail such as 3D scan images and a report of all measured parameters is available for each device scanned. All scan data reports can be exported in CSV file format as well as a PDF-format and can be viewed locally or through remote access. Exported measurements can be stored offline after downloading them via remote access.
Click to Enlarge
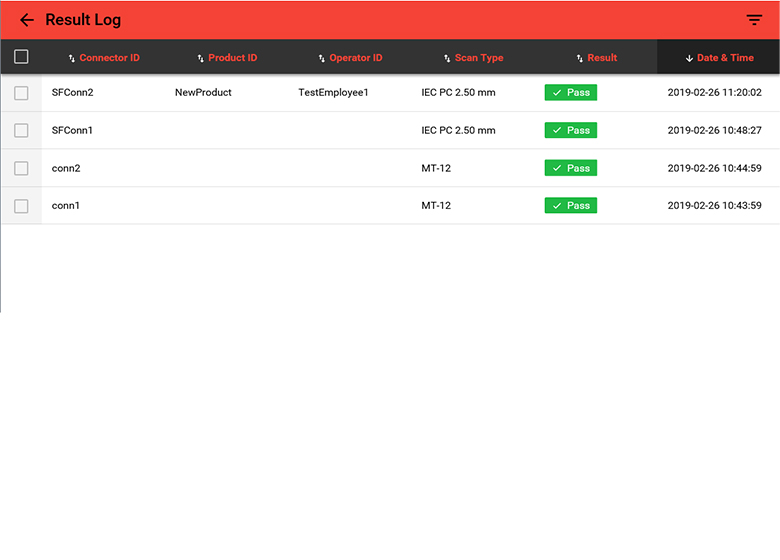
Result Logs
Displays all previously performed scans. Each result can be opened to view detailed results such as parameter values and 3D images.
Click to Enlarge
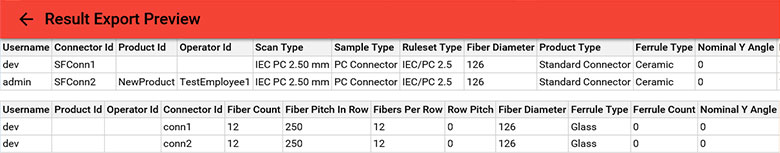
CSV Export
Tests selected in the Result Logs can have their results and scan parameters exported to CSV format for easy viewing using a spreadsheet program.
Reading Fiber Optic Interferograms
Inspection interferometers split light from a source between a reference flat and a surface under test. By recombining the beams of the reference arm and sample arm, an interference pattern is created allowing imperfections in a fiber tip to be inspected without making physical contact.
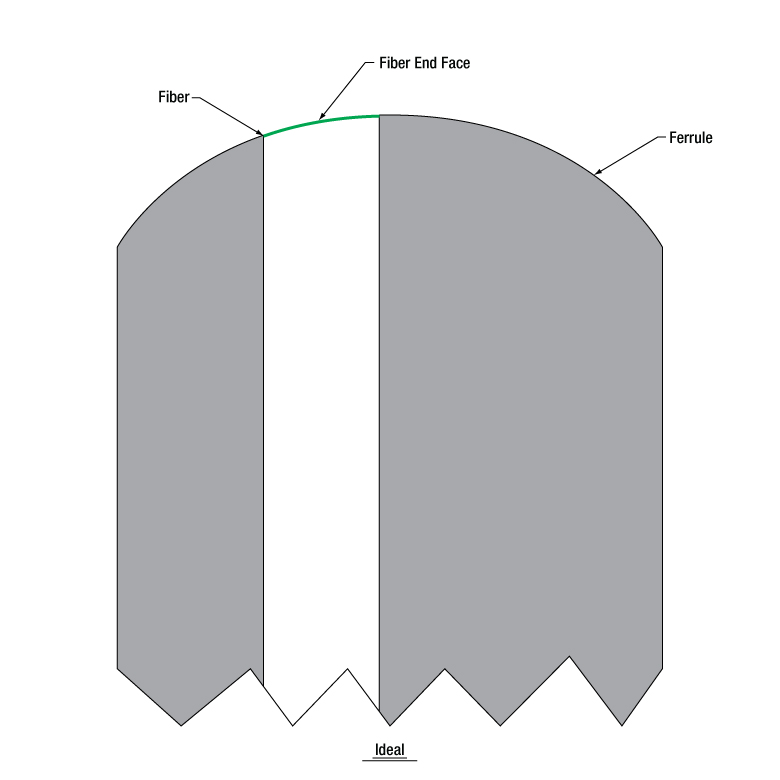
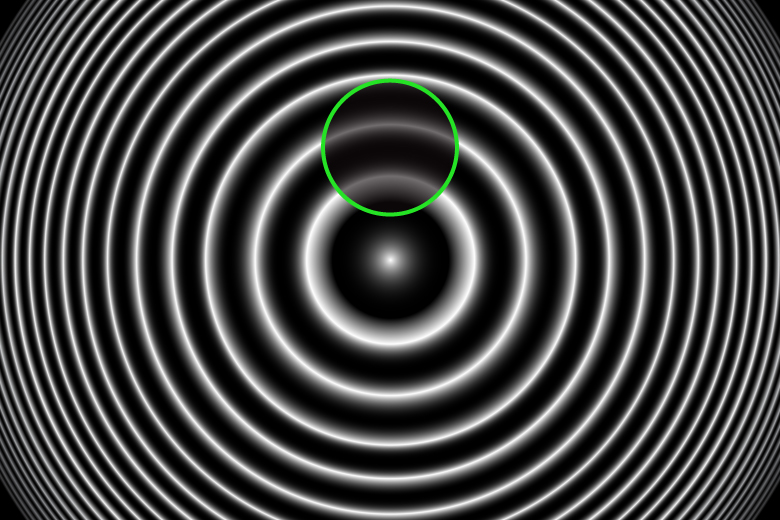
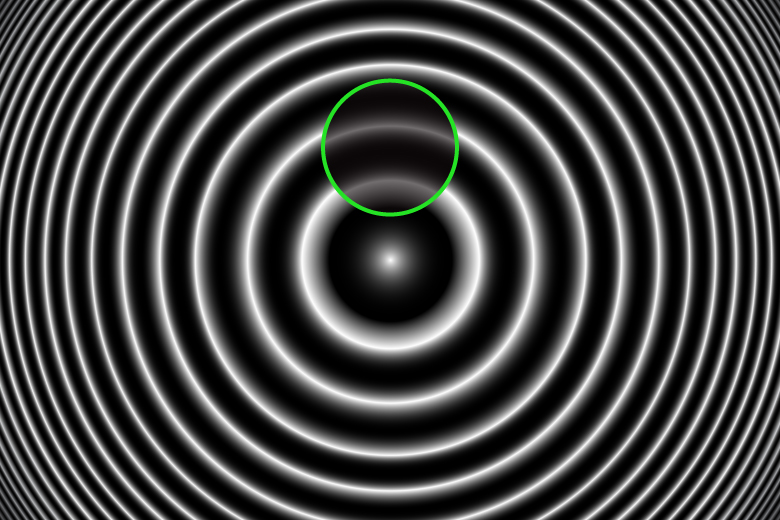
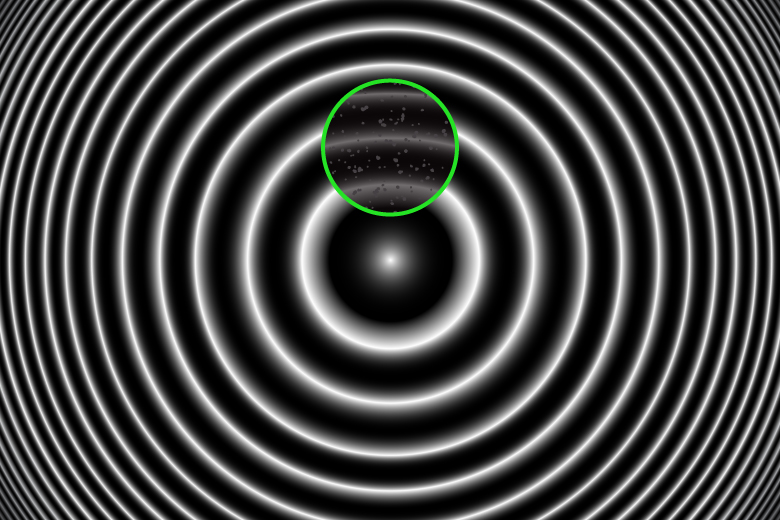
When produced perfectly, fibers are polished to match the height, curvature, and angle of their ferrule tip. With no imperfections, the fiber end face will seamlessly match the rest of the ferrule tip. This interferogram will be a bullseye of alternating constructive and destructive interference, or fringes (Figure 1). The location of the fiber end is marked in green on the fiber schematics and circled in green on the interferograms. Note that the fiber is not perfectly centered in the ferrule. There will be a small offset between the fiber center and the apex of polish; often, an off-center fiber can make disturbances in the interferogram easier to see, as the fiber interacts with more fringes.
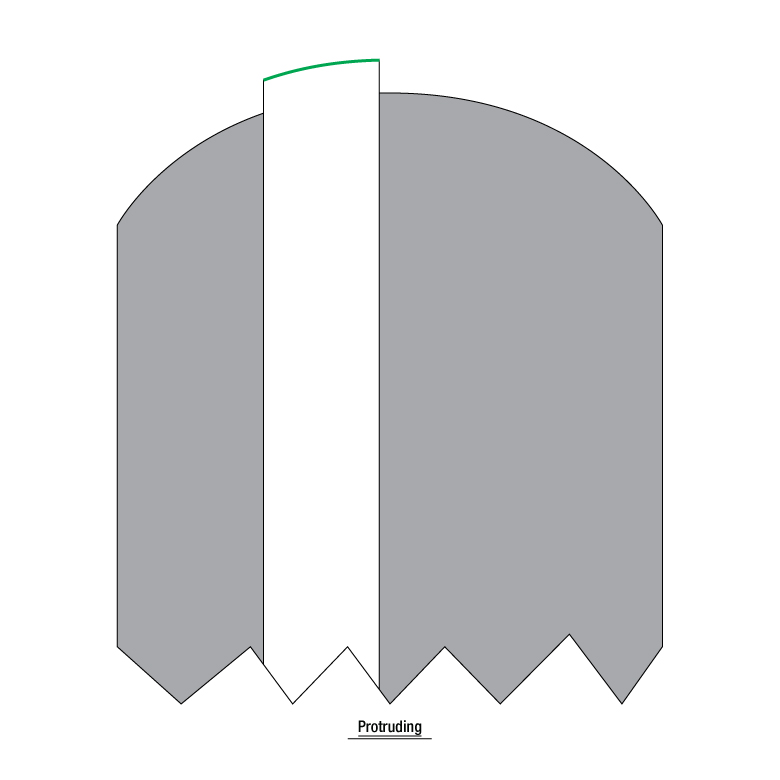
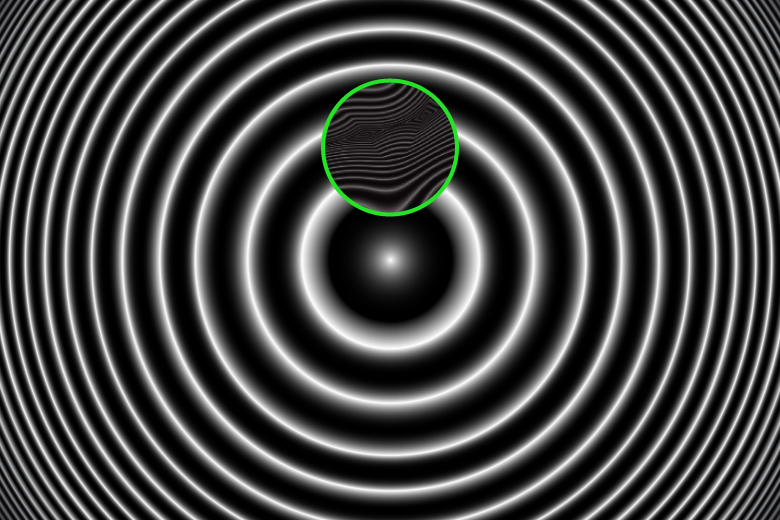
Deviations from an ideal polish will result in visible distortions within the green-circled region of the interferogram. If a fiber end protrudes past the surface of the ferrule, the interferogram will show a distortion that advances the fringe pattern away from the ferrule's apex of curvature (Figure 2). If a fiber end is undercut, the interferogram will show a distortion with retreats from the apex of curvature (Figure 3). An undercut fiber could collect dust, which will either absorb or scatter light, causing dots to appear in the interferogram (Figure 4). If a fiber end has shattered in the polishing process, the interferogram will be highly irregular (Figure 5).
 Click to Enlarge
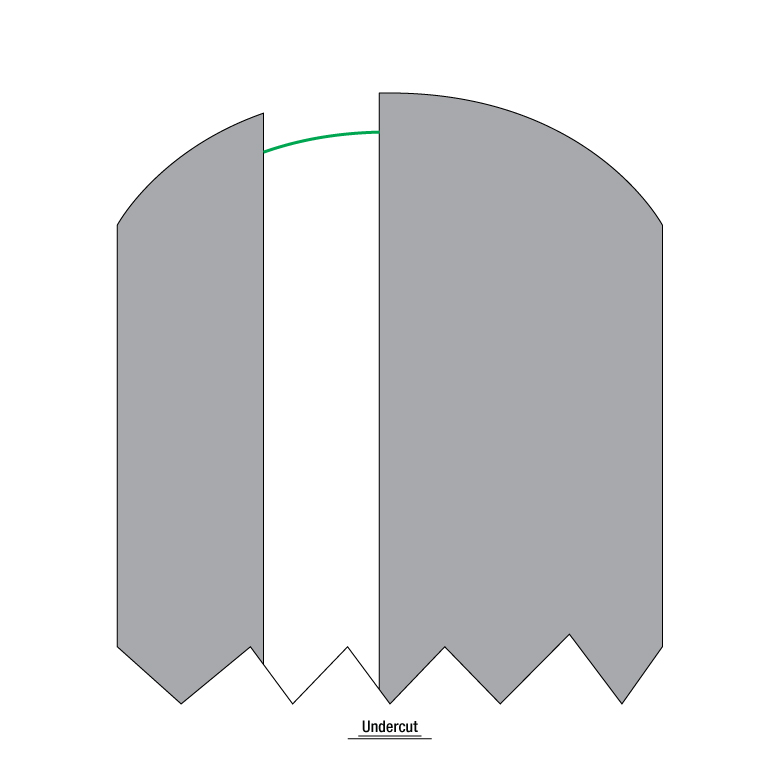
 Click to Enlarge
 Click to Enlarge
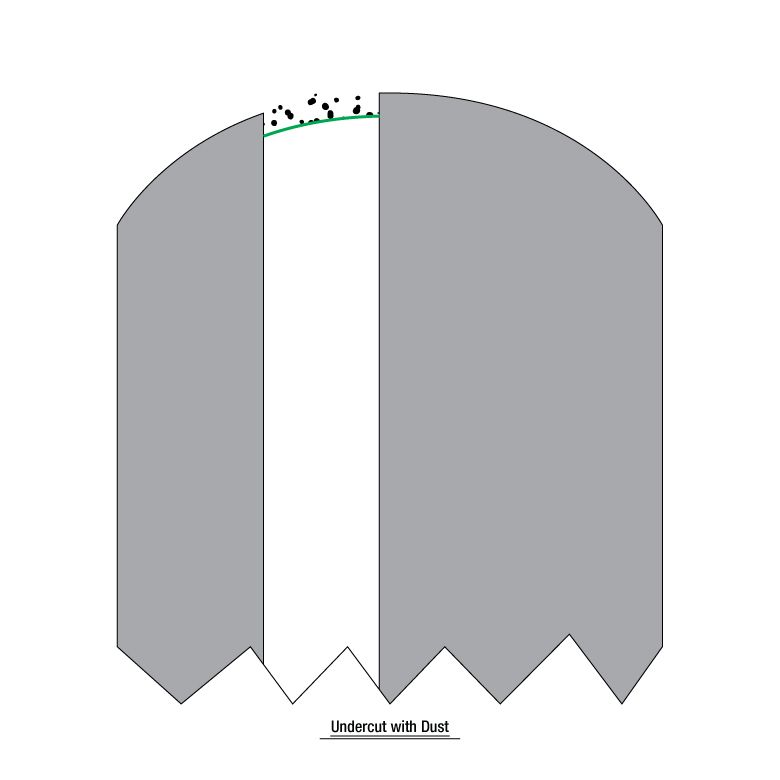
 Click to Enlarge
| Posted Comments: | |
user
(posted 2023-10-17 10:06:26.673) We are looking for a system to measure the angular alignment of the stress rods in an FC/APC connector to the connector key.
I see in the comments you were looking at this in March 2022
Does this or another Thorlabs tool now provide this capability of measurement? jdelia
(posted 2023-10-20 08:38:23.0) Thank you for contacting Thorlabs. This product is unfortunately still something we have not yet developed. However, it is an application being considered for future products in our catalog. user
(posted 2022-03-11 13:11:34.147) Can the device be configured to see or even measure stress rod alignment in PM fibers to a connector Key jgreschler
(posted 2022-03-16 11:17:55.0) Thank you for reaching out to Thorlabs. The GL16 is not capable of being used for PM fiber stress rod alignment. However, this is an application that is being considered for future Vytran product design. user
(posted 2022-02-10 12:02:32.783) Do you offer demos for this unit or can we send you facets to inspect? jgreschler
(posted 2022-02-11 03:49:16.0) Thank you for reaching out to Thorlabs. In certain cases we can arrange for demonstrations of our devices, we have reached out to you directly to discuss setting one up. Likewise we are able to accept process samples for inspection and return results to you. Cha youngmin
(posted 2021-06-30 19:37:29.82) do you sell reference tool for 12MPO? YLohia
(posted 2021-06-30 01:58:52.0) The GL16 is compatible with MPO12 when used with the GL16M2 fixture. |

 Zoom
ZoomComponents Included
- GL16 Fiber End Face Geometry Interfermometer
- Integrated Scan and Data Management Software
- One GL16M4 12-Fiber Mounting Fixture
- NIST-Traceable Magnification Calibration Reticle
- NIST-Traceable 0°/8° Tilt Stage Calibration Standard
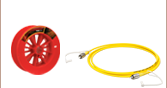
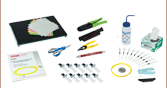
- Fiber Connector Cleaner
- 100 - 240 VAC, 50/60 Hz, 4.0 A External Power Supply
- Region-Specific Power Cord
Optional Purchases (Available Below)
- Mounting Fixtures
- Leveling Tools
- Fixture Inserts for Angled Polish Connectors
- Fiber End Face Geometry Interferometer with Touchscreen Operation
- Integrated Scan and Data Management Software
- 12-Fiber, MT-Style Mounting Fixture (Item # GL16M4) Included
- Additional Mounting Fixtures Available Separately Below
The GL16 Interferometer provides all the necessary components for fiber end face geometry measurement integrated into a compact housing with a 7" capacitive touch-screen display for local control. The intuitive software user interface is designed for ease of use while providing a high degree of customizability over testing and report export options.
One GL16M4 Mounting Fixture is included; other fixtures can be purchased separately below. Each mounting fixture includes two knurled thumbscrews that are used to attach it to the sample port directly below the display. The sample port has a controllable, motorized stage that tilts to adjust for connectors with a 0° or 8° polish. Use the appropriate fixture insert (sold separately below) for the angled connector and perform a mount calibration when switching to a new mount.

 Zoom
Zoom
Click to Enlarge
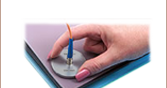
Single Mode FC/PC Patch Cable Mounted to GL16 Interferometer
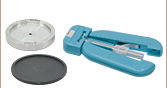
- Fixture for Patch Cables with Ø2.5 mm Ferrule or FC/PC, SC/PC, or ST®*/PC Connector
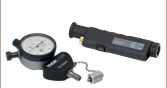
- Leveling Tool for Calibration of Mounting Fixture
- Fixture Inserts for Connectors with Angled Polish Surfaces (APC)
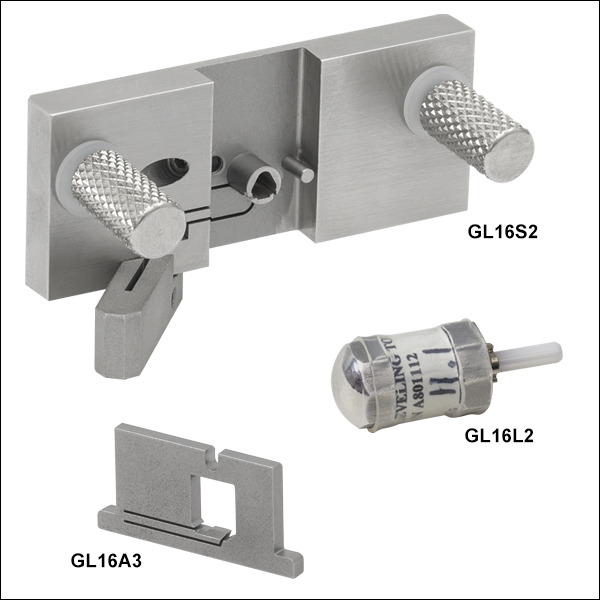
Thorlabs' single-fiber mounting fixtures use an integral leaf spring design to provide accurate and repeatable mounting of fiber patch cables in the GL16 interferometer. The GL16S2 fixture is compatible with Ø2.5 mm ferrules, as well as FC/PC, SC/PC, and ST/PC connectors. A GL16L2 Leveling Tool is required for calibration when changing mounting fixtures. The GL16A1 and GL16A4 Fixture Inserts provide compatibility with 2.0 mm narrow key (Type R) and 2.2 mm wide key (Type N) FC/APC connectors, respectively. For compatibility with SC/APC connectors, use the GL16A3 Fixture Insert. Custom mounts are also available upon request by contacting Tech Support.
The mounting fixture attaches to the tilt stage with two knurled thumbscrews. To mount a connector, first turn the locking lever to the left to open it, insert the connector into the mount until it bottoms out, and then turn the lever to the right to lock the connector in place. When mounting ferrules with an angled polish, such as FC/APC or SC/APC connectors, secure the appropriate fixture insert on the mounting fixture using a 0.05" hex key.
*ST® is a registered trademark of Lucent Technologies, Inc.

 Zoom
Zoom- Fixture for Patch Cables with Ø1.25 mm Ferrule or LC/PC Connector
- Leveling Tool for Calibration of Mounting Fixture
- Fixture Insert for Connectors with Angled Polish Surfaces (APC)
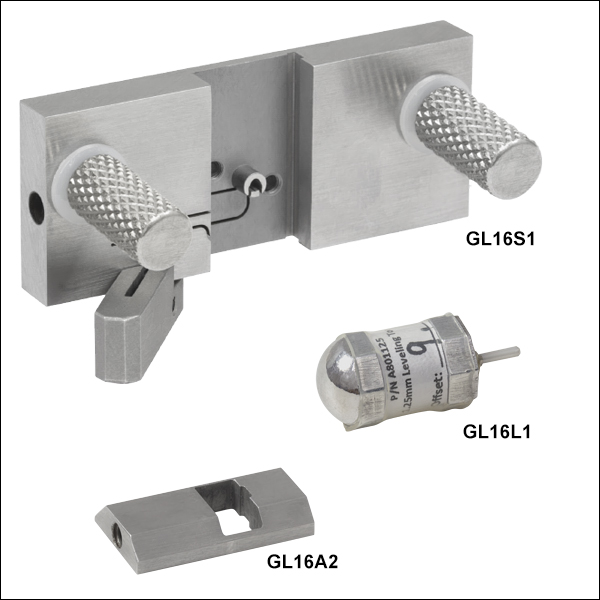
Thorlabs' single-fiber mounting fixtures use an integral leaf spring design to provide accurate and repeatable mounting of fiber patch cables in the GL16 interferometer. The GL16S1 fixture is compatible with Ø1.25 mm ferrules and LC/PC connectors. A GL16L1 Leveling Tool is required for calibration when changing mounting fixtures. The GL16A2 Fixture Insert provides compatibility with LC/APC connectors by aligning the angled polish of these ferrules with the interferometer. Custom mounts are also available upon request by contacting Tech Support.
The mounting fixture attaches to the tilt stage with two knurled thumbscrews. To mount a connector, first turn the locking lever to the left to open it, insert the connector into the mount until it bottoms out, and then turn the lever to the right to lock the connector in place. When mounting ferrules with an angled polish, such as LC/APC connectors, use the GL16A2 Fixture Insert.

 Zoom
Zoom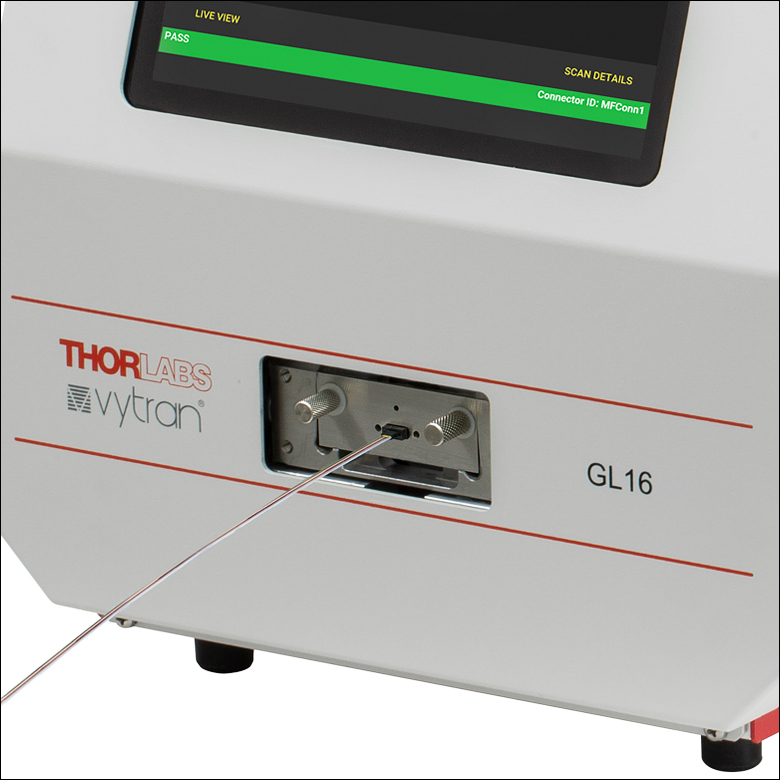
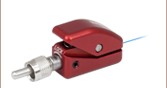
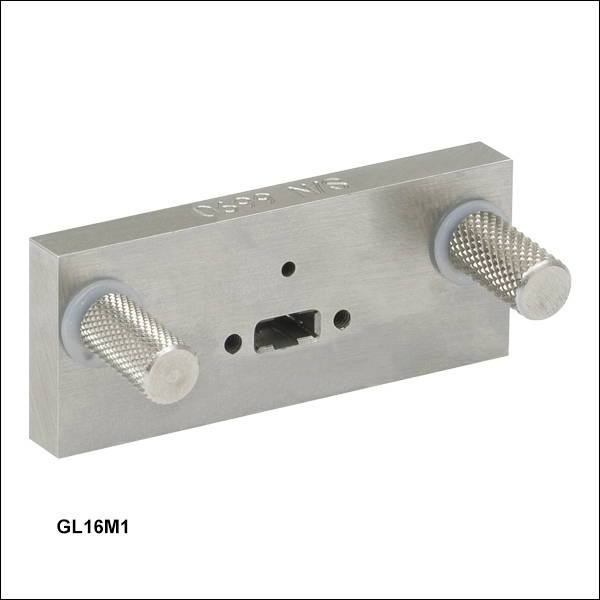
Click to Enlarge
GL16M1 Mounting Fixture on GL16 Interferometer
- Fixtures for MT-Style Ferrules with 12-Fiber and 16-Fiber Rows
- Fixtures for MPO Connectors with 12-Fiber and 16-Fiber Rows
These True Angle Connector Mounting Fixtures use high-accuracy guide pins machined into a precision aperture plate to hold the connectors in alignment during the interferometer scan. By using the plane perpendicular to center lines of the connector guide holes as a reference flat, very accurate measurements of the connector surface are possible. Four mounting fixture options are available: we offer a 12-fiber row and 16-fiber row MT-style ferrule mounts and 12-fiber and 16-fiber row MPO-style fixtures. The MPO-style fixtures can also be used with MTP connectors.
To insert the connector, slide it into the mount onto the guide pins using a motion similar to when two multi-fiber connectors are mated in a bulkhead or mating sleeve. Aperture plates with guide holes for mounting connectors with pins are available upon request; please contact Tech Support with inquiries.