 Products Home / Optical Fiber & Fiber Patch Cables / Single Mode Fiber Optic Patch Cables / AR-Coated Single Mode Fiber Optic Patch Cables
AR-Coated Single Mode Fiber Optic Patch Cables
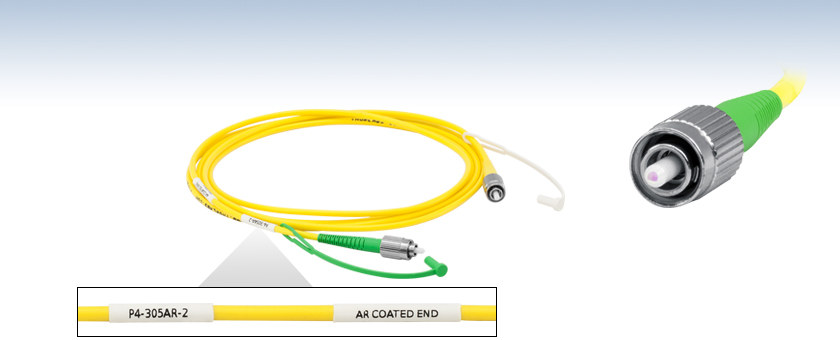
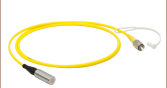
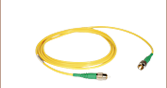
- One AR-Coated Connector for Fiber-to-Free Space Applications
- One Uncoated Connector for Fiber-to-Fiber Connections
- AR Coating Improves System Transmission and Reduces Back Reflections
- FC/PC and FC/APC Connectors Available
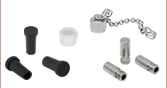
Coated End Labeled with
Part Number and AR Coating
Range for Easy Identification
P4-305AR-2
AR-Coated FC/APC Connector


Please Wait
| Item # Prefix |
AR-Coated Connector |
Uncoated Connector |
|---|---|---|
| P1 | FC/PC | FC/PC |
| P5 | FC/PC | FC/APC |
| P4 | FC/APC | FC/PC |
| P3 | FC/APC | FC/APC |
| Coated Patch Cables Selection Guide |
|---|
| Single Mode AR-Coated Patch Cables |
| TEC Single Mode AR-Coated Patch Cables |
| Polarization-Maintaining AR-Coated Patch Cables |
| Multimode AR-Coated Patch Cables |
| HR-Coated Patch Cables |
| Beamsplitter-Coated Patch Cables |
| Stock Single Mode Patch Cables Selection Guide | |
|---|---|
| Standard Cables | FC/PC to FC/PC |
| FC/APC to FC/APC | |
| Hybrid | |
| AR-Coated Patch Cables | |
| Thermally-Expanded-Core (TEC) Patch Cables | |
| HR-Coated Patch Cables | |
| Beamsplitter-Coated Patch Cables | |
| MIR Fluoride Fiber Patch Cables | |
Features
- One AR-Coated FC/PC or FC/APC Connector for Fiber-to-Free Space Use
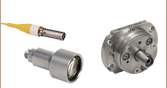
- Ideal for Use with Our Fiber Collimation Packages and FiberPorts to Minimize Fresnel Losses
- AR Coating Improves Return Loss
- One Uncoated FC/PC or FC/APC Connector for Fiber-to-Fiber Connection
Thorlabs offers patch cables with a single, antireflection-coated FC/PC or FC/APC connector on one side and an uncoated FC/PC or FC/APC connector on the other. The AR coating is designed to minimize reflections when either launching a free-space beam out of a fiber or coupling a free-space beam into a fiber. Depending on the cable selected, the coated connector provides an average reflectivity of <1%, <0.75% or <0.5% over the designated AR coating ranges (click on the AR Coating Reflectivity graphs in the tables below for more information). Each of these cables features Ø3 mm Kevlar reinforced furcation tubing. Each section of patch cables below is grouped by their best performance range, which is achieved where the specified operating wavelength ranges of the bare fiber and the AR coating overlap.
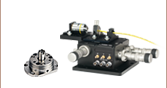
Fiber-to-Free Space Coupling
When coupling from a fiber into free space, such as when using one of our fiber collimators or FiberPort collimators/couplers, the return loss (absence of signals reflected back to the source by the glass-air interface at the end of the fiber) will be worse than comparable values for fiber-to-fiber coupling. By depositing an AR coating on the fiber end face, the return loss of an FC/PC connector can be improved by ~8 - 10 dB, and the return loss of an FC/APC connector can be improved by ~2 - 5 dB. For example, in our testing, a cable with an uncoated FC/PC connector has a typical return loss of ~15 dB (3.16%), while an AR-coated FC/PC connector with the same fiber has an improved return loss of ~24 dB (0.40%). AR-coated connectors also increase transmission when coupling a free-space beam into a fiber. For more testing data, please see the Lab Facts tab.
Note: The AR-coated end is meant for free-space applications (e.g., collimation) and will be damaged if it comes into contact with another connector tip. Mating two AR-coated connectors can increase back reflections, causing a greater loss of transmission than when just using two uncoated connectors.
There are several methods for cleaning an AR-coated connector end without damaging the coating. Gently spraying compressed air over the connector tip is ideal. Other methods include gently wiping using a lint-free optical cloth or FCC-7020 Fiber Connector Cleaner soaked with isopropanol or methanol. Dry wipes should not be used as this can damage the AR coating.
Custom-coated patch cables are also available. Contact Tech Support for more details. If you cannot find the appropriate stock patch cable your application requires, Thorlabs also offers custom-connectorized patch cables with same-day shipping.
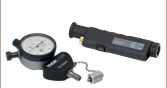
Figure 1: Measuring the Incident Optical Power
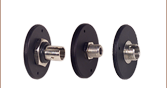
Figure 2: Measuring the Reflected Optical Power
Thorlabs Lab Fact: Fiber to Free Space Return Loss Comparison Test Data
In fiber-to-free-space and free-space-to-fiber applications, Fresnel reflections typically occur at the glass to air interface because of the index of refraction discontinuity. These reflections are specified as the return loss, or signals reflected back to the light source instead of exiting the fiber. For a standard, uncoated fiber, the reflectivity (or return loss expressed as a decimal) can be calculated using the following formula, assuming normal incidence:
![]()
where R is the reflectivity, n0 is the index of refraction of air (~1), and ns is the index of refraction of the fiber's silica core (~1.5). Using these typical values, an uncoated fiber will experience a typical reflectivity of approximately 4%. AR-coated cables use a dielectric stack antireflective coating on the fiber tip to minimize back reflections, thus lowering return loss and increasing transmission.
Experimental Setup
AR-coated and standard PM patch cables were tested for return loss in a fiber-to-free space application. First, the light source was connected to a 2x2 50:50 SM coupler, while the opposite legs of the coupler were connected to a power meter and terminator as shown in Figure 1. In this configuration the power meter measures the optical power in that leg of the coupler. Next, the cable's uncoated connector was connected to the coupler, and the coated connector was left unconnected and open to the air. The power meter was moved to the open leg on the light source side and used to measure the reflected power, as shown in Figure 2. Using this data and taking into account the insertion loss of the coupler, return loss in dB can be calculated:
Where RL is the return loss in dB or percent, Pi is the incident optical power measured in Figure 1, Pr is the reflected optical power measured in Figure 1, and ILc is the insertion loss of the coupler. Return loss in percent (reflectivity) can also be calculated:

Results
Both the AR-coated cables and the equivalent uncoated cables were tested in the same fashion, and the results are shown in the table to the right. The improvement in return loss when using AR-coated cables is apparent.
| Fiber-to-Free Space Return Loss Test Data | |||||
|---|---|---|---|---|---|
| Coated Cable Item # |
Coated Return Loss |
Coated Reflectivity (RL in %) |
Uncoated Cable Item # |
Uncoated Return Loss |
Uncoated Reflectivity (RL in %) |
| P1-305AR-2 | 22.4 dB | 0.57% | P1-305A-FC-2 | 15.6 dB | 2.7542% |
| P5-305AR-2 | 24.5 dB | 0.23% | P5-305A-PCAPC-1 | 15.3 dB | 2.95% |
| P4-305AR-2 | 37.4 dB | 0.018% | P5-305A-PCAPC-1 | 34.6 dB | 0.034% |
| P3-305AR-2 | 43 dB | 0.005% | P3-305A-FC-1 | 38.2 dB | 0.015% |
| P1-405AR-2 | 24.3 dB | 0.3715% | P1-405B-FC-2 | 15.01 dB | 3.155% |
| P5-405AR-2 | 28.1 dB | 0.154% | P5-405B-PCAPC-1 | 17.2 dB | 1.905% |
| P4-405AR-2 | 33.9 dB | 0.040% | P5-405B-PCAPC-1 | 26.2 dB | 0.2398% |
| P3-405AR-2 | 46.8 dB | 0.002% | P3-405B-FC-2 | 38.6 dB | 0.013% |
| P1-460AR-2 | 25.3 dB | 0.295% | P1-460B-FC-2 | 16.4 dB | 2.2908% |
| P5-460AR-2 | 27.6 dB | 0.173% | P5-460B-PCAPC-1 | 18.2 dB | 1.5135% |
| P4-460AR-2 | 33.5 dB | 0.044% | P5-460B-PCAPC-1 | 28.6 dB | 0.1380% |
| P3-460AR-2 | 47.3 dB | 0.001% | P3-460B-FC-2 | 38.2 dB | 0.015% |
| P1-630AR-2 | 24.1 dB | 0.3890% | P1-630A-FC-2 | 15.3 dB | 2.9512% |
| P5-630AR-2 | 24.2 dB | 0.3802% | P5-630A-PCAPC-2 | 15.6 dB | 2.7542% |
| P4-630AR-2 | 43.75 dB | 0.0042% | P4-630A-PCAPC-2 | 39.9 dB | 0.0102% |
| P3-630AR-2 | 61.0 dB | 0.0001% | P3-630A-FC-2 | 57.0 dB | 0.0002% |
| P1-780AR-2 | 22.0 dB | 0.6310% | P1-780A-FC-2 | 15.6 dB | 2.7542% |
| P5-780AR-2 | 30.0 dB | 0.1000% | P5-780A-PCAPC-2 | 17.0 dB | 1.9953% |
| P4-780AR-2 | 47.35 dB | 0.0018% | P5-780A-PCAPC-2 | 45.7 dB | 0.0027% |
| P3-780AR-2 | 56.5 dB | 0.0002% | P3-780A-FC-2 | 50.0 dB | 0.0010% |
| P1-980AR-2 | 27.1 dB | 0.1950% | P1-980A-FC-2 | 19.3 dB | 1.1749% |
| P5-980AR-2 | 27.0 dB | 0.1995% | P5-980A-PCAPC-2 | 20.5 dB | 0.8913% |
| P4-980AR-2 | 51.5 dB | 0.0007% | P5-980A-PCAPC-2 | 48.0 dB | 0.0016% |
| P3-980AR-2 | 57.5 dB | 0.0002% | P3-980A-FC-2 | 50.6 dB | 0.0009% |
| P1-SMF28EAR-2 | 23.6 dB | 0.4365% | P1-SMF28E-FC-2 | 14.6 dB | 3.4674% |
| P5-SMF28EAR-2 | 27.9 dB | 0.1622% | P5-SMF28E-FC-2 | 17.3 dB | 1.8621% |
| P4-SMF28EAR-2 | 39.7 dB | 0.0107% | P5-SMF28E-FC-2 | 39.1 dB | 0.0123% |
| P3-SMF28EAR-2 | 59.5 dB | 0.0001% | P3-SMF28E-FC-2 | 58.0 dB | 0.0002% |
| Quick Links |
|---|
| Damage at the Air / Glass Interface |
| Intrinsic Damage Threshold |
| Preparation and Handling of Optical Fibers |
Laser-Induced Damage in Silica Optical Fibers
The following tutorial details damage mechanisms relevant to unterminated (bare) fiber, terminated optical fiber, and other fiber components from laser light sources. These mechanisms include damage that occurs at the air / glass interface (when free-space coupling or when using connectors) and in the optical fiber itself. A fiber component, such as a bare fiber, patch cable, or fused coupler, may have multiple potential avenues for damage (e.g., connectors, fiber end faces, and the device itself). The maximum power that a fiber can handle will always be limited by the lowest limit of any of these damage mechanisms.
While the damage threshold can be estimated using scaling relations and general rules, absolute damage thresholds in optical fibers are very application dependent and user specific. Users can use this guide to estimate a safe power level that minimizes the risk of damage. Following all appropriate preparation and handling guidelines, users should be able to operate a fiber component up to the specified maximum power level; if no maximum is specified for a component, users should abide by the "practical safe level" described below for safe operation of the component. Factors that can reduce power handling and cause damage to a fiber component include, but are not limited to, misalignment during fiber coupling, contamination of the fiber end face, or imperfections in the fiber itself. For further discussion about an optical fiber’s power handling abilities for a specific application, please contact Thorlabs’ Tech Support.
Click to Enlarge
Undamaged Fiber End
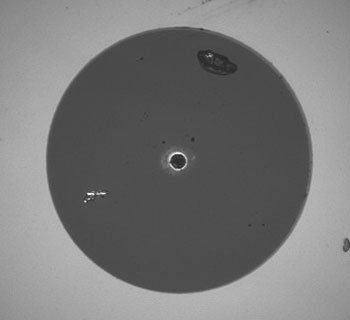
Click to Enlarge
Damaged Fiber End
Damage at the Air / Glass Interface
There are several potential damage mechanisms that can occur at the air / glass interface. Light is incident on this interface when free-space coupling or when two fibers are mated using optical connectors. High-intensity light can damage the end face leading to reduced power handling and permanent damage to the fiber. For fibers terminated with optical connectors where the connectors are fixed to the fiber ends using epoxy, the heat generated by high-intensity light can burn the epoxy and leave residues on the fiber facet directly in the beam path.
| Estimated Optical Power Densities on Air / Glass Interfacea | ||
|---|---|---|
| Type | Theoretical Damage Thresholdb | Practical Safe Levelc |
| CW (Average Power) |
~1 MW/cm2 | ~250 kW/cm2 |
| 10 ns Pulsed (Peak Power) |
~5 GW/cm2 | ~1 GW/cm2 |
Damage Mechanisms on the Bare Fiber End Face
Damage mechanisms on a fiber end face can be modeled similarly to bulk optics, and industry-standard damage thresholds for UV Fused Silica substrates can be applied to silica-based fiber. However, unlike bulk optics, the relevant surface areas and beam diameters involved at the air / glass interface of an optical fiber are very small, particularly for coupling into single mode (SM) fiber. therefore, for a given power density, the power incident on the fiber needs to be lower for a smaller beam diameter.
The table to the right lists two thresholds for optical power densities: a theoretical damage threshold and a "practical safe level". In general, the theoretical damage threshold represents the estimated maximum power density that can be incident on the fiber end face without risking damage with very good fiber end face and coupling conditions. The "practical safe level" power density represents minimal risk of fiber damage. Operating a fiber or component beyond the practical safe level is possible, but users must follow the appropriate handling instructions and verify performance at low powers prior to use.
Calculating the Effective Area for Single Mode Fibers
The effective area for single mode (SM) fiber is defined by the mode field diameter (MFD), which is the cross-sectional area through which light propagates in the fiber; this area includes the fiber core and also a portion of the cladding. To achieve good efficiency when coupling into a single mode fiber, the diameter of the input beam must match the MFD of the fiber.
As an example, SM400 single mode fiber has a mode field diameter (MFD) of ~Ø3 µm operating at 400 nm, while the MFD for SMF-28 Ultra single mode fiber operating at 1550 nm is Ø10.5 µm. The effective area for these fibers can be calculated as follows:
SM400 Fiber: Area = Pi x (MFD/2)2 = Pi x (1.5 µm)2 = 7.07 µm2 = 7.07 x 10⁻⁸ cm2
SMF-28 Ultra Fiber: Area = Pi x (MFD/2)2 = Pi x (5.25 µm)2 = 86.6 µm2 = 8.66 x 10⁻⁷ cm2
To estimate the power level that a fiber facet can handle, the power density is multiplied by the effective area. Please note that this calculation assumes a uniform intensity profile, but most laser beams exhibit a Gaussian-like shape within single mode fiber, resulting in a higher power density at the center of the beam compared to the edges. Therefore, these calculations will slightly overestimate the power corresponding to the damage threshold or the practical safe level. Using the estimated power densities assuming a CW light source, we can determine the corresponding power levels as:
SM400 Fiber: 7.07 x 10⁻⁸ cm2 x 1 MW/cm2 = 7.1 x 10⁻⁸ MW = 71 mW (Theoretical Damage Threshold)
7.07 x 10⁻⁸ cm2 x 250 kW/cm2 = 1.8 x 10⁻⁵ kW = 18 mW (Practical Safe Level)
SMF-28 Ultra Fiber: 8.66 x 10⁻⁷ cm2 x 1 MW/cm2 = 8.7 x 10⁻⁷ MW = 870 mW (Theoretical Damage Threshold)
8.66 x 10⁻⁷ cm2 x 250 kW/cm2 = 2.1 x 10⁻⁴ kW = 210 mW (Practical Safe Level)
Effective Area of Multimode Fibers
The effective area of a multimode (MM) fiber is defined by the core diameter, which is typically far larger than the MFD of an SM fiber. For optimal coupling, Thorlabs recommends focusing a beam to a spot roughly 70 - 80% of the core diameter. The larger effective area of MM fibers lowers the power density on the fiber end face, allowing higher optical powers (typically on the order of kilowatts) to be coupled into multimode fiber without damage.
Damage Mechanisms Related to Ferrule / Connector Termination
 Click to Enlarge
Plot showing approximate input power that can be incident on a single mode silica optical fiber with a termination. Each line shows the estimated power level due to a specific damage mechanism. The maximum power handling is limited by the lowest power level from all relevant damage mechanisms (indicated by a solid line).
Fibers terminated with optical connectors have additional power handling considerations. Fiber is typically terminated using epoxy to bond the fiber to a ceramic or steel ferrule. When light is coupled into the fiber through a connector, light that does not enter the core and propagate down the fiber is scattered into the outer layers of the fiber, into the ferrule, and the epoxy used to hold the fiber in the ferrule. If the light is intense enough, it can burn the epoxy, causing it to vaporize and deposit a residue on the face of the connector. This results in localized absorption sites on the fiber end face that reduce coupling efficiency and increase scattering, causing further damage.
For several reasons, epoxy-related damage is dependent on the wavelength. In general, light scatters more strongly at short wavelengths than at longer wavelengths. Misalignment when coupling is also more likely due to the small MFD of short-wavelength SM fiber that also produces more scattered light.
To minimize the risk of burning the epoxy, fiber connectors can be constructed to have an epoxy-free air gap between the optical fiber and ferrule near the fiber end face. Our high-power multimode fiber patch cables use connectors with this design feature.
Determining Power Handling with Multiple Damage Mechanisms
When fiber cables or components have multiple avenues for damage (e.g., fiber patch cables), the maximum power handling is always limited by the lowest damage threshold that is relevant to the fiber component. In general, this represents the highest input power that can be incident on the patch cable end face and not the coupled output power.
As an illustrative example, the graph to the right shows an estimate of the power handling limitations of a single mode fiber patch cable due to damage to the fiber end face and damage via an optical connector. The total input power handling of a terminated fiber at a given wavelength is limited by the lower of the two limitations at any given wavelength (indicated by the solid lines). A single mode fiber operating at around 488 nm is primarily limited by damage to the fiber end face (blue solid line), but fibers operating at 1550 nm are limited by damage to the optical connector (red solid line).
In the case of a multimode fiber, the effective mode area is defined by the core diameter, which is larger than the effective mode area for SM fiber. This results in a lower power density on the fiber end face and allows higher optical powers (on the order of kilowatts) to be coupled into the fiber without damage (not shown in graph). However, the damage limit of the ferrule / connector termination remains unchanged and as a result, the maximum power handling for a multimode fiber is limited by the ferrule and connector termination.
Please note that these are rough estimates of power levels where damage is very unlikely with proper handling and alignment procedures. It is worth noting that optical fibers are frequently used at power levels above those described here. However, these applications typically require expert users and testing at lower powers first to minimize risk of damage. Even still, optical fiber components should be considered a consumable lab supply if used at high power levels.
Intrinsic Damage Threshold
In addition to damage mechanisms at the air / glass interface, optical fibers also display power handling limitations due to damage mechanisms within the optical fiber itself. These limitations will affect all fiber components as they are intrinsic to the fiber itself. Two categories of damage within the fiber are damage from bend losses and damage from photodarkening.
Bend Losses
Bend losses occur when a fiber is bent to a point where light traveling in the core is incident on the core/cladding interface at an angle higher than the critical angle, making total internal reflection impossible. Under these circumstances, light escapes the fiber, often in a localized area. The light escaping the fiber typically has a high power density, which burns the fiber coating as well as any surrounding furcation tubing.
A special category of optical fiber, called double-clad fiber, can reduce the risk of bend-loss damage by allowing the fiber’s cladding (2nd layer) to also function as a waveguide in addition to the core. By making the critical angle of the cladding/coating interface higher than the critical angle of the core/clad interface, light that escapes the core is loosely confined within the cladding. It will then leak out over a distance of centimeters or meters instead of at one localized spot within the fiber, minimizing the risk of damage. Thorlabs manufactures and sells 0.22 NA double-clad multimode fiber, which boasts very high, megawatt range power handling.
Photodarkening
A second damage mechanism, called photodarkening or solarization, can occur in fibers used with ultraviolet or short-wavelength visible light, particularly those with germanium-doped cores. Fibers used at these wavelengths will experience increased attenuation over time. The mechanism that causes photodarkening is largely unknown, but several fiber designs have been developed to mitigate it. For example, fibers with a very low hydroxyl ion (OH) content have been found to resist photodarkening and using other dopants, such as fluorine, can also reduce photodarkening.
Even with the above strategies in place, all fibers eventually experience photodarkening when used with UV or short-wavelength light, and thus, fibers used at these wavelengths should be considered consumables.
Preparation and Handling of Optical Fibers
General Cleaning and Operation Guidelines
These general cleaning and operation guidelines are recommended for all fiber optic products. Users should still follow specific guidelines for an individual product as outlined in the support documentation or manual. Damage threshold calculations only apply when all appropriate cleaning and handling procedures are followed.
-
All light sources should be turned off prior to installing or integrating optical fibers (terminated or bare). This ensures that focused beams of light are not incident on fragile parts of the connector or fiber, which can possibly cause damage.
-
The power-handling capability of an optical fiber is directly linked to the quality of the fiber/connector end face. Always inspect the fiber end prior to connecting the fiber to an optical system. The fiber end face should be clean and clear of dirt and other contaminants that can cause scattering of coupled light. Bare fiber should be cleaved prior to use and users should inspect the fiber end to ensure a good quality cleave is achieved.
-
If an optical fiber is to be spliced into the optical system, users should first verify that the splice is of good quality at a low optical power prior to high-power use. Poor splice quality may increase light scattering at the splice interface, which can be a source of fiber damage.
-
Users should use low power when aligning the system and optimizing coupling; this minimizes exposure of other parts of the fiber (other than the core) to light. Damage from scattered light can occur if a high power beam is focused on the cladding, coating, or connector.
Tips for Using Fiber at Higher Optical Power
Optical fibers and fiber components should generally be operated within safe power level limits, but under ideal conditions (very good optical alignment and very clean optical end faces), the power handling of a fiber component may be increased. Users must verify the performance and stability of a fiber component within their system prior to increasing input or output power and follow all necessary safety and operation instructions. The tips below are useful suggestions when considering increasing optical power in an optical fiber or component.
-
Splicing a fiber component into a system using a fiber splicer can increase power handling as it minimizes possibility of air/fiber interface damage. Users should follow all appropriate guidelines to prepare and make a high-quality fiber splice. Poor splices can lead to scattering or regions of highly localized heat at the splice interface that can damage the fiber.
-
After connecting the fiber or component, the system should be tested and aligned using a light source at low power. The system power can be ramped up slowly to the desired output power while periodically verifying all components are properly aligned and that coupling efficiency is not changing with respect to optical launch power.
-
Bend losses that result from sharply bending a fiber can cause light to leak from the fiber in the stressed area. When operating at high power, the localized heating that can occur when a large amount of light escapes a small localized area (the stressed region) can damage the fiber. Avoid disturbing or accidently bending fibers during operation to minimize bend losses.
-
Users should always choose the appropriate optical fiber for a given application. For example, large-mode-area fibers are a good alternative to standard single mode fibers in high-power applications as they provide good beam quality with a larger MFD, decreasing the power density on the air/fiber interface.
-
Step-index silica single mode fibers are normally not used for ultraviolet light or high-peak-power pulsed applications due to the high spatial power densities associated with these applications.

Insights into Optical Fiber
Scroll down to read about:
- When does NA provide a good estimate of the fiber's acceptance angle?
- Why is MFD an important coupling parameter for single mode fibers?
- Does NA provide a good estimate of beam divergence from a single mode fiber?
Click here for more insights into lab practices and equipment.
When does NA provide a good estimate of the fiber's acceptance angle?

Click to Enlarge
Figure 1: Rays incident at angles ≤θmax will be captured by the cores of multimode fiber, since these rays experience total internal reflection at the interface between core and cladding.
Click to Enlarge
Figure 2: The behavior of the ray at the boundary between the core and cladding, which depends on their refractive indices, determines whether the ray incident on the end face is coupled into the core. The equation for NA can be found using geometry and the two equations noted at the top of this figure.
Numerical aperture (NA) provides a good estimate of the maximum acceptance angle for most multimode fibers, as shown in Figure 1. This relationship should not be used for single mode fibers.
NA and Acceptance Angle
Incident light is modeled as rays to obtain the relationship between NA and the maximum acceptance angle (θmax ), which describes the fiber's ability to gather light from off-axis sources. The equation at the top of Figure 1 can be used to determine whether rays traced from different light sources will be coupled into the fiber's core.
Rays with an angle of incidence ≤θmax are totally internally reflected (TIR) at the boundary between the fiber's core and cladding. As these rays propagate down the fiber, they remain trapped in the core.
Rays with angles of incidence larger than θmax refract at the interface between core and cladding, and this light is eventually lost from the fiber.
Geometry Defines the Relationship
The relationship among NA, θmax , and the refractive indices of the core and cladding, ncore and nclad , respectively, can be found using the geometry diagrammed in Figure 2. This geometry illustrates the most extreme conditions under which TIR will occur at the boundary between the core and cladding.
The equations at the top of Figure 2 are expressions of Snell's law and describe the rays' behavior at both interfaces. Note that the simplification sin(90°) = 1 has been used. Only the indices of the core and cladding limit the value of θmax .
Angles of Incidence and Fiber Modes
When the angle of incidence is ≤θmax , the incident light ray is coupled into one of the multimode fiber's guided modes. Generally speaking, the lower the angle of incidence, the lower the order of the excited fiber mode. Lower-order modes concentrate most of their intensity near the center of the core. The lowest order mode is excited by rays incident normally on the end face.
Single Mode Fibers are Different
In the case of single mode fibers, the ray model in Figure 2 is not useful, and the calculated NA (acceptance angle) does not equal the maximum angle of incidence or describe the fiber's light gathering ability.
Single mode fibers have only one guided mode, the lowest order mode, which is excited by rays with 0° angles of incidence. However, calculating the NA results in a nonzero value. The ray model also does not accurately predict the divergence angles of the light beams successfully coupled into and emitted from single mode fibers. The beam divergence occurs due to diffraction effects, which are not taken into account by the ray model but can be described using the wave optics model. The Gaussian beam propagation model can be used to calculate beam divergence with high accuracy.
Date of Last Edit: Jan. 20, 2020
Why is MFD an important coupling parameter for single mode fibers?
Click to Enlarge
Figure 3 For maximum coupling efficiency into single mode fibers, the light should be an on-axis Gaussian beam with its waist located at the fiber's end face, and the waist diameter should equal the MFD. The beam output by the fiber also resembles a Gaussian with these characteristics. In the case of single mode fibers, the ray optics model and NA are inadequate for determining coupling conditions. The mode intensity (I ) profile across the radius ( ρ ) is illustrated.
As light propagates down a single mode fiber, the beam maintains a cross sectional profile that is nearly Gaussian in shape. The mode field diameter (MFD) describes the width of this intensity profile. The better an incident beam matches this intensity profile, the larger the fraction of light coupled into the fiber. An incident Gaussian beam with a beam waist equal to the MFD can achieve particularly high coupling efficiency.
Using the MFD as the beam waist in the Gaussian beam propagation model can provide highly accurate incident beam parameters, as well as the output beam's divergence.
Determining Coupling Requirements
A benefit of optical fibers is that light carried by the fibers' guided mode(s) does not spread out radially and is minimally attenuated as it propagates. Coupling light into one of a fiber's guided modes requires matching the characteristics of the incident light to those of the mode. Light that is not coupled into a guided mode radiates out of the fiber and is lost. This light is said to leak out of the fiber.
Single mode fibers have one guided mode, and wave optics analysis reveals the mode to be described by a Bessel function. The amplitude profiles of Gaussian and Bessel functions closely resemble one another, which is convenient since using a Gaussian function as a substitute simplifies the modeling the fiber's mode while providing accurate results (Kowalevicz).
Figure 3 illustrates the single mode fiber's mode intensity cross section, which the incident light must match in order to couple into the guided mode. The intensity (I ) profile is a near-Gaussian function of radial distance ( ρ ). The MFD, which is constant along the fiber's length, is the width measured at an intensity equal to the product of e-2 and the peak intensity. The MFD encloses ~86% of the beam's power.
Since lasers emitting only the lowest-order transverse mode provide Gaussian beams, this laser light can be efficiently coupled into single mode fibers.
Coupling Light into the Single Mode Fiber
To efficiently couple light into the core of a single-mode fiber, the waist of the incident Gaussian beam should be located at the fiber's end face. The intensity profile of the beam's waist should overlap and match the characteristics of the mode intensity cross section. The required incident beam parameters can be calculated using the fiber's MFD with the Gaussian beam propagation model.
The coupling efficiency will be reduced if the beam waist is a different diameter than the MFD, the cross-sectional profile of the beam is distorted or shifted with respect to the modal spot at the end face, and / or if the light is not directed along the fiber's axis.
References
Kowalevicz A and Bucholtz F, "Beam Divergence from an SMF-28 Optical Fiber (NRL/MR/5650--06-8996)." Naval Research Laboratory, 2006.
Date of Last Edit: Feb. 28, 2020
Why is MFD an important coupling parameter for single mode fibers?
Significant error can result when the numerical aperture (NA) is used to estimate the cone of light emitted from, or that can be coupled into, a single mode fiber. A better estimate is obtained using the Gaussian beam propagation model to calculate the divergence angle. This model allows the divergence angle to be calculated for whatever beam spot size best suits the application.
Since the mode field diameter (MFD) specified for single mode optical fibers encloses ~86% of the beam power, this definition of spot size is often appropriate when collimating light from and focusing light into a single mode fiber. In this case, to a first approximation and when measured in the far field,
 , , |
(1) |
is the divergence or acceptance angle (θSM ), in radians. This is half the full angular extent of the beam, it is wavelength  )
)
| Rayleigh Range: | ||
 |
||
| Beam Radius at Distance z: | ||
 |
||
|
Figure 4: These curves illustrate the consequence of using NA to calculate the divergence (θSM ) of light output from a single mode fiber. Significant error in beam spot diameter can be avoided by using the Gaussian beam propagation model. This plot models a beam from SM980-5.8-125. The values used for NA and MFD were 0.13 and 6.4 µm, respectively. The operating wavelength was 980 nm, and the Rayleigh range was 32.8 µm. |
||
Gaussian Beam Approach
Although a diverging cone of light is emitted from the end face of a single mode optical fiber, this light does not behave as multiple rays travelling at different angles to the fiber's axis.
Instead, this light resembles and can be modeled as a single Gaussian beam. The emitted light propagates similarly to a Gaussian beam since the guided fiber mode that carried the light has near-Gaussian characteristics.
The divergence angle of a Gaussian beam can differ substantially from the angle calculated by assuming the light behaves as rays. Using the ray model, the divergence angle would equal sin-1(NA). However, the relationship between NA and divergence angle is only valid for highly multimode fibers.
Figure 4 illustrates that using the NA to estimate the divergence angle can result in significant error. In this case, the divergence angle was needed for a point on the circle enclosing 86% of the beam's optical power. The intensity of a point on this circle is a factor of 1/e2 lower than the peak intensity.
The equations to the right of the plot in Figure 4 were used to accurately model the divergence of the beam emitted from the single mode fiber's end face. The values used to complete the calculations, including the fiber's MFD, NA, and operating wavelength are given in the figure's caption. This rate of beam divergence assumes a beam size defined by the 1/e2 radius, is nonlinear for distances z < zR, and is approximately linear in the far field (z >> zR).
The angles noted on the plot were calculated from each curve's respective slope. When the far field approximation given by Equation (1) is used, the calculated divergence angle is 0.098 radians (5.61°).
References
Kowalevicz A and Bucholtz F, "Beam Divergence from an SMF-28 Optical Fiber (NRL/MR/5650--06-8996)." Naval Research Laboratory, 2006.
Date of Last Edit: Feb. 28, 2020
Content improved by our readers!
| Posted Comments: | |
user
(posted 2023-11-15 19:00:54.91) Can you please provide the raw data for the typical AR reflection values vs wavelength of the Px-SMF28EAR-2 coords?
Thank you! jpolaris
(posted 2023-11-30 01:20:14.0) Thank you for contacting Thorlabs. Requests for additional data and specifications and can be made by contacting our technical support team that is local to your region. Our various contacts can be found here: https://www.thorlabs.com/supportcontact.cfm. I have reached out to you directly regarding your request for the raw reflectance data for our Px-SMF28EAR-2 patch cables. s.marschall
(posted 2018-12-03 12:09:27.493) Are the overall specifications of the patch cable the same as those of the SM-fiber patch cables without coating?
Specifically, are the losses when mating the uncoated FC/APC connector to another fiber the same as when using a P3-780A-FC-2? YLohia
(posted 2018-12-03 09:30:05.0) Hello, thank you for contacting Thorlabs. The AR coating is designed for minimum reflection for an air-glass interface. If you mate fibers together, the interface is glass-glass, so technically there is no index change and an AR coating is not needed. The AR-coated end should not be mated to a fiber-coupled light source or to another cable via a mating sleeve. Doing so will physically damage the AR coating.
FC connectors are in contact with one another when mated and the spring action in the connector keeps the fibers from crushing each other. SMA connectors, however, do not have spring action, so the mating sleeves are designed to always impose some kind of air gap between the fibers. In this case, using AR fibers would be okay. uqmalmei
(posted 2018-01-08 17:15:44.397) Would be possible to buy fibres with both ends AR-coated?
Cheers, Marcelo. nbayconich
(posted 2018-02-20 05:18:02.0) Thank you for contacting Thorlabs. We can provide both ends AR coated. I'll reach out to you directly with more information our custom capabilities. tmayer
(posted 2015-05-21 09:41:40.857) Is it possible to get this fiber with a length of 4 or 5 meters? besembeson
(posted 2015-08-19 08:53:13.0) Response from Bweh at Thorlabs USA: Yes this is possible. We will followup with you for a quotation. ilovecrazydog
(posted 2013-09-27 10:01:31.977) I am concerned about damage threshold of AR coated patch cables, especially in UV to visible range.
Do you have any reference value? tcohen
(posted 2013-10-03 16:19:00.0) Response from Tim at Thorlabs: The damage of these patch cables should still be limited by the power handling of the fiber itself. 10mW/um^2 would be an approximate threshold for these fibers and so depending on your core size, power handling will vary. As with all damage threshold considerations, avoiding defect precursors such as contamination/scratches is important to achieve this number. With fiber, it is also beneficial to improve your coupling efficiency before raising the power. user
(posted 2013-05-15 18:03:30.143) Thorlabs, Would it not make more sense to have the AR end flat polished instead of PC? This is, for me at least, only for fiber to freespace, so the curvature at the AR end only adds spherical aberation to my beam, and contributes nothing of value. Flat polish would be more useful. tcohen
(posted 2013-05-23 13:38:00.0) Response from Tim at Thorlabs: Thank you for your feedback. Currently, we use the same FC/PC connectors as our standard patch cables. These are pre-radiused which ensures that when two connectors are mated, the fiber cores are touching, minimizing insertion loss. These cables with pre-radiused FC/PC connectors have been tested to improve RL. We will also look into whether these cables, where the end face is not going to be mated, would be beneficial to have a flat polish. Thank you for sharing your suggestion. mbakker
(posted 2013-05-08 08:59:21.277) Would it be possible to have AR at both ends of the fiber as well? Why is this not a standard option? jlow
(posted 2013-05-08 09:27:00.0) Response from Jeremy at Thorlabs: The AR coated patch cables are typically used in applications where one end is in physical contact with another fiber. Having an AR coating on that surface would degrade the performance because the AR coating is optimized for fiber/air interface. We can have both ends AR coated for you if needed. We will get in contact with you directly to discuss further about this. bdada
(posted 2011-10-25 23:37:00.0) Response from Buki at Thorlabs:
Thank you for using our Web Feedback tool. We do not currently offer reflective coatings on our fiber. We will contact you to discuss your application and see how we can be of further assistance. jikim
(posted 2011-10-22 15:39:50.0) Could you offer a fiber with 50 % reflection coating instead of AR coating? If you could, I would like to ask you a quotation for a 1 m long fiber patch cable with SMF-28e+, FC/PC (R = 50 %) to FC/APC (no coating) for 1550 nm. bdada
(posted 2011-09-20 12:57:00.0) Response from Buki at Thorlabs:
Thank you for your feedback. We will act on your suggestion immediately and will provide this service soon. We will contact you with more information shortly. georg.simmerle
(posted 2011-09-20 13:58:25.0) Would it be possible to get the AR coating service for SM fibers (SM450 to SM980) as well?
Thank you. Georg user
(posted 2010-08-23 15:36:57.0) A reply from Jens at Thorlabs: yes, this can be done. We will contact you with price and lead time information. Adam
(posted 2010-04-16 13:20:01.0) A response from Adam at THorlabs to carlsonrt: We can offer the fiber you are looking for. I would like to contact you directly to get more information about your application and the exact requirements for this patch cable. carlsonrt
(posted 2010-04-16 11:19:35.0) I would like a quote for price and delivery on fiber patchcord of this type, but made with 1550 PMF instead of SMF28 fiber:
Qty 2-5
Length: 1 meter
1550-PM fiber
One end: FC/PC with 1550 ARC
Other end: FC/APC uncoated
Thank you Tyler
(posted 2008-06-26 16:55:25.0) A response from Tyler at Thorlabs to lance: The operating temperature range of the
P1-SMF28-FC-1-15 is -60°C to 85°C. The return loss is wavelength dependent. The reflectivity plot specifies the reflectivity at 1550 nm as 0.22%, which corresponds to a return loss of 26.6dB at 1550nm assuming a fiber to air interface. Since the reflectivity plot is typical, there could be some variation from fiber to fiber. Finally, maximum laser power at 1550nm is not a specification that I can provide. Silica has a damage threshold somewhere around 1MW/cm², which means if the MFD of the fiber is ~10µm it would take less than 1W to damage the fiber. lance
(posted 2008-06-10 13:52:06.0) What is the operating temperature range?
What is the return loss at 1550 nm?
What is the maximum laser power at 1550 nm? |
| Item # | AR-Coated Connector | Uncoated Connector | AR Coating | AR Coating Reflectivity | Jacket |
|---|---|---|---|---|---|
| P1-305AR-2 | FC/PC (30126C3)a | FC/PC (30126C3) | Ravg < 1% for 300 - 510 nm | Ø3 mm Yellow PVC Furcation Tubing |
|
| P5-305AR-2 | FC/PC (30126C3)a | FC/APC (30126A3) | |||
| P4-305AR-2 | FC/APC (30126A3) | FC/PC (30126C3) | |||
| P3-305AR-2 | FC/APC (30126A3) | FC/APC (30126A3) |
| Fiber Type |
Bare Fiber Wavelength Range |
Cutoff Wavelength |
MFDb | Cladding Diameter |
Coating Diameter |
Max Attenuationc | NA | Length |
|---|---|---|---|---|---|---|---|---|
| SM300 | 320 - 430 nm | ≤310 nm | 2.0 - 2.4 µm @ 350 nm | 125 ± 1.0 µm | 245 ± 15 µm | ≤70 dB/km @ 350 nm | 0.12 - 0.14 | 2 m |
| Item # | AR-Coated Connector | Uncoated Connector | AR Coating | AR Coating Reflectivity | Jacket |
|---|---|---|---|---|---|
| P1-405AR-2 | FC/PC (30126C3)a | FC/PC (30126C3) | Ravg < 0.75% for 400 - 700 nm | Ø3 mm Yellow PVC Furcation Tubing |
|
| P5-405AR-2 | FC/PC (30126C3)a | FC/APC (30126A3) | |||
| P4-405AR-2 | FC/APC (30126A3) | FC/PC (30126C3) | |||
| P3-405AR-2 | FC/APC (30126A3) | FC/APC (30126A3) |
| Fiber Type |
Bare Fiber Wavelength Range |
Cutoff Wavelength |
MFDb | Cladding Diameter |
Coating Diameter |
Max Attenuationc | NA | Length |
|---|---|---|---|---|---|---|---|---|
| SM400 | 405 - 532 nm | 305 - 400 nm | 2.5 - 3.4 µm @ 480 nm | 125 ± 1.0 µm | 245 ± 15 µm | ≤50 dB/km @ 430 nm ≤30 dB/km @ 532 nm |
0.12 - 0.14 | 2 m |
| Item # | AR-Coated Connector | Uncoated Connector | AR Coating | AR Coating Reflectivity | Jacket |
|---|---|---|---|---|---|
| P1-460AR-2 | FC/PC (30126C3)a | FC/PC (30126C3) | Ravg < 0.75% for 400 - 700 nm | Ø3 mm Yellow PVC Furcation Tubing |
|
| P5-460AR-2 | FC/PC (30126C3)a | FC/APC (30126A3) | |||
| P4-460AR-2 | FC/APC (30126A3) | FC/PC (30126C3) | |||
| P3-460AR-2 | FC/APC (30126A3) | FC/APC (30126A3) |
| Fiber Type |
Bare Fiber Wavelength Rangeb |
Cutoff Wavelength |
MFDc | Cladding Diameter |
Coating Diameter |
Max Attenuationd,e | NA | Length |
|---|---|---|---|---|---|---|---|---|
| SM450 | 488 - 633 nm | 350 - 470 nm | 2.8 - 4.1 µm @ 488 nm | 125 ± 1.0 µm | 245 ± 15 µm | ≤50 dB/km @ 488 nm | 0.10 - 0.14 | 2 m |
| Item # | AR-Coated Connector | Uncoated Connector | AR Coating | AR Coating Reflectivity | Jacket |
|---|---|---|---|---|---|
| P1-630AR-2 | FC/PC (30126C3)a | FC/PC (30126C3) | Ravg < 0.5% for 500 - 800 nm | Ø3 mm Yellow PVC Furcation Tubing |
|
| P5-630AR-2 | FC/PC (30126C3)a | FC/APC (30126A3) | |||
| P4-630AR-2 | FC/APC (30126A3) | FC/PC (30126C3) | |||
| P3-630AR-2 | FC/APC (30126A3) | FC/APC (30126A3) |
| Fiber Type |
Bare Fiber Wavelength Rangeb |
Cutoff Wavelength |
MFDc | Cladding Diameter |
Coating Diameter |
Max Attenuationd |
NA | Length |
|---|---|---|---|---|---|---|---|---|
| SM600 | 633 - 780 nm | 500 - 600 nm | 3.6 - 5.3 µm @ 633 nm | 125 ± 1.0 µm | 245 ± 15 µm | ≤15 dB/km | 0.10 - 0.14 | 2 m |
| Item # | AR-Coated Connector | Uncoated Connector | AR Coating | AR Coating Reflectivity | Jacket |
|---|---|---|---|---|---|
| P1-780AR-2 | FC/PC (30126C3)a | FC/PC (30126C3) | Ravg < 0.5% for 650 - 1050 nm | Ø3 mm Yellow PVC Furcation Tubing |
|
| P5-780AR-2 | FC/PC (30126C3)a | FC/APC (30126A3) | |||
| P4-780AR-2 | FC/APC (30126A3) | FC/PC (30126C3) | |||
| P3-780AR-2 | FC/APC (30126A3) | FC/APC (30126A3) |
| Fiber Type |
Bare Fiber Wavelength Range |
Cutoff Wavelength |
MFDb | Cladding Diameter |
Coating Diameter |
Max Attenuationc |
NA | Length |
|---|---|---|---|---|---|---|---|---|
| 780HP | 780 - 970 nm | 730 ± 30 nm | 5.0 ± 0.5 µm @ 850 nm | 125 ± 1 µm | 245 ± 15 µm | <3.5 dB/km @ 850 nm | 0.13 | 2 m |
| Item # | AR-Coated Connector | Uncoated Connector | AR Coating | AR Coating Reflectivity | Jacket |
|---|---|---|---|---|---|
| P1-980AR-2 | FC/PC (30126C3)a | FC/PC (30126C3) | Ravg < 0.5% for 850 - 1250 nm | Ø3 mm Yellow PVC Furcation Tubing |
|
| P5-980AR-2 | FC/PC (30126C3)a | FC/APC (30126A3) | |||
| P4-980AR-2 | FC/APC (30126A3) | FC/PC (30126C3) | |||
| P3-980AR-2 | FC/APC (30126A3) | FC/APC (30126A3) |
| Fiber Type |
Bare Fiber Wavelength Range |
Cutoff Wavelength |
MFDb | Cladding Diameter |
Coating Diameter |
Max Attenuationc,d |
NA | Length |
|---|---|---|---|---|---|---|---|---|
| SM980-5.8-125 | 980 - 1550 nm | 870 - 970 nm | 5.3 - 6.4 µm @ 980 nm | 125 ± 1.0 µm | 245 ± 15 µm | ≤2.0 dB/km | 0.13 - 0.15 | 2 m |
| Item # | AR-Coated Connector | Uncoated Connector | AR Coating | AR Coating Reflectivity | Jacket |
|---|---|---|---|---|---|
| P1-SMF28EAR-2 | FC/PC (30126C3)a | FC/PC (30126C3) | Ravg < 0.5% for 1050 - 1620 nm | Ø3 mm Yellow PVC Furcation Tubing |
|
| P5-SMF28EAR-2 | FC/PC (30126C3)a | FC/APC (30126A3) | |||
| P4-SMF28EAR-2 | FC/APC (30126A3) | FC/PC (30126C3) | |||
| P3-SMF28EAR-2 | FC/APC (30126A3) | FC/APC (30126A3) |
| Fiber Type |
Bare Fiber Wavelength Range |
Cutoff Wavelength |
MFDb | Cladding Diameter |
Coating Diameter |
Max Attenuationc |
NA | Length |
|---|---|---|---|---|---|---|---|---|
| SMF-28 Ultra | 1260 - 1625 nm | <1260 nm | 9.2 ± 0.4 µm @ 1310 nm 10.4 ± 0.5 µm @ 1550 nm |
125 ± 0.7 µm | 242 ± 5 µm | ≤0.32 dB/km @ 1310 nm ≤0.18 dB/km @ 1550 nm |
0.14 | 2 m |
| Item # | AR-Coated Connector | Uncoated Connector | AR Coating | AR Coating Reflectivity | Jacket |
|---|---|---|---|---|---|
| P1-2000AR-2 | FC/PC (30126C3)a | FC/PC (30126C3) | Ravg < 0.5% for 1700 - 2100 nm | Ø3 mm Yellow PVC Furcation Tubing |
|
| P5-2000AR-2 | FC/PC (30126C3)a | FC/APC (30126A3) | |||
| P4-2000AR-2 | FC/APC (30126A3) | FC/PC (30126C3) |
| Fiber Type |
Bare Fiber Wavelength Range |
Cutoff Wavelength |
MFDb | Cladding Diameter |
Coating Diameter |
Typical Attenuationc | NA | Length |
|---|---|---|---|---|---|---|---|---|
| SM2000 | 1700 - 2300 nm | 1750 ± 50 nm | 13 ± 1 µm @ 1996 nm | 125 ± 1 µm | 245 ± 10 µm | 20 dB/km (0.02 dB/m) @ 1.9 µm 250 dB/km (0.25 dB/m) @ 2.3 µm |
0.12 ± 0.01 | 2 m |