 Products Home / Imaging Systems / OCT Imaging Systems & Components / Application Articles / OCT Studies Cortical Microvasculature
OCT Studies Cortical Microvasculature

Please Wait
Spectral Domain OCT Employed to Study Cortical Microvasculature
Featured Researchers:
V. J. Srinivasan, J. Y. Jiang, M. A. Yaseen, H. Radhakrishnan, W. Wu, S. Barry, A. E. Cable, and D. A. Boas
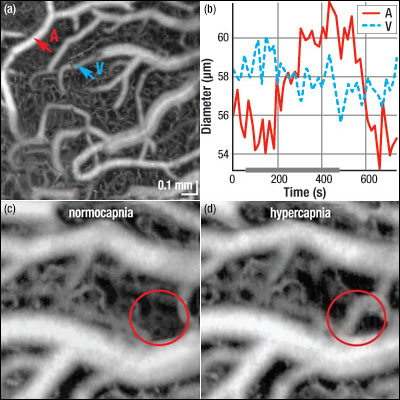 Figure 1.1 Effects of Excessive CO2 Levels on Blood Flow (a) Spectral Domain OCT images of the cerebral cortex of a rat obtained during normocapnia. An artery (A) and vein (V) are indicated. (b) Surface vasculature diameters for the artery and vein indicated in (a) were monitored as a function of time before, during, and after 7.5% hypercapnia. The hypercapnia timeframe is indicated by the solid gray line along the time axis. (c) OCT angiogram obtained during normocapnia. (d) OCT angiogram obtained during hypercapnia shows perfusion of the arterial anastomosis. Rapid, volumetric imaging of cortical vasculature is essential for providing qualitative information concerning blood flow to specific organs such as the brain. Such knowledge is applicable to studies of cerebrovascular reactivity and stroke models. Recently, a collaborative group of researchers1 used a Spectral Domain Optical Coherence Tomography (OCT) system to obtain high-resolution, real-time images of cortical vasculature in rats by monitoring intrinsic scattering contrast. In preparation for the experiment, the cerebral cortex of a previously immobilized and anesthetized rat was exposed and fitted with a cranial window. Then, a custom Thorlabs Spectral Domain OCT system (source specifications: 1310 nm central wavelength, 16 mW output power, 170 nm FWHM spectral bandwidth) was used to obtain high resolution, real-time, in vivo, volumetric images of the exposed cortical vasculature both before and during inhalation of carbon dioxide (see Figure 1.1). The axial resolution of the system in air (tissue) is 4.7 μm (3.5 μm). Figure 1.1 (a) shows the baseline OCT angiogram obtained with normal arterial carbon dioxide pressure (i.e., normocapnia). Vasculature down to an imaging depth of 330 μm is resolved. Carbon dioxide levels in the blood were increased during a 7 minute interval via inhalation of a breathing mixture containing 7.5% CO2. Changes in vein and artery diameters were monitored prior to, during, and post hypercapnia; the results are shown in Figure 1.1 (b). By comparing Figure 1.1 (c) and (d), which were taken during normocapnia and hypercapnia, respectively, it can be seen that the circled arterial anastomosis becomes perfused as a result of the increased levels of carbon dioxide in the blood. Using this Spectral Domain OCT system, Srinivasan et al. obtain a single volumetric angiogram, which provides a comprehensive image of the uppermost layers of the cortex, in approximately 12 seconds. Comparison of angiograms obtained before and during hypercapnia provides quantitative measurements of vessel tone and qualitative information on perfusion. This study shows that OCT is capable of monitoring the redistribution of blood flow that occurs during hypercapnia, and thus, this imaging modality holds promise for use in future stroke studies.
|
All procedures were approved by the animal care committee at Massachusetts General Hospital.
Reference:
V. J. Srinivasan,* J. Y. Jiang,† M. A. Yaseen,* H. Radhakrishnan,* W .Wu,* S. Barry,† A. E. Cable,† and D. A. Boas,* Opt. Letts 35, 43 (2010).
*Photon Migration Imaging Laboratory, MGH/MIT/HMS Athinoula A. Martinos Center for Biomedical Imaging, Massachusetts General Hospital/Harvard Medical School, Charlestown, Massachusetts 02129, USA
†Thorlabs, Inc., Newton, New Jersey 07860, USA
| Posted Comments: | |
| No Comments Posted |