 Products Home


The Need for Optical Tables
In research and application laboratories, it is often necessary to conduct experiments or take measurements in a vibration-free environment. However, sources of vibration such as air conditioners, heat pumps, and road and rail transportation systems contribute to a largely unavoidable vibrational background noise that is coupled to the surrounding environment. Optical systems comprised from multiple components that must be individually mounted and aligned in a precise and rigid fashion are particularly vulnerable to vibration-induced performance degradation.
Many types of experiments are severely hampered, or even made impossible, by small vibrations. For example, many laser applications require a beam waist of a few microns; if the position of this spot is critical to system performance (e.g., using an ion laser to pump a jet stream dye laser), then vibrations with amplitudes in the micron range will inevitably cause experimental failure. Since visible light has sub-micron wavelengths, interferometry-based experiments (including holography) may also be impossible to perform in the presence of vibrations, even if they are sub-micron in amplitude. Optical and/or mechanical machining or probing of semiconductor wafers requires similar stability. Finally, if an experiment utilizes mechanical elements that move or vibrate, it is often necessary to vibrationally isolate these components from all other critically aligned optical elements.
Click for Details
Figure 1: Optical Table Supported on Vibration Isolation Supports
Properties of an Optical Table
To be useful, the surface on which an optical system is mounted (such as that seen in Figure 1) must satisfy several basic requirements. First, it must provide a rigid base on which optics can be mounted and aligned reliably with long-term stability and no inherent vibrational resonances. It must not only successfully damp any vibrations caused by motorized or moving parts in the experiment, preventing these vibrations from influencing critical optical elements, but also isolate the experiment as a whole from ambient background laboratory vibrations.
If these criteria are not met, undesirable effects will likely result. An individual component, or the system as a whole, may not function properly. Valuable data may be buried in random noise, or data may be totally misunderstood and incorrectly evaluated due to vibrationally induced noise. In the latter case, poor data can lead to frustration, hinder timely progress, and consume resources, which is particularly costly when the system is a laboratory prototype of a production assembly.
In an effort to prevent these undesirable effects, various designs of optical tables and optical breadboards have been developed. Ideally, an optical table should maintain a rigid and flat upper surface without being overly massive. The table is then mounted seismically, usually on air springs, to prevent the coupling of ambient background vibration. In the past, tabletops have been constructed from granite, concrete, wood, steel, and a variety of unusual composite structures in attempts to improve performance while keeping weight at an acceptable level. Although each of these materials was found to have advantages and disadvantages, the best overall performance was achieved using a composite construction technique. Consequently, a clad metal honeycomb sandwiched between two flat plates (as seen in Figure 2) is now generally accepted as the best material for optical tabletop and optical breadboard construction.
Click to Enlarge
Figure 2: Nexus Table / Breadboard Cross Section, Showing the (1) Top Skin, (2) Bottom Skin, (3) Side Finishing Trim, (4) Side Panels, and (5) Honeycomb Core
Vibration Isolation
Vibration isolation supports and vibration isolation frames are designed to isolate optical tables and breadboards from ambient vibrations in the building, which are typically in the range of 4 to 100 Hz. Since large frequency differences preclude energy transfer from one form into another, Thorlabs specifically designs its tabletops such that their resonant frequencies are well above 100 Hz; by creating such a large resonant frequency difference, energy coupling cannot occur between the tabletop and its support system.
As with any other high performance product, optical table development and design are ongoing processes with new technology and ideas being incorporated continually to enhance performance characteristics. Thorlabs' table design has focused on three areas of development:
- Improving the Performance of our Tables by Using a Proprietary Damping Technology
- Developing a Cost-Effective Table Whose Performance Well Exceeds that Necessary for Most Applications
- Addressing the Often Overlooked Issue of Providing Vibration Isolation Supports with Horizontal Isolation
As a result of these efforts, Thorlabs is pleased to offer our Nexus® line of optical tables and breadboards. Tables are available in 210 mm, 310 mm, or 460 mm thicknesses, while breadboards are available in 60 mm or 110 mm thick versions. For unique needs, Thorlabs manufacturing facilities can produce custom optical tables as well. Each tabletop can be paired with one of the following support structures, depending on the level of isolation needed for a given experiment: rigid non-isolating supports, passive air-spring isolators, or active self-leveling isolators.
Most commercially produced active isolation mounting systems for optical tables directly damp vertical motion by separating two air reservoirs by an aperture. This will also damp horizontal vibrations, but only through the relatively ineffective coupling of the horizontal vibrations to the vertical modes of the dual-air-reservoir damping mechanism. This results in inefficient second order horizontal damping. Thorlabs' horizontally enhanced active isolators incorporate a long pendulum mechanism that has been designed specifically to produce direct horizontal damping.
Click to Enlarge
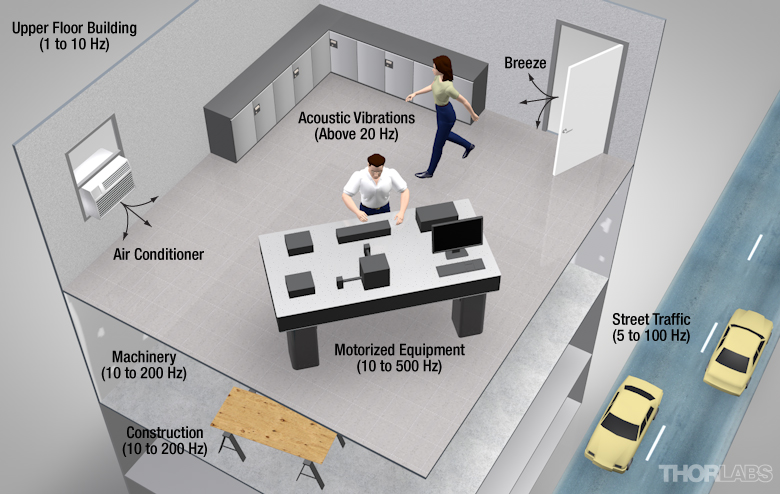
Figure 1: Common Vibration Sources in the Laboratory
Sources of Vibration
Vibration, which is commonly referred to as noise, can be divided into three main categories: seismic (ground) vibrations, acoustic vibrations, and forces applied directly to the load on the working surface. Seismic vibrations include all sources that make the floor under the experimental setup vibrate. Some common seismic vibration sources are foot traffic, vehicular traffic, wind blowing the building, and building ventilation fans.
Many of the sources that generate seismic vibrations also generate acoustic vibrations. The difference is that acoustic vibrations are a measure of the effect of air pressure variations on the experiment.
The final contributor to vibration is forces applied directly to the load on the working surface; these are vibration sources that are directly coupled mechanically to the experimental setup but not transmitted through the table supports. Examples include vibrations resulting from a moving translation stage with a sample on top of it or the vibrations transmitted to the working surface via vacuum system tubing.
Vibration Characteristics
Vibrations can be classified as either random or periodic. Periodic noise can include the constant vibrations caused by a continuously running vacuum system, but it also includes the vibrations caused by the fans of an air handling system that turn on and off based on the temperature of the room. Random vibrations are classified as vibrations from unpredictable sources like wind blowing a building or a jackhammer crew digging up a water main in the street. In addition to this periodicity information, it is important to know the frequency and amplitude of a vibration. Typically, the frequency of ambient vibrations will range from 4 to 100 Hz.
Many sources of noise contribute to the overall vibration of the experimental setup via more than one mechanism. For example, a vacuum pump located on the floor beside the experimental setup creates seismic vibrations in the floor as well as acoustic vibrations. Both of these channels of vibration should be considered when analyzing noise sources for the optical system. However, since mechanical coupling efficiency is typically higher than coupling efficiency from acoustic sources, the largest contributions to overall noise are generally due to seismic vibrations and forces directly applied to the load. Hence, placing the vacuum pump on a vibration absorbing pad may provide the necessary reduction in vibration to make its contribution to the overall noise insignificant when compared to other sources.
| Type | Frequency | Amplitude |
|---|---|---|
| Air Compressors | 4 - 20 Hz | 10-2 in |
| Handling Equipment | 5 - 40 Hz | 10-3 in |
| Pumps (Vacuum, comp or non-comp fluids) |
5 - 25 Hz | 10-3 in |
| Building Services | 7 - 40 Hz | 10-4 in |
| Foot Traffic | 0.5 - 6 Hz | 10-5 in |
| Acoustics (B) | 100 - 10000 Hz | 10-2 to 10-4 in |
| Air currents | Labs can Vary Depending on Class | Not Applicable |
| Punch Presses | Up to 20 Hz | 10-2 to 10-5 in |
| Transformers | 50 - 400 Hz | 10-4 to 10-5 in |
| Elevators | Up to 40 Hz | 10-3 to 10-5 in |
| Building Motion | 46 Hz per Meter of Height, Horizontal | 0.1 in |
| Building Pressure Waves | 1 - 5 Hz | 10-5 in |
| Railroada | 5 - 20 Hz | ±0.15g |
| Highway Traffica | 5 - 100 Hz | ±0.001g |
Table 1: Frequency and Amplitude of Common Vibration Sources
Identifying Vibration Sources
As described above, it is common in laboratories to find an ambient noise spectrum where the dominant inputs are most likely to be structural and acoustic. Table 1 lists some of the most common sources of noise along with their respective frequency and amplitude to provide an idea of what sources of vibration are likely to have the greatest amplitudes and if their frequencies are near the resonant frequency of a given system.
Before choosing a vibration isolation system, it is beneficial to consider the sources of noise present and to remove them if possible, such as the example given above with the vacuum pump. By removing sources of noise from the working environment, it may be possible to reduce the noise, thereby reducing the isolation requirements and the resulting cost of the needed vibration isolation system.
For instance, in Figure 1, an oscilloscope was placed directly on the experimental working surface. As a result, vibrations from the fan in the oscilloscope will directly apply a force to the experiment. By placing the oscilloscope on an overhead shelf that is not in direct contact with the experimental working surface, this source of vibration can be eliminated. When considering which sources of noise to eliminate, remember that seismic vibrations and forces applied directly to the load on the working surface are typically the most intense due to the high mechanical coupling efficiency.
Thermal disturbances from air conditioning systems and cooling fans can also cause relative motion between components due to material expansion and contraction resulting from temperature fluctuations. Most air conditioning systems will typically only maintain temperatures to within 1 degree/hour. Additionally, some experimental techniques will be sensitive to virtual movements caused by changes in the refractive index of air and its density, both of which have a temperature dependency. If this is the case, it is often beneficial to build an enclosure system around the sensitive components in order to limit temperature change and air flow.
Vibration Criteria
Although sometimes the specific vibration criteria are known because the manufacturer of a device provides the required environmental specifications for the proper use of that device, this is not always the case. In these cases, generic criteria have been developed by consultants like Colin Gordon Associates. Along with a description of what types of applications can be implemented successfully given the severity of vibrations present in a given environment, Table 2 below provides an idea of the resolution that can be achieved in each environment. The accompanying graph (Fig. 2) shows the criterion curves for each environment, showing RMS vibration velocity amplitudes over a range of one-third octave band center frequencies.
Generic Vibration Criterion
With a clear understanding of the potential noise sources and vibration criteria that need to be attained for high quality results, it is now possible to construct a vibration isolation system. The system should be able to attenuate all dynamic inputs in the range of frequencies for which the experiment is sensitive (4 - 100 Hz) if it is not possible to remove those noise sources from the laboratory and local environment. In addition, the system must minimize the duration of any disturbance produced on the working surface by damping those impulses.
Selecting a Vibration Isolation System
Before choosing a vibration isolation system it is important to determine two factors:
- The Severity of the Environment - Where is the table going to be placed (e.g., in a basement or on the upper floor of a steel frame building)?
This is the primary factor in determining the level of isolation required in an optical table support. - The Sensitivity of the Application - What is the intended application to be conducted on the table (i.e., how sensitive is the experiment)?
This is the primary factor in determining the stiffness and internal damping features required in the optical table
The environments listed in Table 2 below are given in order of decreasing environment severity and increasing application sensitivity.
Click to Enlarge
Figure 2: RMS Velocity Versus One-Third Octave Band Center Frequency
for Various Vibration Criteria
| Criterion Curve | RMS Vibration Velocity Amplitudea |
Resolvable Detail Size (Line Width) | Description of Use |
|---|---|---|---|
| Workshop (ISO) | 800 µm/s (8 - 80 Hz) | N/A | Vibrations can be distinctly felt. Appropriate to workshops and non-sensitive areas. |
| Office (ISO) | 400 µm/s (8 - 80 Hz) | N/A | Vibration can be felt. Appropriate to offices and non-sensitive areas. |
| Residential Day (ISO) | 200 µm/s (8 - 80 Hz) | 75 µm | Vibrations can be barely felt. Probably adequate for computer equipment, probe test equipment, and low-power to 20X microscopes. |
| Operating Theatre (ISO) | 100 µm/s (8 - 80 Hz) | 25 µm | Vibration cannot be felt. Suitable in most instances for up to 100X microscopes. |
| VC-A | 50 µm/s (8 - 80 Hz) | 8 µm | Adequate for most optical microscopes up to 400X, microbalances, optical balances, and proximity and projection aligners. |
| VC-B | 25 µm/s (8 - 80 Hz) | 3 µm | Appropriate for optical microscopes up to 1000X and inspection and lithography equipment (including steppers) down to 3 micron line widths. |
| VC-C | 12.5 µm/s (1 - 80 Hz) | 1 µm | A good standard for lithography and inspection equipment down to 1 micron detail size. |
| VC-D | 6 µm/s (1 - 80 Hz) | 0.3 µm | Suitable for the most demanding equipment, including electron microscopes (TEMs and SEMs) and E-beam systems. |
| VC-E | 3 µm/s (1 - 80 Hz) | 0.1 µm | A difficult criterion to achieve in most instances. Assumed to be adequate for long path laser based interferometers and other systems requiring extraordinary dynamic stability. |
Table 2: Application and Interpretation of Criterion Curves Courtesy of Colin Gordon Associates
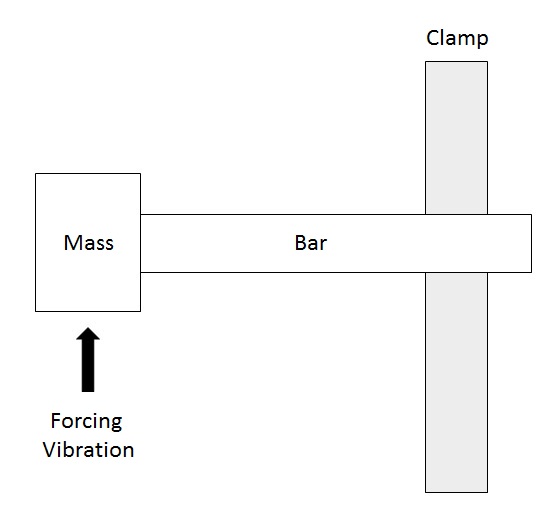
Figure 1: A Simple One-Degree-of-Freedom System:
a Constrained Bar Only Vibrating in One Plane
The primary goal of a well-designed optical table is to eliminate relative motion between any two (or more) components on the surface of the optical table. However, before the design of optical tables can be discussed, it is necessary to examine the underlying theory of vibrations and the nomenclature commonly used to discuss tabletop vibrations: compliance, vibrations, resonance, and damping.
Compliance
An optical tabletop is a real-world application of a common problem in engineering and physics: the deformation of a body or structure in response to external forces. These forces may be static, such as the sagging of a tabletop due to a large localized mass being placed upon it. Alternatively, the forces may be dynamic, such as acoustic vibrations in the air, vibrations of a small motor sitting on top of the optical table, or vibration transmitted from the building to the optical table through the optical table supports.
Definition of Compliance
The most widely used transfer function for the vibrational response of an optical table is compliance. In the case of a static, constant force, compliance is defined as the ratio of the displacement to the magnitude of the applied force. In the case of a dynamically varying force (vibration), compliance is defined as the ratio of the excited vibrational amplitude to the amplitude of the force causing the vibration.
Any deflection of the tabletop is evidenced by the change in relative position of the components mounted on the table surface. Therefore, by definition, the lower the compliance value is, the closer the optical table is to meeting the primary goal of optical table design, which is minimized deflection. Compliance is frequency dependent and is measured in units of displacement per unit force (meters per Newton).
Compliance Curves
To understand compliance, consider a hypothetical structure with only one vibrational degree of freedom (i.e., a structure with only one direction of deformation). For example, this structure could be a steel bar that is firmly anchored at one end and able only to vibrate in one direction, like the bar shown in Figure 1. This hypothetical bar is only able to be deflected in the vertical direction.
All periodic vibrations can be expressed as combinations of sine and cosine functions with the appropriate amplitude, frequency, and phase. Therefore, when a single-frequency sinusoidal vibration is applied to the bar, the general equation of motion is
 |
Equation 1 |
where the left hand side pertains to the forced system and the right hand side of the equation pertains to the forcing function.
 ,
,  and
and  are the acceleration, velocity, and displacement of the mass (m) being moved, respectively, while c and k are the damping and stiffness parameters, respectively.
The force F is sinusoidally varying with frequency f and maximum amplitude F0. The general expression for compliance of a system such as this is given by
 |
Equation 2 |
If we restate the above equation in words,
 |
Equation 3 |
A plot of compliance versus frequency (as seen in Figure 2) shows that the compliance of a rigid body can be separated into three regions: stiffness, resonance, and mass effects.
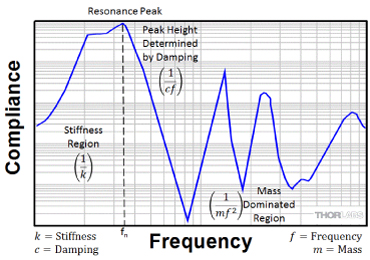
Figure 2: Compliance Versus Frequency for a System with One Degree of Freedom
Compliance at Low Frequencies – Stiffness
At zero and low frequencies, the mass effects and damping terms are effectively zero, so the compliance is well approximated by the stiffness term, 1/k. When a low-frequency forcing vibration is applied to the unattached end of the bar, it bends in response. The amount of deflection is determined by the stiffness of the bar, which ultimately depends on its shape, the tensile modulus of elasticity (Young's modulus) of the bar material, and the method of mounting and/or constraining the bar.
Any solid body has a fixed equilibrium, or rest geometry. The equilibrium geometry corresponds to a minimum in the potential energy of the object. When forces are applied to a solid body, it can be deformed from this equilibrium shape. The potential energy of the body rises and this results in a force that acts to restore the body to its equilibrium shape.
Consider a situation where the bar has been deflected from its equilibrium position and then released. The restoring force acts to return the bar to its equilibrium position. However, even though the restoring force on the bar will be zero when it reaches its equilibrium position, the momentum of the bar will cause it to overshoot this position. As a result, the bar will oscillate about its equilibrium position. The oscillation of the bar is an example of a simple harmonic oscillator. The oscillation occurs with a characteristic frequency fn, termed the resonant frequency, given by
 |
Equation 4 |
where fn is the resonant frequency of the oscillation, m is the mass moving during the oscillation, and k is the spring (force) constant, which is related to the shape of the bar and the Young's modulus of the material from which the bar is fabricated. In the absence of damping, this oscillation would persist forever.
In a real system such as an optical table, resonant vibrations can rarely be approximated to harmonic vibrations with such simple mathematics; however, the arguments made above can still provide insight into understanding the issues involved.
Compliance at Resonance
Solving Eq. (4) for m and substituting that result into Eq. (2) yields
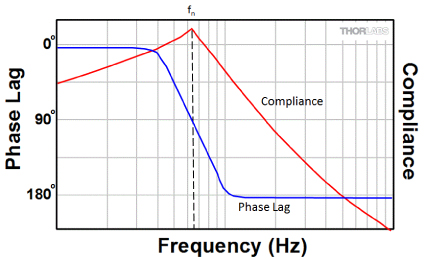
Figure 3: The Variation of Phase Lag Between Excited and Forcing Vibrations
for a System with a Single Resonance
 |
Equation 5 |
where
 |
Equation 6 |
 is referred to as the damping ratio.
From Eq. (5) it can be seen that when the frequency of the forcing function is close to the resonant frequency, the compliance is determined solely by the term containing the damping ratio, and as a result, the compliance can be quite large. This can be understood by considering the physical situation. When the forcing vibration frequency is at the same frequency as the resonant frequency of the bar (that is, f ≈ fn), each maximum in the velocity of the forcing vibration coincides with a maximum in the acceleration of the excited vibration. As a result, the forcing vibration increases the bar’s acceleration, which thereby accumulates vibrational energy that in turn results in an amplification of the forcing vibration.
Another way to picture resonance in this example is to consider what happens as the forcing function frequency is increased slowly from zero. When the forcing function frequency is near zero, the bar bends synchronously with the forcing vibration. As the frequency is increased, the bar will lag behind the forcing vibration because it has momentum and cannot reverse direction instantaneously in response to the periodic direction changes in the applied force (i.e., vibration). The phase lag will increase with frequency, as seen in Figure 3. At the resonant frequency, the phase lag between the oscillation of the rod and the forcing vibration will be exactly 90°, meaning that the maximum in the bar’s acceleration always coincides with the maximum in the velocity of the forcing vibration. As a result, amplification of the vibrational input occurs (see Fig. 2 and 3).
At forcing vibration frequencies greater than the resonant frequency, the phase difference between forcing and excited vibrations in this theoretical one-resonance system is 180°.
In a real structure such as an optical table, there are many possible resonant modes of vibration. The phase of an excited vibration depends on the location on the table at which the measurement is made as well as on the type of vibration being excited.
Compliance at High Frequencies - Mass Effects
At higher frequencies, the compliance is totally dominated by the mass (inertia) of the table. For f >> fn, Eq. (2) can be approximated as
 |
Equation 7 |
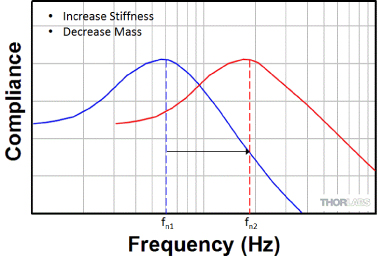
Figure 4: Shifting the Resonant Frequency by Changing the Stiffness-to-Mass Ratio
Where m is the effective mass and f is the frequency of the forcing vibration.
In certain very simple vibrational systems, such as a single mass suspended from a spring, it is fairly easy to evaluate the mass involved in the vibration. However, in real systems the mass term in the general equation for compliance can become quite complex. For instance, the structure of an optical table is such that it has several types of bending and flexural resonant modes of vibration. Therefore, different points on the table are undergoing different amplitudes of vibration. At nodal points, there is no vibrational amplitude at all for that specific vibrational node. As a result, the effective mass involved in the vibration is a complicated function that is usually determined numerically.
Modifying a Resonant Frequency
As shown in Eq. (4), the resonance frequency is dependent on the stiffness and mass of the object. Decreasing the mass and/or increasing the stiffness shifts the resonance to a higher frequency, as seen in Figure 4. Alternatively, increasing the mass and/or decreasing the stiffness shifts the resonant frequency lower.
The balance of the mass and stiffness is a simple, yet important, concept in optical table design because this allows the resonances of the optical table to be pushed to higher frequencies with lower amplitudes. Clearly, this can be accomplished merely by increasing the stiffness of the table. However, if this is accompanied by a proportional increase in mass, then the resonances will not be shifted. In order to raise the resonant frequency, the stiffness must be maximized while minimizing the mass. This is discussed in more detail in the Table Design tab.
Damping
Damping refers to any process that causes an oscillation in a solid body to decay to zero amplitude. It is a very important phenomenon in vibration suppression or isolation in real systems because it causes energy to be diverted from vibration to other sinks.
Damping is a resonant effect in that it significantly affects the compliance function at or near resonance (i.e, when f ≈fn). The height of the compliance peak at resonance is primarily determined by the amount of damping. In the absence of damping, the peak would be infinitely high.
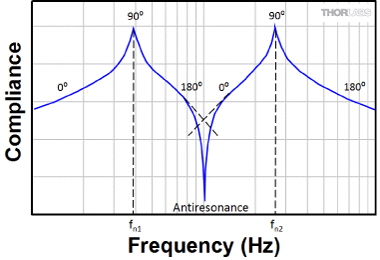
Figure 1: An Antiresonance, Caused by Two Vibrational Components of
Equal Magnitude which are 180° Out of Phase
Types of Damping
Materials such as wood and rubber have a large amount of natural damping. The microstructure of a well-damped material is such that deformations cause strains in the material that rapidly convert the mechanical vibrations into other forms of energy such as heat. Metals manifest a small amount of internal damping. This is principally due to the small amount of friction present at grain boundaries.
In many instances, a structure may consist of supporting elements that are quite rigid and tend to ring with little natural damping. If the structure is being designed to avoid vibrations, additional damping mechanisms may be required. There are many methods of introducing damping into a system, many of which rely on using friction to convert the vibrational energy into heat. This is discussed in the Table Design tab.
Multiple Resonances
Real structures like optical tables have multiple resonant modes. Often, these modes are coupled so that the form of the resonant vibration is quite complex, particularly in the case of non-symmetric structures. Also, each vibrational mode often gives rise to a whole series of overtones or harmonics. However, the fundamentals of the simple 1D model developed in the Compliance tab are still valid.
- At low frequencies, below the first resonant frequency, the compliance of a real structure is determined by the stiffness. Stiffer structures are less compliant (i.e., they vibrate less for a given forcing vibration).
- At frequencies above the region of the first resonance, the compliance of a rigid structure is roughly given by 1/(mf2), although resonant effects are superimposed on this.
- The compliance at the various resonant peaks is mainly dependent on the amount of damping at these resonant frequencies and by the effective mass associated with the vibrational mode. However, the relative height of these peaks is still approximately proportional to 1/cf.
Antiresonances
In systems with several vibrational degrees of freedom, such as an optical table, the compliance curve will often show negative peaks, as seen in Figure 1, between the resonant peaks. This is due to the interaction between multiple resonant peaks. The phase difference between the forcing function and the vibrational response of the system changes from 0° to 180° as the frequency of the forcing function is scanned over a resonance. This results in a peak in the compliance curve. When the tails of two resonance peaks overlap, the response of the system is determined by the phasor addition of the system's response to each resonant peak. When the phase of the response due to the first resonance is 180° out of phase with the second resonance and the magnitude of the response is roughly the same, it is possible for the net compliance at this point to be very small. The negative peak is referred to as an antiresonance in the compliance curve.

Figure 2: A Typical Compliance Curve of a High-Performance Thorlabs Optical Table
Compliance of a Real Table
The concept of an ideal rigid body is useful when considering optical table performance. This theoretical structure does not resonate and therefore has no compliance peaks. The compliance of an ideal rigid body is proportional to 1/f2 so when plotted on a log-log scale, it is represented by a straight line with slope -2. It represents the design goal when manufacturing optical tables; the nearer the actual curve fits the straight line, the better the dynamic stiffness.
A compliance curve of a real table can now be examined. Figure 2 shows a typical compliance curve created by measuring the response of the corner of a Thorlabs optical table as the tabletop is vibrated. The corner of the optical table is used to make the measurement because the performance of the optical table is typically the worst at the corners, and as a result, a measurement made at the corner can usually be considered a worst-case scenario.
Conventionally, this type of data is presented on a plot with logarithmic horizontal and vertical scales. A vertical logarithmic scale is used since there are a large range of compliance values, while a horizontal logarithmic scale is necessary to display the wide range of frequencies without losing the important details of the compliance curve that exist near the low-frequency resonances.
Several aspects of this curve merit special comment. The initial portion of the plot (i.e., before the first table resonance) is determined primarily by the table supports, not the table itself. Also, notice how the peaks at compliance resonances decrease in size towards higher frequency. As the frequency increases, the denominator in the compliance expression (Eq. 2 on the Compliance tab) increases, and therefore, the compliance is reduced. This means that as the frequency increases, a given excitation force produces a smaller amplitude excitation in the table. The low- frequency peaks are the most important for two reasons. First, these are the largest peaks, corresponding to the weakest points in the compliance spectrum. Second, typical vibrations from laboratory equipment are usually below 150 Hz. The peaks should be at the highest frequency possible while keeping the compliance in the 0 to 150 Hz region as low as possible. Finally, for this particular curve, an inverted peak occurs around 120 Hz; this is a typical antiresonance caused by the phase effects previously described.
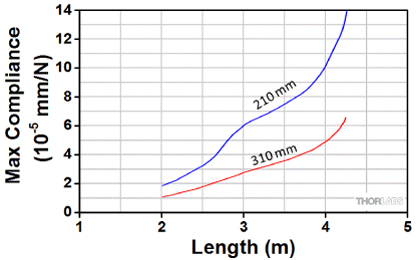
Figure 3: Compliance Versus Length for Optical Tables of Different Thicknesses
Summarizing the performance of an optical table with a few specifications is difficult. Even an informative compliance curve, such as that shown in Figure 2, fails to provide a complete summary of optical table specifications since the measured compliance of the table is dependent on where the measurement device is placed on the table as well as the position of the point of contact for the forcing vibration. For instance, if the forcing vibration is applied at the physical location of a node of the first resonant peak, the measured compliance would be significantly reduced because the vibrations would not be able to excite that resonance in the table.
However, if the compliance of the optical table is measured in such a way that it accurately describes the performance of an optical table, then the plot can be further reduced to two numbers that can be used to quantify the performance of the optical table. The first number is the frequency of the first resonance peak. Typically, most laboratory vibrational sources will have a vibration frequency between 0 and 150 Hz; higher first resonant frequencies make is less likely that a source will be able to excite the optical table at that frequency. The second number of relevance is the height of the highest peak (usually the first peak) in the compliance curve above the compliance value of an ideal body at that frequency. Often, this height is reported as the ratio of the peak height to the compliance value of the ideal body. This ratio represents the amplification (Q value) of the vibration at the resonant frequency.
Remember that one compliance curve does not describe the performance of an optical table. A few modes may have very low, or zero amplitudes at the corner of measurement. In general, a compliance curve obtained at the corner of an optical table is a reasonable measure of the worst case performance of any part of the table surface.
Table Stiffness
The measured low frequency compliance of an optical table is entirely a function of the optical table support structure used during the test. The low frequency behavior of an optical table is usually expressed as the stiffness or deflection under a measured static load. This can be measured as either a displacement of the center of the table or as an angle of deformation of the tabletop. The actual values depend on the position of the optical table supports.
Table Thickness
Compliance also varies with table thickness. Figure 3 shows that for a table 1.5 m x 3 m, if the thickness is increased from 210 mm to 310 mm, then the compliance improves from 6 x 10⁻⁵ mm/N to 2.8 x 10⁻⁵ mm/N.
Furthermore, the deflection of a supported structure increases proportionally with length. Typically, a table 4.25 m long would need to be 460 mm thick to provide the same static deflection per unit load as a table 2.0 m long and 210 mm thick.
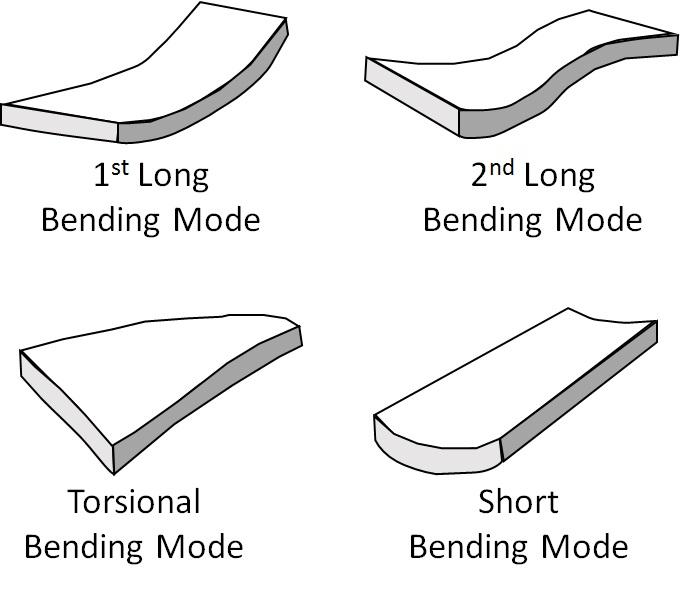
Figure 1: Vibrational Modes of an Optical Table
Design Objectives
There are two basic goals that guide the design of the optical tables made by Thorlabs: the natural resonances of the table should be as high as possible and the table should be well damped. The advantage to designing a table with resonances as high in frequency as possible is that the amplitude of the vibrations is proportional to 1/cf at the peak of a resonance. As discussed in the Damping tab, increasing the frequency of a resonance requires an increase in the stiffness and/or a reduction in the mass of the optical table. To minimize the duration and amplitude of the vibrations that do occur on the table, additional damping mechanisms can be built into the table.
Tabletop Vibrations
For a typical rectangular tabletop, the lowest frequency vibrations (in order from lowest to highest frequency) are the long, torsional, and short bending modes. In Figure 1 these bending modes are illustrated along with the first overtone of the long bending mode (labeled as 2nd long bending mode). Each of these independent modes has a characteristic resonant frequency, which gives rise to a corresponding peak in the compliance curve. Therefore, to avoid any resonant effects from induced floor or tabletop vibrations, the resonant frequencies of the table need to occur at frequencies above the frequency of the vibrations created by sources in the vicinity of the table.
In addition to the first long, torsional, and short bending modes, there is a series of overtones (i.e., higher frequency resonances), which are responsible for the series of peaks in the compliance curve that occur at higher frequencies than the first bending frequency (see Fig. 2). Different vibrational modes have their maximum amplitude displacement points (antinodes) and minimum amplitude displacement points (nodes) at different places on the table. Clearly, with the possibility of simultaneous excitation of several vibrational modes, the resultant compliance of an optical table is a complex function that will vary considerably over the table surface.
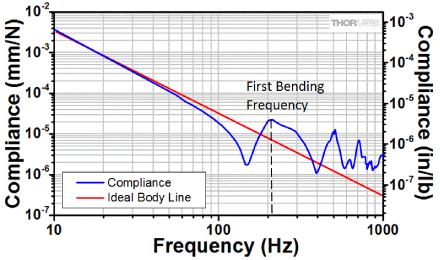
Figure 2: Compliance Curve of an Optical Table with the Resonance Due
to the First Bending Mode of the Table Labeled
Tabletop Materials
The three basic requirements for an optical tabletop are:
- Good Static Rigidity (i.e., Stiffness)
- Low Mass so that No Low Frequency (<100 Hz) Resonances are Present (see Eq. 4 on the Compliance tab).
- Note: Low frequency resonances have large amplitudes, and most laboratory background vibrational noise occurs at low frequencies.
- A Well Damped Structure
For many years, scientists performed delicate optical experiments on home-built tables, which were usually quite massive. These optical tables were constructed from granite, concrete, wood, steel, and many elaborate composite structures in attempts to improve performance while keeping weight at a realistic level. Each of these materials has advantages and disadvantages. The disadvantages of granite and concrete are that the slabs tend to absorb water vapor, which causes them to deform. Steel has two distinct drawbacks: a high density and a tendency to resonate at several vibrational frequencies, with very little natural damping. The performance of wood is surprisingly good; however, it has a tendency to warp with time and/or exposure to moisture.
In the end, the best material for use in the construction of an optical table is a composite (i.e., some matrix of materials that combines the stiffness associated with pure metal, the damping associated with rubber, and the low density of wood). Most modern optical tables are made using solid steel or aluminum plates separated by an interior honeycomb structure, which is usually made from steel. The plates provide a stiff, flat working surface while the interior honeycomb structure greatly increases the dynamic rigidity of the optical table, without significantly increasing the mass of the optical table. The honeycomb structure naturally damps table vibrations; however, optical tables used in experiments sensitive to vibrations usually include additional interior damping mechanisms that specifically dampen the lowest frequency resonances of the optical table.

Figure 3: Tubes and I-Beams Have a Large Stiffness-to-Mass Ratio
Stiffness of Hollow vs. Solid Structures
Consider a solid bar of a homogeneous material such as steel. If this bar is bent, then the top edge is stretched and the bottom edge is compressed while the core of the bar is relatively unaffected by this deformation. Consequently, the restoring force is primarily due to the edges of the bar. As a result, a hollow bar would be almost as resistant as a solid bar to this type of deformation. Therefore, the strength of a structure is dependent not only on the material of the structural elements but also on their shape and position. This idea can be further demonstrated by considering how an I-Beam responds to the same bending force that was applied to the solid bar discussed above. Under load, the top flange is under tension and the bottom flange is under compression, but at the neutral axis (which is labeled "n.a." in Figure 3) the stress is zero. The flanges carry the bending stresses and the web resists the shear forces. The further apart the flanges are, the lower the deflection for a given load; i.e., the higher the stiffness. Therefore, when designing an optical table, it is important to consider the shape of the structure.
Optical Table Design
A hollow steel table would be very rigid for its mass because the sides, top, and bottom plates would act as an extended I-beam. However, this structure would tend to ring due to the absence of damping, and it would also sag in the middle under heavy load conditions. For these reasons optical tables are not hollow; instead, they are filled with a material that increases the damping of the optical table and its stiffness in the vertical direction. An interior honeycomb structure adds these properties to the optical table without making the optical table overly massive. Steel, aluminum, phenolic, graphite, Kevlar, and even wood pulp have all been used as honeycomb materials.
Honeycomb Theory
If the interior support structure consisted of planes of parallel steel sheets bonded to the top and bottom solid steel plates, this would effectively make the table into a series of I-beams oriented along the long direction of the steel sheets, as shown in Figure 4. This geometry would dramatically increase the stiffness of the table along this direction due to the shape of the I-beam as discussed above. In order to create this I-beam-type structure along two axes, the plane sheets could be interlocked. At this point, the table would be most susceptible to bending along a plane at 45° with respect to either of the planes of parallel sheets, which means that the table’s resistance to torsional bending has not been significantly improved.
Therefore, to resist the long, short, and torsional bending modes, the sheets in the structure must be oriented at intermediate angles. The disadvantage to the strategy of continuing to add parallel planes of sheets at intermediate angles is that each set of sheets increases the mass of the table; if the idea of adding new sets of parallel planes is projected forward, the resulting optical table would just be a solid steel object with a high mass and very little natural damping mechanisms. The most practical solution to the need for a light structure that provides stiffness along several planes is to create an interior with a hexagonal or sinusoidal cellular structure. A hexagonal structure is easy to fabricate by crimping the sheets and reduces the maximum angle from a plane supported by the structure to 30° without significantly increasing the weight of the table.

Figure 4: Planes of Stiffness
Thorlabs Metal Honeycombs
All of the standard tables made by Thorlabs consist of a sandwich structure, as shown in the Introduction tab, comprised of thick steel top and bottom plates with a metal honeycomb core. Thorlabs’ honeycombs are fabricated from strips of precision-crimped steel, which are then bonded together with a high-tensile-strength epoxy adhesive.
Bonding Materials
The structural integrity of the composite optical table is extremely important to the performance of the optical table. As a result, Thorlabs uses a hot pressing method and a modified structural epoxy adhesive to bond the honeycomb to the steel plates; then, the adhesive is cured under vacuum for 18 hours. This results in a bond between the various pieces of the composite structure that has a high tensile strength as well as extremely high shear and peel strengths.
Damping Techniques
In theory, a resonating structure without damping has an infinitely high compliance peak at its natural frequency. Damping systems suppress these peaks usually by converting the energy of vibration into heat, which causes the amplitude of the disturbance to decay rapidly to zero.
As previously stated, the equipment mounted on the tabletop can be a major source of vibration (e.g., an out-of-balance chopper blade). Once a table is mounted on its pneumatic isolators (see Fig. 5), any vibrations induced on the top are not transmitted through the supports, which would allow them to dissipate into the ground. Therefore, these vibrations must be damped by the table's own internal damping.
The damping of an optical table arises from several sources. The materials themselves have some natural damping, particularly in the case of the metal honeycomb. Producing a table with state-of-the-art performance, suitable for the most demanding applications, requires additional damping. At Thorlabs, the additional damping mechanism involves positioning dampers at strategic points in the core of the table. These dampers are specially shaped pieces of inhomogeneous material that act as though they contain a spectrum of masses, separated by a continuous spectrum of distances in an elastomeric polymer. The effect is dramatic, greatly reducing the height of the low frequency resonance compliance peaks, sometimes by more than an order of magnitude.
Surface Flatness
Tabletop flatness is critically important during many experimental setups. If the optical table surface is not flat, the height of a component will vary as it is moved to different positions on the optical table, and the possibility exists for components with flat bases to wobble when placed on the optical table. Thorlabs’ optical tables are extremely flat due to the high-precision magnetic stainless steel plates used to make the mounting surface. Each plate is specially handled to maintain its superior flatness throughout the manufacturing process.

Figure 5: Evaluating the Performance of an Optical Table
Athermal Design
The optical tables made by Thorlabs have matching magnetic stainless steel plates on the top and bottom surfaces of the table. This design minimizes thermally induced stress and bowing of the optical table.
Evaluating Performance
As previously discussed, the performance of an optical table is quantified by its compliance. The compliance of Thorlabs’ tables is measured using a dynamic signal analyzer.
Compliance Measurement Procedure
An impulse hammer is used to apply a measured force to the top surface of the table or breadboard, and accelerometers attached to the surface detect the resultant vibrations (see Fig. 5). The signals from the accelerometers are interpreted by the analyzer and used to produce a frequency response spectrum (i.e., a compliance curve). During the development phase of an optical table, compliance curves are recorded at many points on the tabletop; however, the compliance is always greatest at the corners. The compliance curves and data published by Thorlabs are taken with the sensor located approximately 6" (150 mm) from the corner of the tabletop (closer to the edge for small breadboards), with the point of impact just inboard of the sensor. This test location represents the worst case data.
Unique Test Data Certificate
Each of our optical tables and breadboards is tested and shipped with a unique test data certificate and compliance curve. This provides more accurate data compared to the industry standard of using a single size-specific compliance curve to represent the entire product line. The compliance curves and data published by Thorlabs are from sensors located on the corner of the table and therefore represent the worst case data.
Summary
- The optical table should be a stiff, low mass structure.
- The compliance characteristics of an optical table should be as near as possible to that of an ideal rigid body.
- The table resonances should be shifted to as high a frequency as possible in order to minimize the number of common vibrational sources that produce vibrations at a resonant frequency.
- The table should have internal damping mechanisms that minimize the table’s compliance at resonant frequencies and damp all vibrations in the shortest possible time. The characteristic damping time is referred to as Impulse Decay and is usually reported with units of milliseconds.

Figure 1: A Ball and Spring Example of a Vibration
Isolation/Transmission System with One Degree of Freedom
Creating a working surface for optical setups that is free from vibrations is a two-part problem. The first part, as discussed in the Table Design tab, is designing the optical table to have zero (minimal) response to a deflective force or vibration. This, in itself, is not sufficient to ensure a vibration-free working surface. The rigid table may still vibrate without deforming because the entire tabletop can vibrate on top of the optical table supports. The second part of the problem is designing optical table supports that prevent vibrations from being transmitted from the floor to the optical tabletop. In real setups, the entire table system is subjected continually to vibrational impulses from the laboratory floor. These vibrations may be caused by large machinery within the building or even by wind or traffic-excited building resonances (swaying).
Seismic Mounting
The simplest model used in a theoretical treatment of mechanical vibrations is the ball and spring model shown in Figure 1. Consider a ball of mass m that is suspended from a fixed surface with enormous mass via a spring. For now, we shall ignore the pendulum motions and consider a system having only one degree of freedom in the vertical direction.
Figure 2: A Typical Transmissibility vs. Frequency Curve
for a System with One Degree of Freedom
Floor vibrations in a building can be divided into two basic types: vertical and horizontal. Typically, vertical components range from 10 to 50 Hz while horizontal components range from 1 to 20 Hz. To prevent such vibrations from disturbing an experiment, it is important to support the optical table so that the optical table’s instantaneous position is independent of the periodic motions of the laboratory floor. This type of isolation is termed seismic mounting. When an object is truly seismically mounted with respect to the floor, the motions of the object and the floor are completely uncoupled. The term seismic is linked with the study of earthquakes since the magnitude of an earthquake is estimated from the motion of the ground with respect to a seismically mounted indicator.
Transmissibility
In the absence of vibrational impulses, the ball in Figure 1 will remain stationary at its rest position. Suppose the object from which the ball is suspended is not infinitely large or not infinitely stiff so that the point at which the spring is anchored starts to vibrate. Some of that vibrational energy may be transmitted to the ball, causing it to vibrate at the same frequency. The frequency of this motion is given by
 |
Equation 1 |
Where fn is the resonant frequency of the oscillation, m is the mass moving during the oscillation, and k is the spring constant (related to the stiffness of the spring).
The flow of vibrational energy is expressed in terms of a transfer function. A transfer function is a method of quantifying how efficiently a forcing vibration can produce an excited vibration. The transfer function most applicable here is termed transmissibility and is defined as the ratio of the dynamic output to the dynamic input (i.e., the ratio of the amplitude of the transmitted vibration to that of the forcing vibration).
Figure 3: The Phase Relationship Between Excited and Forcing Vibrations
Changes Rapidly Near Resonance
Resonance
In the example just outlined, the transmissibility of the spring is dependent on the frequency of the forcing vibration. The idealized transmissibility (T) of this system is given by
 |
Equation 2 |
where the damping ratio is defined as
 |
Equation 3 |
Here, f is the frequency of the forcing function and c is a parameter describing the damping properties of the system. The damping ratio will be discussed in more detail later.
The graph in Figure 2 shows a plot of this idealized transmissibility as a function of frequency. Note the similarity to the compliance transfer function discussed in the Compliance tab. As before, the curve can be divided into three distinct regions.
At low frequencies, the ball in Figure 1 moves synchronously with the mass that the spring is suspended from and with the same amplitude (i.e., the transmissibility is unity as defined by Eq. 2). The system behaves as though the spring is rigid, and as a result, the ball is not isolated from the large mass.
As the frequency of the driving force increases, the momentum of the ball prevents the ball from moving in phase with the driving force (i.e., a change in the direction of the driving force does not instantly result in a change in the direction that the ball is moving). When the phase lag between the driving force and the vibration of the ball becomes exactly 90°, the system is vibrating at its natural (resonant) frequency fn.
When the driving force frequency is much greater than the resonant frequency of the spring/ball system, the response of the ball is determined solely by the mass of the ball. In other words, the spring is relatively soft and the vibrational force travels slowly along as compression waves. This slow transmission effectively spreads out the oscillatory nature of the forcing vibration. Essentially, the ball experiences a time-averaged force due to its slow response to the fast moving vibrations, and unless the vibration involves a net displacement, the magnitude of the time-averaged force tends toward zero with increasing vibrational frequency. As the transmissibility approaches zero, the position of the ball is not affected by the vibration in the large mass. At this point the ball is seismically mounted.
Damping
Damping refers to any process that causes an oscillation in a system to decay to zero amplitude. It is a very important phenomenon in vibration suppression or isolation. Damping causes the energy to be diverted from vibration to other sinks.
Damping in a system is usually defined as the ratio of actual damping to critical damping. Critical damping is the minimum amount of damping in a system necessary to prevent resonant oscillation, following application of an impulsive force. Damping is a resonant effect in that it primarily affects the transmissibility function at or near resonance.
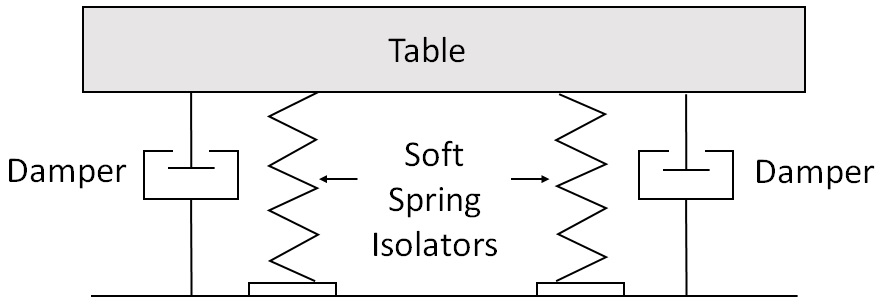
Figure 4: Ideal Seismic Mounting of an Optical Table Consists of
Weak Spring Supports with Added Damping
At resonance,
 |
Equation 4 |
Using this relation, Eq. (2) can be simplified to read
 |
Equation 5 |
Eq. (5) shows that the height of the transmissibility peak at resonance is mainly determined by the amount of damping. In the absence of damping, the peak would be infinitely high. Also, a system with no damping would not stop vibrating, even when the driving force was removed. Clearly, all real systems contain damping to some degree. Using the suspended ball as an example, the simplest form of damping would be to immerse the ball in a viscous medium. The drag on the ball created by the viscous medium would convert the vibrational energy to heat via friction.
Seismic Mounting of Tables
The ball and spring model suggests, in principle, a way in which an optical table could be seismically mounted. Simply suspend an optical table from a rigid ceiling by weak springs. Then, at frequencies much higher than the natural resonance of the spring isolation system, ambient building vibrations would not be transmitted to the table. Obviously, this solution has no practical value, but it illustrates the general principles involved.
Typically, ambient vibrations in a building tend to be in the range of 10 to 50 Hz for vertical components and 1 to 20 Hz for horizontal components. To seismically mount an optical table under these conditions requires a mounting system with a very low resonant frequency. Unfortunately, even with the use of composites, optical tables are relatively massive (typically 500 kg for a 1.2 m x 2.4 m table). Such a system would involve highly extended springs and a very large travel range of the table.
The ideal mounting system shown in the Isolation Systems tab has a rigid tabletop mounted to the floor in such a way that it can vibrate in vertical and horizontal directions, both with low resonant frequencies. Even though these resonant frequencies can be made lower than most building vibrations, it is important that the height, and as a result, the width of the resonant peak in the transmissibility curve be reduced. This is achieved by adding a damping mechanism, which ensures minimum oscillation at resonance and short settling times.
The purpose of vibration isolation supports is to isolate the optical table from vibrations from the building and the surrounding environment. True seismic mounting of an optical table requires a mounting system which addresses two issues.
- Ambient building vibrations occur at low frequencies; therefore, the mounting system must have very low vertical and horizontal resonant frequencies in order to function as a seismic isolator.
- The motion of the table must be damped in order to suppress the resonant response of the optical table.
Air Springs for Vertical Isolation
The simplest and most successful optical table supports have internal air springs. In Figure 1, the simple air spring is constructed by placing a rigid disk, which is constrained to only allow vertical motion, on top of a deformable air reservoir. When a heavy object is placed on top of the rigid disk, that object is isolated from floor vibrations by the expansion/contraction of the air reservoir.
Air springs differ from conventional mechanical springs in that they have a very small spring constant for a given range of travel. In an air spring, the relationship between restoring force and deflection varies with the shape and material of the air spring envelope. The resonant frequency of an air spring isolator is given by
 |
Equation 1 |
Here, fn is the resonant frequency of the oscillation, r is the specific heat ratio for the gas (air) in the spring, A is the piston area, g is the acceleration due to gravity, and V is the volume of the air bag (or cylinder).
From Eq. (1), we can conclude that the stiffness of the spring (and hence the natural resonant frequency of a mass supported on the spring) is dependent on the height of the spring (volume of air) but independent of the load. Consequently, if the load is changed but the pressure is adjusted to maintain a constant height, then the resonant frequency remains constant. This is highly desirable for optical tables; if the resonant frequency of the optical table supports increased with load rather than with spring height, then the frequency at which the optical table is effectively seismically isolated would also increase. In addition, this allows optical table supports to be designed with an internal damping mechanism that is targeted at the resonance of the optical table support, regardless of the load being supported.
Since most optical tables are supported by four optical table supports, there are several vertical vibrational modes (i.e., resonant vibrations) of the table on the support system. These modes consist of various in- and out-of-phase combinations of the vertical resonance modes of the individual optical table supports; these linear combinations not only affect the vertical movement of the surface but also lead to pitch and roll of the surface. The frequencies of the optical table's oscillation modes are near the resonant frequency for vertical vibrations in an individual leg. As a result, the modes of oscillation involving the entire optical table surface can be damped by any mechanism in the optical table support designed to damp at the support's resonant frequency.
Click to Enlarge
Figure 2: Features of Thorlabs' Rigid Optical Table Supports
Click to Enlarge
Figure 3: Features of Thorlabs' Passive Optical Table Supports
Click to Enlarge
Figure 4: Features of Thorlabs' Active Optical Table Supports
Choosing an Isolation System
Thorlabs offers three levels of optical table supports: rigid, passive, and active. All three varieties of optical table supports are available from stock in two heights: 600 mm (24") for use with a 310 mm (12.2") thick optical table and 700 mm (28") for use with a 210 mm (8.3") thick optical table. In addition, rigid and active supports are also available in a 450 mm (17.7") height for use with 460 mm (18.1") thick optical tables. Special optical table support heights are also available upon request.
The simple air spring design described previously is more than adequate for use in lower-vibration environments or for less sensitive experiments; they also provide a vast improvement over rigid support systems such as steel legs. However, three issues are not directly addressed. (1) There is no attempt to increase the amount of damping beyond that provided by the viscoelastic damping achieved by deforming the walls of the air bag. As a result, the vibration peak at the resonant frequency can be quite large. (2) The design does not actively address the issue of horizontal isolation, and the table is able to rock on its legs. (3) The vertical resonance frequency depends on the nature and shape of the linkage between the table and the airbags but is typically in the 3 to 5 Hz range.
Ambient horizontal vibrations tend to occur at lower frequencies than vertical floor vibrations (1 to 20 Hz versus 10 to 50 Hz) and are therefore more difficult to isolate. However, unless the laboratory is located on the upper floor of a tall building, the horizontal floor motions will generally be much smaller than the vertical vibrations. The simple air spring design does not have any mechanism for self-leveling and automatic height adjustment. Therefore, if a large load is placed on the tabletop, it will be lowered slightly; in addition, if that load is not placed centrally, the tabletop will no longer be level. Therefore, before choosing an isolation system, consider the severity of the environment in which the table is located and what type of vibrations can be expected. The subsections below detail the capabilities of each type of optical table support.
Rigid Optical Table Supports
Rigid optical table supports (see Fig. 2) are used primarily when the environment and/or application does not require the optical table to be isolated from vibrations. Instead the optical table is being used because it provides a rigid, flat surface on which to build an application.
Features:
- Excellent Horizontal and Vertical Stability
- High Load Capacity
- Leveling Adjustment on Each Support
Passive Optical Table Supports
Passive optical table supports are primarily used when the optical table is located in an environment with minimal vibrations. The deformable air reservoir in the passive optical table support (see Fig. 3) is used to isolate the optical table from floor vibrations ranging in frequency from 10 to 50 Hz. The transmissibility above 10 Hz is below 0.3, which is a significant improvement over the performance of isolators using rubber or neoprene padding.
Features:
- Simple, Effective Vertical Vibration Isolation
- Excellent Horizontal and Vertical Stability
- Easy to Pressurize (No Need for a Constant Source of Pressurized Air)
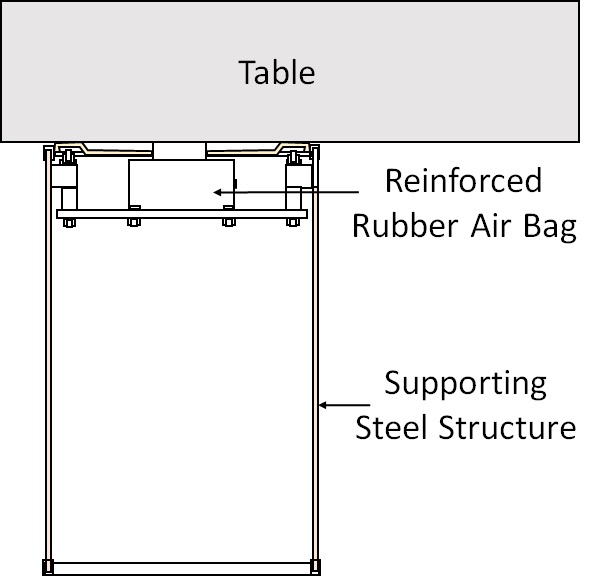
Each isolator consists of a cylindrical reinforced rubber air reservoir mounted in the top of a cylindrical steel leg. The pressure of the isolator can be adjusted by increasing or decreasing the pressure in the air reservoir through a standard Schrader valve on the side of each isolator. The passive optical table support is designed so that the cylindrical steel leg will support the optical table when the air reservoir is not properly inflated. The optical table can be leveled by adjusting the pressure in each air reservoir.
Active Optical Table Supports
Active optical table supports, which require a constant supply of pressurized gas, should be used for vibration-sensitive applications and when the optical table is located in an environment with significant vibrations. For example, if an experiment is conducted on an upper floor, the building may sway, causing both vertical and horizontal vibrations. Unlike the rigid and passive optical table supports discussed above, the active optical table support includes a horizontal damping mechanism. In addition, the active optical table supports have a self-leveling feature. These large-diameter free-standing supports provide a safe and stable foundation without the need for tie bars that can introduce additional resonances into the support structure. The low vertical and horizontal transmissibility of these isolators results in the least possible relative tabletop motion.
Features:
- Superior Vertical and Horizontal Vibration Isolation
- Excellent Horizontal and Vertical Stability
- Self-Leveling
Vertical damping is achieved by the use of a dual chamber, damped pneumatic spring (see Fig. 4). The table is supported by the air pressure in these chambers. A piston, in contact with the bottom of the optical table, is sealed to the upper pressurized chamber using a rolling rubber diaphragm that allows virtually friction-free displacement of the piston in the vertical direction while preventing horizontal displacement of the piston. Floor or tabletop motion forces air to flow from one chamber to the other through a high-resistance damper. This design reduces the 0.3 transmissibility point to less than 3 Hz. This restriction in the airflow between the two chambers damps the oscillatory motion between the floor and table, dramatically reducing settling time. The volume ratio of the chambers has been optimized to produce a well damped optical table support with a low resonance frequency.
A simple method for mounting an optical table that allows for the damping of horizontal vibrations is to allow the optical table support to move with a pendulum-like motion. The resonant frequency of a pendulum is independent of the mass and is given by
 |
Equation 2 |
Here, fn is the resonant frequency of the oscillation, g is the acceleration due to gravity, and l is the length of the pendulum. Thorlabs' active isolators damp horizontal vibrations by supporting the pneumatic vertical isolator on a trifilar suspension system. This pendulum design uses gravity to provide the restoring force following horizontal displacement. Horizontal oscillations at the system's resonant frequency are damped by linking the base of the vertical isolator to the outer cylinder with an oil-free vibration-absorbing damper.
Click to Enlarge
Figure 5: Thorlabs' Earthquake Restraints provide a rigid defense from lateral movements due to seismic activity.
The active optical table supports are connected to a constant pressurized gas source via a three-way valve that regulates the gas pressure in the supports in order to self-level the optical table. Remember, the pressure in the air chamber determines the height of the optical table when the table is at rest. The system will return after a disturbance to within ±0.25 mm (0.01") of its original level position. The valves also compensate automatically for any changes in tabletop load distribution. Additionally, this system allows the table height to be adjusted over a range of 18 mm (0.7") and can be used to compensate for an uneven floor. If the constant source of pressurized gas is removed, the optical table will lower until it rests securely on top of the optical table supports. At this point, although the isolating properties of the supports are disabled, the optical table will still be securely and stably supported.
Optical Table Earthquake Restraints
For areas that experience heavy seismic activity, earthquake restraints (see Fig. 5) exist as supplementary supports for protection of the optical table and primary supports. Designed to be minimally invasive, the supports must be mounted to the underside of the table and a suitable floor, and will not affect the isolation provided by the primary supports. Thorlabs' Optical Table Earthquake Restraints provide a rigid defense for lateral acceleration, preventing the movement of the table.
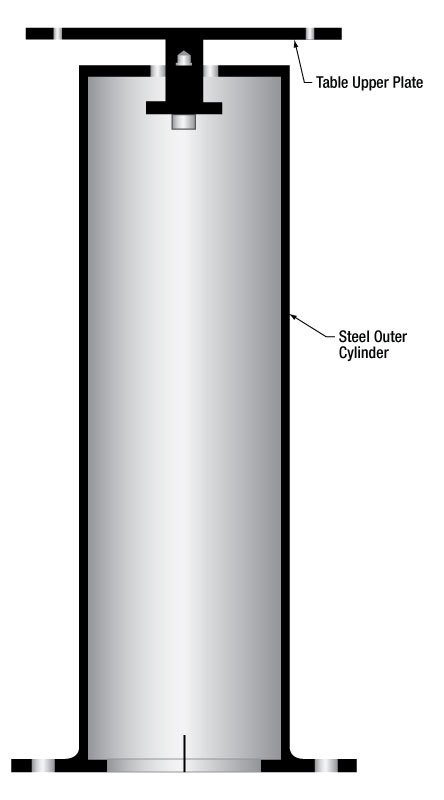
Instability and Oscillation
Systems with a high center of gravity (CG) can experience stability problems when supported on pneumatic isolators, particularly when the tabletop is narrow and/or thick. A high CG, combined with narrow isolator spacing, can cause static instability, and the table tends to rock slowly backwards and forwards about an axis midway between the two isolators. Furthermore, a dynamic instability can be experienced in the leveling system, causing the table to rock quickly from side to side.
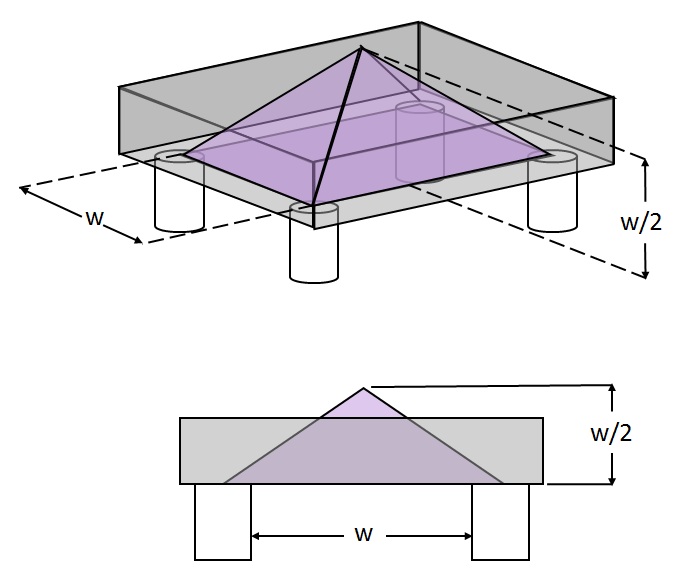
Click to Enlarge
Figure 6: The base of this pyramid is defined by
connecting the center point of each isolator, and
the height is equal to 1/2 the shortest distance
between isolators.
Static Instability
Most table systems have a CG which is above the height of the diaphragms and narrowly spaced isolators at either end of the table. Any disturbance of the tabletop causes the CG to move away from the center line between the isolators, and the weight of the table and equipment assists this sideways motion, causing the table to tilt further.
Stiffer isolators provide more stability, as tilting action is resisted by the stiffness of the isolators. However, as we concluded previously, it is softer isolators that are more effective in removing vibration. Therefore, a tradeoff must be made between isolation and stability.
It is generally accepted that in order to avoid instability and oscillation due to excessive rocking, the CG, including that of the table, should be within the pyramid shown in Figure 6.
Static instability is not dependent on the air pressure in the system or (for active systems) the adjustment of the leveling valves. If the optical table is not stable, the only solutions are either to lower the CG by purchasing accessory shelves and moving the equipment below the table's surface or to increase the distance between the optical table supports.
Dynamic Instability
In an active isolation system, the table height is controlled by leveling valves that increase or decrease the pressure of air in the optical table support reservoir. If the pressure is adjusted too rapidly, then the optical table will oscillate. This oscillation can be removed by reducing the air flow to and from the optical table supports.
When choosing optical tables and optical table supports, it is important to evaluate the sensitivity of the experiment being placed on the optical table and the vibration sources present both on the table and in the surrounding environment. The forces acting on an optical table may be static (e.g., bending or twisting as a result of a large mass being placed on the tabletop) or dynamic (e.g., vibrations from a motor placed on the tabletop). Dynamic forces may also be coupled into the table from the building itself, passing traffic, earth tremors, elevators, and other sources. Optical tables are designed to be rigid structures that damp the vibrations created on or transferred to the optical table surface while passive and active optical table supports provide vibration isolation that minimizes the transfer of external vibrations to the table surface.
Thorlabs offers an extensive array of accessories to be used with an optical table:
- Enclosure Systems can be used to increase laser safety, restrict airflow over sensitive equipment, and protect equipment from incidental contact.
- Overhead Shelving allows equipment like benchtop controllers, computers, and power supplies to be removed from the optical table surface. This frees up valuable space on the table and removes potential sources of vibration (cooling fans) from the optical table surface.
- Gas Handling Accessories are available for supplying passive and active isolation systems with compressed air.
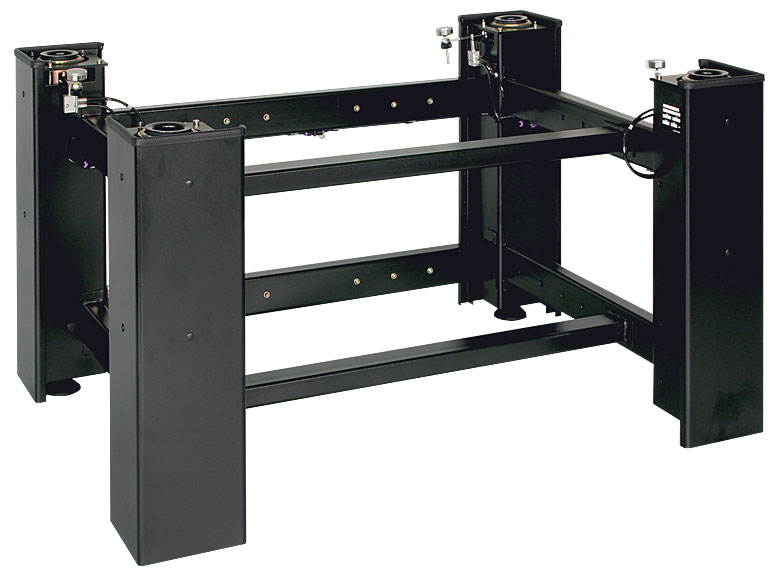
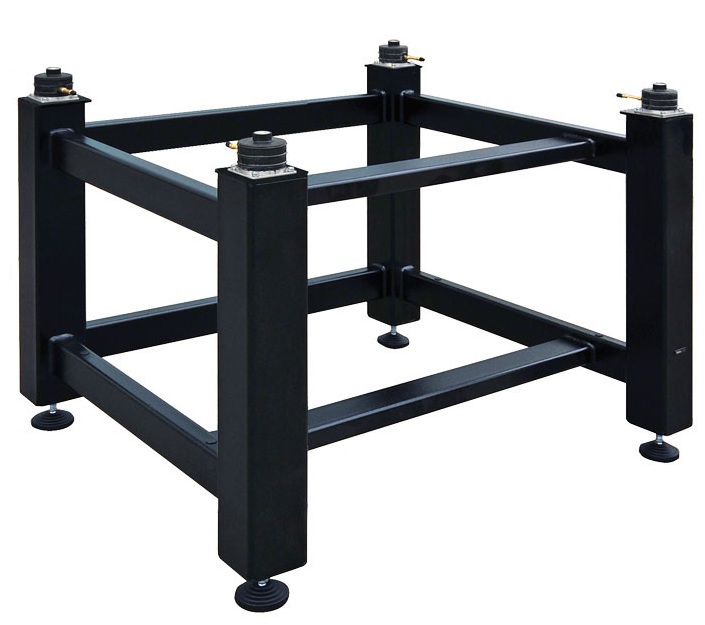
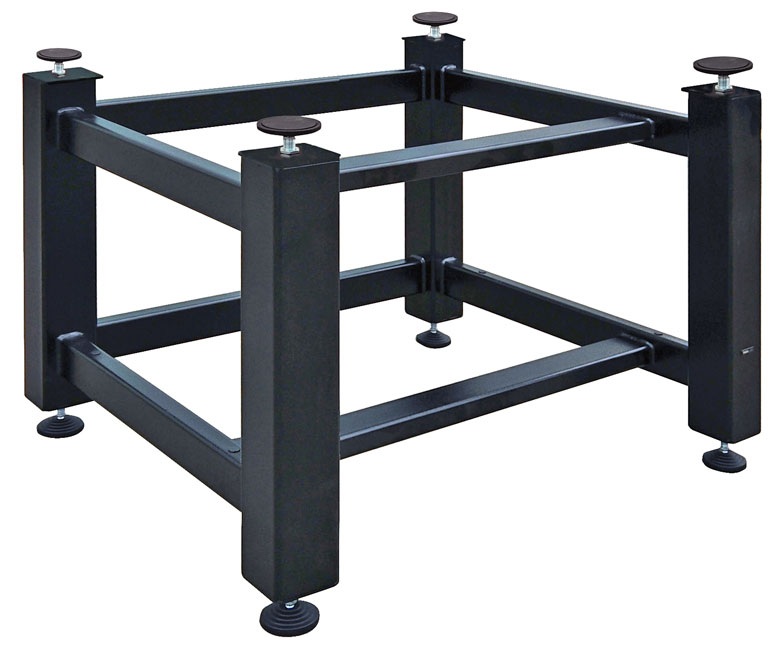
In addition to Optical Table Supports, Thorlabs also offers vibration isolation systems for breadboards, as shown below. The same three forms of vibration isolation offered for optical tables are also offered for breadboards, and each frame shown below functions similarly to the comparable optical table support (see the Isolation Systems tab for details).
| Posted Comments: | |
Fred Marbach
(posted 2024-09-19 09:26:23.3) The optical tables tutorial does not have a section on installation / tuning / trouble shooting -- that would be very helpful to include! spolineni
(posted 2024-09-30 04:52:47.0) Thank you for contacting us. I will reach out to you to provide the requested information and assist you further. darren thomson
(posted 2022-09-20 08:28:55.22) Hello, we have a room with horizontal vibrations of 3Hz that are producing strong vibrations down our microscopes lens. it jiggles quita a bit.
Would your active (or indeed passive) tables attenuate 3Hz in the horizontal plane? Many thanks Darren DJayasuriya
(posted 2022-09-22 06:48:38.0) Thank you for your inquiry. Our active optical table Supports have been tested down to 5Hz where they have a Horizontal Transmissibility of -24 dB (94% Isolation). Unfortunately, we don't have much data with regards to horizontal transmissibility of our isolation systems as 3Hz. We have got in touch with you directly to get a bit more information. Falk Renth
(posted 2021-12-09 10:39:11.357) To whom it may concern: In out workgroup, we perform ultrafast laser spectroscopy with all optical elements placed on an optical table. Typical vibrational requirements would roughly equal the VC-C range _on the table_ (!). My question is, using a typical 310-mm optical table, what would be the VC requirements of the laboratory environment ? E.g., would a lab classified as VC-A combined with an optical table guarantee VC-C (or better) for the experiment ?
Thanking you in advance,
yours sincrerely,
Falk Renth DJayasuriya
(posted 2021-12-10 11:07:36.0) Thank you for your inquiry. We will get in touch with you directly to discuss you're application. Paweł Zawadzki
(posted 2020-12-07 08:29:44.953) Dear Sir or Madam,
I'm looking for two active breadboard frames with a simple table for laboratory equipment. I want to isolate two laboratory tribotesters (200 kg and 400 kg weight) from local vibrations. Could you help me with the equipment selection?
Thank you for your help,
Yours sincerely,
Paweł Zawadzki cwright
(posted 2020-12-07 10:59:05.0) Response from Charles at Thorlabs: Hello Paweł and thank you for contacting us. We will reach out to you by email to discuss your applciation and suggest suitable equipment. Martin Bordenave
(posted 2020-02-19 16:53:03.16) Dear Sir or Madam,
My name is Martin Diego Bordenave, I work as an optical engineering at Satellogic, an Argentinean, earth-observation company.
I would like to know if you have an instrument (accelerometer or sound level meter) that could allow me to measure the vibrations conditions in our lab to see if we need to improve our isolation system.
I look forward to hearing from you.
Best regards,
Dr. Martín Diego Bordenave
Telephone: +54 11 5219 0100
e-mail: martin.bordenave@satellogic.com AManickavasagam
(posted 2020-02-24 09:41:51.0) Response from Arunthathi at Thorlabs: Thanks for your query. Unfortunately, we do not offer such instruments. However, we have resources that might help you to gauge your vibration conditions. I have contacted you directly with additional information. |