 Products Home
Wireless, Handheld Power Meters
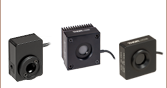
- Self-Contained Sensor and Power Meter with Built-In Graphical Display
- Si Photodiode and Thermal Sensors Available
- Rotating Sensor Arm for Measurement Flexibility
- Bluetooth and USB for Remote Operation
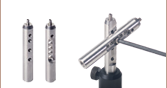
SM1-Threaded Adapter
for the PM160T
Sliding Neutral
Density Filter
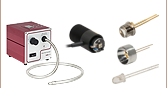
PM160T
Power Meter with High-Sensitivity Thermal Sensor
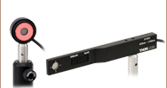
PM160 Photodiode Sensor
and Power Meter with Built-In
OLED Display
Sensor Arm
Rotates 270°
PM160T-HP
Power Meter with High-Power Thermal Sensor
SM1-Threaded Adapter for the PM160T-HP


Please Wait
| Wireless Handheld Power Meter Selection Guide | |||
|---|---|---|---|
| Item # | PM160 | PM160T | PM160T-HP |
| Sensor | Photodiode | Thermal | Thermal |
| Wavelength Range | 400 - 1100 nm | 190 nm - 10.6 µm | 190 nm - 20 µm |
| Power Detection | 10 nW - 2 mWa | 100 µW - 2 W | 10 mW - 70 Wb |
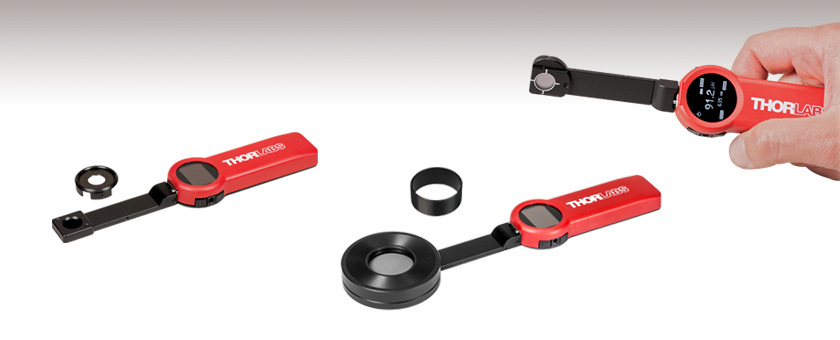
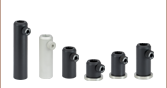
This animation shows some of the many ways that the PM160 power meter can be oriented. The PM160T and PM160T-HP power meter shares the same post-mounting and sensor-rotation features, but does not include a sliding ND filter.
Features
- Self-Contained Sensor and Power Meter Combination
- Three Power Meters Available (See Table to the Right for Key Specifications)
- Sensor Arm Rotates up to 270°
- Up to 20 Hours of Battery-Powered Operation and USB Cable is Provide for Recharging
- Graphical OLED Display for Local Operation
- Supports Remote Operation
- Recalibration Services Available
Thorlabs' Wireless Power Meters consist of an ultra-slim sensor connected to a portable power meter with a built-in graphical Organic LED (OLED) display. Versions are available with either a silicon photodiode (Item # PM160), thermal sensor (Item # PM160T), or high-power thermal sensor (Item # PM160T-HP). A rechargeable battery provides up to 20 hours of continuous operation and these power meters can be recharged through the USB port.
The PM160 power meter contains a sensitive silicon photodiode designed to detect optical powers between 10 nW and 2 mW at wavelengths between 400 and 1100 nm. The PM160 also comes with sliding neutral density filter that increases the maximum measurable optical power from 2 mW to 200 mW. The unit automatically detects the position of the neutral density filter to display the correctly calibrated power measurement. To use the filter, simply slide it up the handle until it locks into place over the detector.
Click to Enlarge
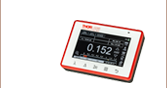
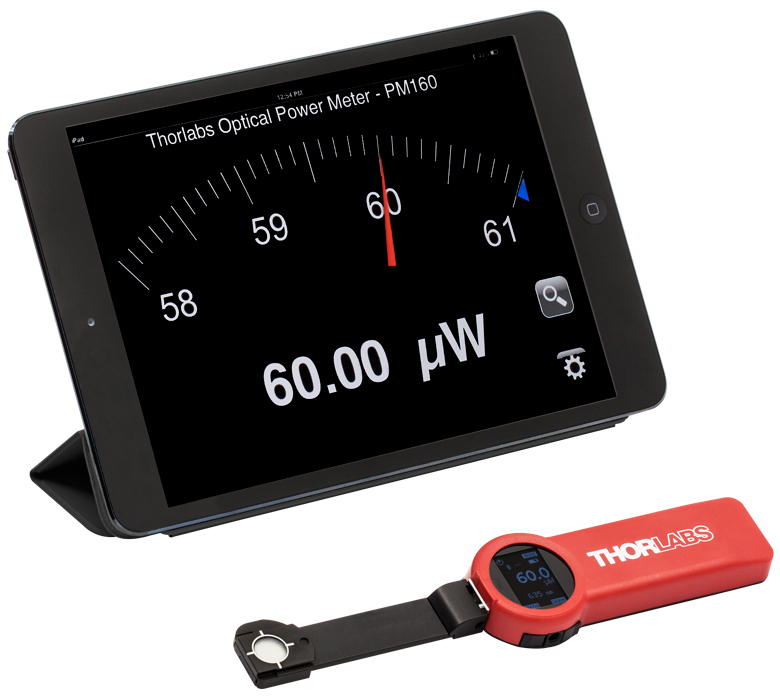
The wireless power meter, shown here with an iPad mini™ mobile device (not included), can be remotely operated using Apple mobile devices.
| Power Meter Selection Guide |
|---|
| Sensors |
| Photodiode Power Sensors |
| Thermal Power Sensors |
| Thermal Position & Power Sensors |
| Pyroelectric Energy Sensors |
| Power Meter Consoles |
| Digital Handheld Console |
| Analog Handheld Console |
| Touchscreen Handheld Console |
| Dual-Channel Benchtop Console |
| Complete Power Meters |
| Power Meter Bundles |
| Wireless Power Meters with Sensors |
| Compact USB Power Meters |
| Field Power Meters for Terminated Fibers |
| USB Interfaces, External Readout |
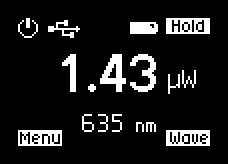
OLED Standard Measurement Display
The PM160T power meter uses the same thermal detector as our S401C High-Sensitivity Thermal Sensor Head. This power meter is designed to detect optical powers between 100 µW and 2 W at wavelengths between 190 nm and 10.6 µm. The PM106T-HP, on the other hand, is designed to detect optical powers between 10 mW and 70 W at wavelengths between 190 nm and 20 µm, offering a longer range and higher maximum power. Compared to photodiode sensors, these thermal sensors offer almost flat absorption curves, making them ideal for broadband power measurements. Combined with a wavelength range that extends into the mid-IR, the PM160T and PM160T-HP are well suited for use with a wide variety of sources including LEDs, SLDs, and mid-IR quantum cascade lasers.
These wireless power meters can fit into tight spaces and pick up an incident beam from any direction. The ultra-slim sensor end of the device connects to the handle with a joint mechanism that allows 270° of rotation (see the animation to the upper right). When rotating the sensor arm, there is a detent every 90° and enough friction in the joint mechanism that the sensor arm can be positioned at any angle within the allowed rotation range.
The output of the sensor is converted to a calibrated optical power measurement that can be displayed on the built-in OLED screen (see the screenshot to the left). The power meter can be controlled locally by the four buttons located on the sides of the OLED display's housing. The function of each button is indicated by the labels at each corner of the screen. The menus on the OLED display can also be used to rotate the text in 90° steps for ease of reading.
Alternatively, data can be transmitted using Bluetooth wireless technology or USB to an external device (see image to the left). The wireless power meter can be operated from mobile devices; both Apple® and Android apps are available from their respective app stores.
Recalibration Services
Recalibration services are available for our handheld power meters. To order this service, scroll to the bottom of the page and select the appropriate recalibration service Item # that corresponds to your power meter.
The Bluetooth® word mark is a registered trademark owned by Bluetooth SIG, Inc. and any use of such marks is under license. Other trademarks and tradenames are those of their respective owners. Android is a trademark of Google Inc. IOS is a registered trademark of Cisco in the U.S. and other countries and is used under license. App Store is a service mark of Apple Inc. iPad mini™ is a registered trademark of Apple Inc.
| Item # | PM160 | PM160T | PM160T-HP |
|---|---|---|---|
| Sensor Properties | |||
| Wavelength Range | 400 nm – 1100 nm | 190 nm - 10.6 µm | 190 nm - 20 µm |
| Optical Power Measurement Range | 10 nW – 2 mW (1 µW to 200 mW with Filter) |
100 µW – 2 W | 10 mW - 70 Wa |
| Optical Power Resolution | 100 pW (10 nW with Filter) |
10 µW | 1 mW |
| Measurement Uncertainty | ±3% (451 nm - 1000 nm) ±5% (Over Rest of Range) |
±3% (@ 1064 nm) ±5% (Entire Range) |
±3% (@ 1064 nm) ±5% (250 nm to 17 µm) |
| Power Linearity | ±1% | ||
| Active Area Uniformity | ±1% | ||
| Slideable Optical Filter | Reflective ND (OD 1.5) with Diffuser | N/A | N/A |
| Average Power Density (Max)b | 1 W/cm² (20 W/cm² with Filter) |
500 W/cm² | 2 kW/cm² |
| Sensor Aperture | Ø9.5 mm (Ø0.37") | Ø10 mm (Ø0.39") | Ø25.2 mm (Ø0.99") |
| Sensor Coating | None | Black Broadband | High Power Broadband |
| Power Meter | |||
| Built-In Display | Monochrome White OLED; 24.0 mm (0.95") Across Diagonal, 96 pixels x 64 pixels (10 Hz Refresh Rate) | ||
| Local Operation | 4 Push Buttons | ||
| Analog Measurement Rangesc | 500 nA, 50 µA, 5 mA | 1.6 mV, 25 mV, 400 mV | 2.56 mV, 16 mV, 100 mV |
| AD Converter | 24 Bit | ||
| Analog Amplifier Bandwidth | 10 Hz | ||
| Remote Interface | USB 2.0, Bluetooth (Class II) | ||
| Power Supply | External: 5 V DC via USB; Internal: LiPo+ 380 mAhd | ||
| Battery-Powered Operation | Up to 20 Hours | ||
| Dimensions | |||
| Thickness of Sensor End w/o Filter | 3.5 mm | 5.5 mm | 13.0 mm |
| Thickness of Sensor End w/ Filter | 6.0 mm | N/A | N/A |
| Distance to Sensor from Front Surface of Housing | 1.7 mm (4.2 mm with Filter) | 2.6 mm | 4.5 mm |
| Overall Dimensions | 172.7 mm x 36.4 mm x 13.0 mm (6.80" x 1.43" x 0.51") |
172.7 mm x 36.4 mm x 13.0 mm (6.80" x 1.43" x 0.51") |
206.0 mm x 56.0 mm x 13.0 mm (8.1" x 2.2" x 0.51") |
| Weight | 60 g | 60 g | 130 g |
| Mounting | |||
| Adapter Plate Aperture Thread | External SM05 (0.535"-40) | External SM1 (1.035"-40) | Internal SM1 (1.035"-40)e |
| Mounting Holes | 8-32 and M4 Tap, 3 Positions | 8-32 and M4 Tap, 3 Positions | 8-32 and M4 Tap, 3 Positions 4x 4-40 Tapped Holes on Back of Sensor for Ø6 mm Cage Rods |
| Operating Temperature | 0 to 50 °C (32 to 122 °F) | ||
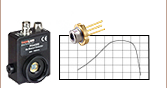
These graphs show the typical response and absorption curves for the handheld power meters. The blue-shaded regions in the graphs indicate the specified wavelength range of the power meter. Please note that these curves are representative, and the actual absorption across the spectrum will vary from unit to unit. Raw data for the graphs are available for download below; however, each individual power meter is calibrated to accurately convert the detected signal to the displayed power reading, and a unit-specific calibration certificate is included with each power meter for reference.
Click to Enlarge
Click Here for Raw Data
Typical absorption curve for the thermal sensor in the PM160T-HP.
Click to Enlarge
Click Here for Raw Data
Typical absorption curve for the thermal sensor in the PM160T.
Click to Enlarge
Click Here for Raw Data
Typical responsivity curve for the silicon photodiode in the PM160.
Compatible Power Meters
- Consoles:
- PM100A Analog Power and Energy Meter Console
- PM100D Digital Power and Energy Meter Console
- PM400 Capacitive Touchscreen Power and Energy Meter Console
- PM5020 Dual-Channel Benchtop Optical Power and Energy Meter Console (Version 4.0 or Later)
- Complete Power Meters:
- PM160, PM160T, and PM160T-HP Wireless Handheld Power Meters with Bluetooth® Technology
- PM16 Series Compact USB Power Meters
- Interfaces:
- PM101 Series Power Meter Interfaces with External Readout (Version 2.0 or Later)
- PM102 Series Power Meter Interfaces with External Readout (Version 2.1 or Later)
- PM103 Series Power Meter Interfaces with External Readout (Version 3.0 or Later)
- PM100USB USB Interface Digital Power and Energy Meter
Optical Power Monitor
The Optical Power Monitor GUI software features power measurement, readout from up to eight power meters, and remote wireless operation.
For details on specific software features, please see the user manual.
Users interested in the legacy Power Meter Software can find it by visiting the software page.
The PM101 Series Power Meters are only compatible with version 2.0 or later. The PM102 Series Power Meters are only compatible with version 2.1 or later. The PM103 Series Power and Energy Meters are only compatible with version 3.0 or later. The PM5020 Console is only compatible with version 4.0 or later.
Optical Power Monitor GUI Software for Touchscreen, Handheld, and USB-Interface Power Meters
Features
- Operate up to Eight Power Meters Simultaneously
- Record and Analyze Measurements in Real Time
- Intuitive Analog Display and Graphing Modes
- Configurable Long-Term Data Logging
- Also Supports Position Measurements with Thermal Position & Power Sensors
- Compatible with USB and Bluetooth® Connections
The Optical Power Monitor software GUI enables seamless control of up to eight power meters that are connected via USB, RS232, or Bluetooth® wireless technologya. The latest software, firmware, drivers, and utilities for these power meters can be downloaded here.
Multiple data measurement and analysis functions are integrated into the GUI package. The interface offers a user-friendly design with minimal use of color and low brightness that is ideal use in dark lab environments while wearing laser safety glasses. Measured data can be displayed in real time as a simulated analog needle, digital values, line graph, or bar graph. Continuously logged and short-term measurements can be recorded for data viewing and analysis at a later point. A built-in statistics mode analyzes measured data and continuously updates to reflect new measurements within the pre-determined measurement period. Beam position measurements are also supported when used with our thermal position & power sensors.
The Optical Power Monitor software package installs the GUI, which then can be used to control the touchscreen, handheld, or USB-interface power meters. Firmware updates for supported power meters are also available. Programming examples and drivers for interfacing with our power and energy meter consoles using LabVIEW, C/C++, Visual C#, and Python are installed with the software; refer to the manual for details.
Please note that the Optical Power Monitor Software uses different drivers than the Power Meter Utilities Software and Thorlabs recommends using the new driver TLPM.dll. For users who wish to use the legacy Power Meter Software or use custom software designed using the older PM100D.dll driver, a Power Meter Driver Switcher program is included for easy swapping of the installed driver between the two versions.
a. The PM160, PM160T, and PM160T-HP power meters are equipped with Bluetooth® connections.
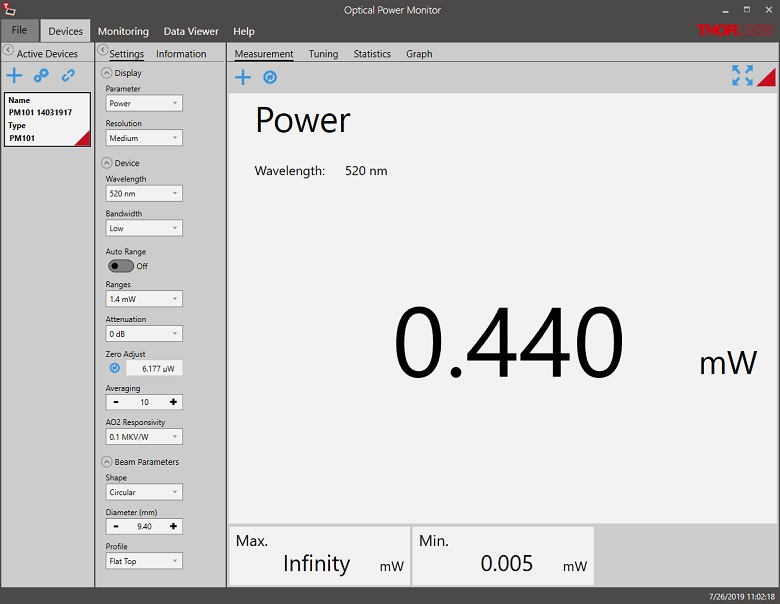
Click to Enlarge
Power Measurement Mode: Set up and configure up to eight power meters.
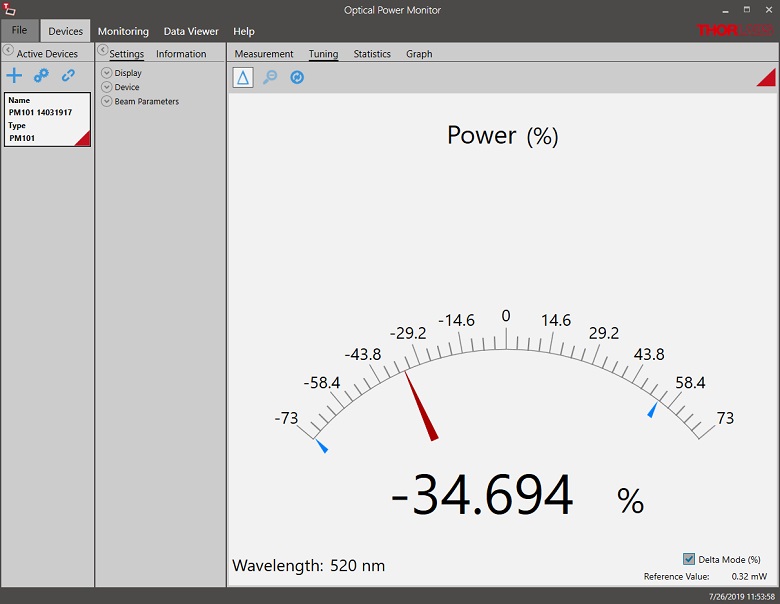
Click to Enlarge
Power Tuning Mode: Simulated analog needle and digital measurement value provided. Delta Mode, enabled above, shows the fluctuation range during the measurement period.
Click to Enlarge
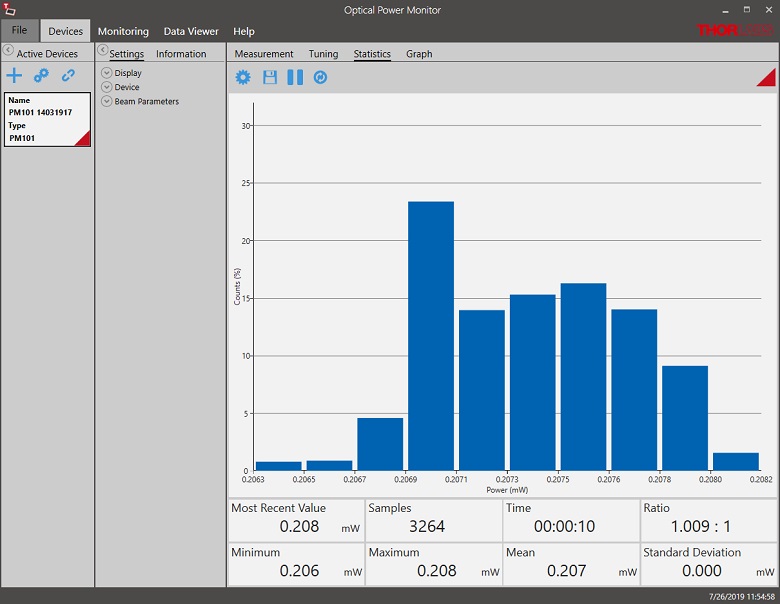
Power Statistics Mode: Calculate numerical statistics for a pre-determined measurement period. The panel displays the analyzed values in a bar graph and the results as numerical values.
Click to Enlarge
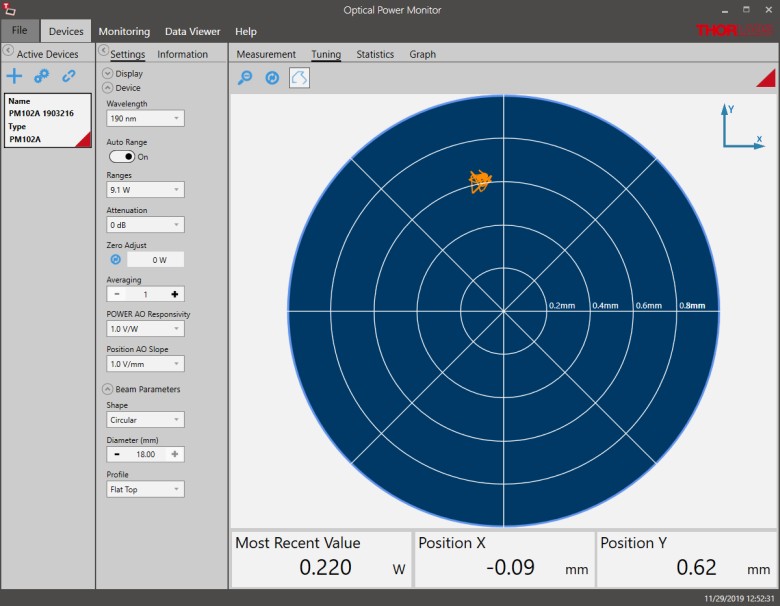
Position Tuning Mode: Tuning mode can be used with a thermal position & power sensor to aid in beam alignment.
Click to Enlarge
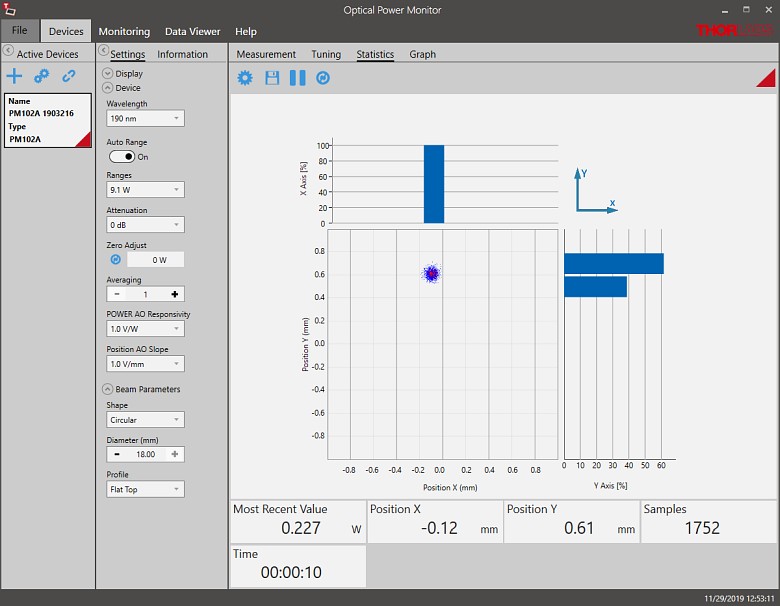
Position Statistics Mode: Statistics mode also provides aggregate information for thermal position & power sensors.
Click to Enlarge
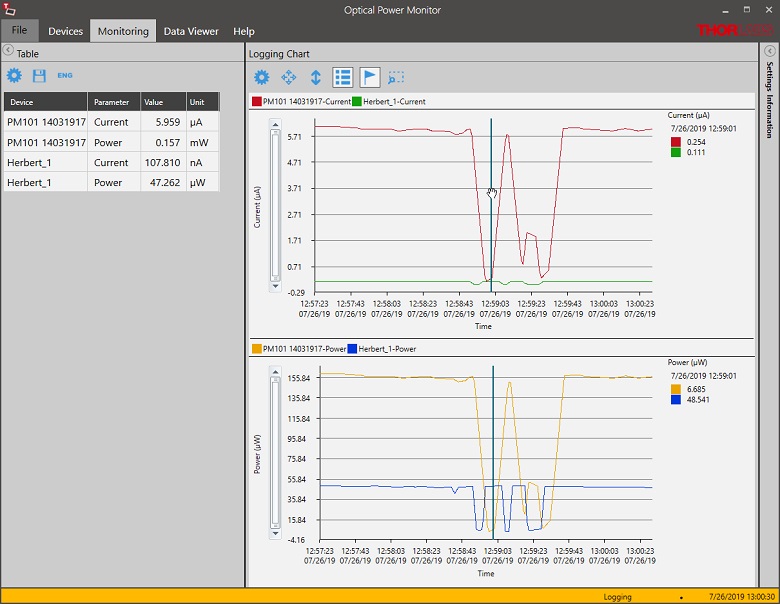
Data Logging: Enable long-term measurement and simultaneous recording from up to eight power meters. Save data as .csv files for later processing while measurement results are displayed in a graph in real time.
Pulsed Laser Emission: Power and Energy Calculations

Determining whether emission from a pulsed laser is compatible with a device or application can require referencing parameters that are not supplied by the laser's manufacturer. When this is the case, the necessary parameters can typically be calculated from the available information. Calculating peak pulse power, average power, pulse energy, and related parameters can be necessary to achieve desired outcomes including:
- Protecting biological samples from harm.
- Measuring the pulsed laser emission without damaging photodetectors and other sensors.
- Exciting fluorescence and non-linear effects in materials.
Pulsed laser radiation parameters are illustrated in Figure 1 and described in the table. For quick reference, a list of equations are provided below. The document available for download provides this information, as well as an introduction to pulsed laser emission, an overview of relationships among the different parameters, and guidance for applying the calculations.
|
Equations: |
||||
 |
and |  |
||
 |
||||
 |
||||
 |
||||
Peak power and average power calculated from each other: |
||||
 |
and |  |
||
| Peak power calculated from average power and duty cycle*: | ||||
 |
*Duty cycle ( ) is the fraction of time during which there is laser pulse emission. ) is the fraction of time during which there is laser pulse emission. |
|||
Click to Enlarge
Figure 1: Parameters used to describe pulsed laser emission are indicated in the plot (above) and described in the table (below). Pulse energy (E) is the shaded area under the pulse curve. Pulse energy is, equivalently, the area of the diagonally hashed region.
| Parameter | Symbol | Units | Description | ||
|---|---|---|---|---|---|
| Pulse Energy | E | Joules [J] | A measure of one pulse's total emission, which is the only light emitted by the laser over the entire period. The pulse energy equals the shaded area, which is equivalent to the area covered by diagonal hash marks. | ||
| Period | Δt | Seconds [s] | The amount of time between the start of one pulse and the start of the next. | ||
| Average Power | Pavg | Watts [W] | The height on the optical power axis, if the energy emitted by the pulse were uniformly spread over the entire period. | ||
| Instantaneous Power | P | Watts [W] | The optical power at a single, specific point in time. | ||
| Peak Power | Ppeak | Watts [W] | The maximum instantaneous optical power output by the laser. | ||
| Pulse Width |  |
Seconds [s] | A measure of the time between the beginning and end of the pulse, typically based on the full width half maximum (FWHM) of the pulse shape. Also called pulse duration. | ||
| Repetition Rate | frep | Hertz [Hz] | The frequency with which pulses are emitted. Equal to the reciprocal of the period. | ||
Example Calculation:
Is it safe to use a detector with a specified maximum peak optical input power of 75 mW to measure the following pulsed laser emission?
- Average Power: 1 mW
- Repetition Rate: 85 MHz
- Pulse Width: 10 fs
The energy per pulse:

seems low, but the peak pulse power is:

It is not safe to use the detector to measure this pulsed laser emission, since the peak power of the pulses is >5 orders of magnitude higher than the detector's maximum peak optical input power.
| Posted Comments: | |
Ori Weitz
(posted 2024-02-19 04:35:51.143) We have a PM-160 purchased 3 years ago. IT worked great up until 1 year ago when the battery no longer charged when the usb cable was plugged in. We had to plug in the usb cable in order whenever we wanted to take a measurement. Recently it barely works even with the usb cable plugged in. I think it is all because of the internal battery health.
Is there anything we can do to replace the internal battery?
Thank you,
Ori hchow
(posted 2024-02-20 03:22:31.0) Dear Mr. Weitz, thank you for your feedback. I am afraid that your PM160 most probably has a faulty battery. You can send it back to us for an initial inspection and most likely a battery replacement. I will personally get into contact with you and explain how best to RMA your defective device back to us. Thank you. user
(posted 2024-01-09 18:54:20.487) Is there a photodiode that goes from 400 - 1800nm, but in a version of wirelles powermter?
Or it does not exist hchow
(posted 2024-01-10 04:16:55.0) Dear User, thank you for your valuable feedback. We currently do not sell any wireless handheld power meter sensors which covers the wavelength range between 400 - 1800nm. I will personally reach out to you to discuss possible solutions. Thank you. Haojiang luan
(posted 2023-11-16 16:22:37.527) I am asking about the PM-160 power meter readings, which are typically expressed in mW (milliwatts) or uW (microwatts). However, to make sense of these readings, I need to know the area over which the power is being measured. In simpler terms, I want to know what specific area the PM-160 power meter is considering when it displays its readings. Thanks dpossin
(posted 2023-11-17 09:48:33.0) Dear Haojiang,
Thank you for your feedback. The entire sensor aperture of 9.5mm is measured. The irradiance of your beam of course depends on your beam diameter. user
(posted 2023-11-15 20:46:57.727) Hello,
Is it possible to attach to PM160T with:
1.) SM1 Adapter w/ UV Viewing Target
2.) SM1 Adapter w/ NIR Viewing Target cdolbashian
(posted 2023-12-13 03:01:52.0) Thank you for reaching out to us with this request. I have contacted you directly to clarify what you mean, and potentially facilitate this if it is a custom. user
(posted 2022-11-21 10:55:08.7) Hi, could the li-ion battery be replaced by service, if necessary? How is the battery performance after 5 or 10 years? We would prefer something long lasting. hchow
(posted 2022-11-21 08:04:45.0) Dear Customer, thank you for your feedback. Yes, the battery can be replaced if you send in your PM160 for servicing. The battery used is lithium polymer (LiPo) and is rated to retain a minimum of more than 80% of its original total charge capacity after 500 charging cycles. user
(posted 2021-11-17 01:11:48.523) Hi, I would like to ask why for power meter PM160T is impossible to set attenuation/gain factor? Neither internally, nor using pc/ios/android software. I found this setting important for a power meter. dpossin
(posted 2021-11-17 09:10:15.0) Dear Customer,
Thank you for your feedback. We tried to keep the handheld powermeters as simple as possible and therefore renounced to implement such a function. However we will include your suggestion into consideration for future engineering changes. user
(posted 2021-05-27 19:45:25.447) Hello, is there a spec for recommended relative humidity while operating the handheld power meters? MKiess
(posted 2021-06-01 06:07:24.0) Hello, thank you very much for your inquiry.
All technical data given in the specifications are valid at 23 ± 5°C and 45 ± 15% rel. humidity. michael medora
(posted 2021-03-08 08:40:45.503) Hi
We have 2 of the excellent Si photodiode PM 160 meters but we would like to record the power output over time from our lasers.
Unfortunately when we access the graph for this using biuetooth via the app on our phones and tablets this particuar function fails and the graph turns off.
Could you suggest what we might be doing erroneously and do you have a tip on how to proceed?
Many thanks
Mike MKiess
(posted 2021-03-10 09:24:12.0) Dear Michael, thank you very much for your inquiry. Via the app or the software it is possible to record the power over time in the graph panel display, save and then also export the data. I have contacted you directly for further assistance. Y BoH
(posted 2020-12-11 21:10:48.143) This is overall a fantastic product. But Thorlabs can make it even better. The iOS software on AppStore is so outdated and buggy to use(so is the Android version). There is no way to disable the auto ranging function (which also reads 99.99kW when shifting to a higher power range and screws up analog meter on phone app and max hold number). PM160T in principle can handle 2W of laser power but the front surface near the sensor is made of plastic and catch on fire every time when a laser beam sweep across it. Even the S130C photodiode power sensor(500mW rated) has a metal casing, why PM160T does not have one? MKiess
(posted 2020-12-16 07:21:33.0) Thank you for your feedback. Feedback like this regarding our products really help us to constantly improve and further develop our products. I have contacted you directly to discuss the possibilities of improvement. Doug Holmgren
(posted 2020-03-04 20:07:54.96) I am attempting to update the PM160 firmware from v1.2 to v1.3 using the firmware update tool included in the Optical Power Monitor software package. The update proceeds to about 27%, then halts with the message "User abort the download operation". Fortunately by disconnecting the PM160 USB connection, the PM160 restarts (still at v1.2). It appears v1.3 fixes issues with iPhone/iPad connections, so is not critical? There are no other fixes in 1.3? MKiess
(posted 2020-03-06 05:08:27.0) This is a response from Michael at Thorlabs. Thank you for the feedback. For the firmware update process, the power meter must be switched to another USB class (from TMC to DFU). The PC then detects and installs the new upgrade device. Depending on the speed of the computer this process can take a certain time and therefore in some cases cause a timeout error, with the described effect.
Many thanks for this information. We started immediately working on a version of OPM that can handle this issue. The new installer will be available online soon. I contacted you directly to keep you informed. Itay Peled
(posted 2019-12-01 07:35:56.28) Hi
I'm trying to use the new TLPM driver on Python (3)
I put the DLL file (TLPM_64.dll) in my folder and load it successfully with ctypes.CDLL command.
When calling the "TLPM_findRsrc" method I receive a successful return but it stuck the python session and prints the following error:
----------------------------------------------------------------------------
Exception in thread Thread-1:
Traceback (most recent call last):
File "C:\python\python37\lib\threading.py", line 926, in _bootstrap_inner
self.run()
File "C:\python\python37\lib\threading.py", line 870, in run
self._target(*self._args, **self._kwargs)
File "C:\Program Files\JetBrains\PyCharm Community Edition 2019.1.2\helpers\pydev\_pydev_comm\transport.py", line 64, in _read_forever
self._read_and_dispatch_next_frame()
File "C:\Program Files\JetBrains\PyCharm Community Edition 2019.1.2\helpers\pydev\_pydev_comm\transport.py", line 37, in _read_and_dispatch_next_frame
direction, frame = self._read_frame()
File "C:\Program Files\JetBrains\PyCharm Community Edition 2019.1.2\helpers\pydev\_pydev_comm\transport.py", line 45, in _read_frame
buff = readall(self._socket.recv, 4)
File "C:\Program Files\JetBrains\PyCharm Community Edition 2019.1.2\helpers\pydev\_pydev_comm\io.py", line 110, in readall
chunk = read_fn(sz - have)
ConnectionAbortedError: [WinError 10053] An established connection was aborted by the software in your host machine
0
Traceback (most recent call last):
File "C:\Program Files\JetBrains\PyCharm Community Edition 2019.1.2\helpers\pydev\_pydev_bundle\pydev_code_executor.py", line 112, in add_exec
self.finish_exec(more)
File "C:\Program Files\JetBrains\PyCharm Community Edition 2019.1.2\helpers\pydev\_pydev_bundle\pydev_console_utils.py", line 211, in finish_exec
return server.notifyFinished(more)
File "C:\Program Files\JetBrains\PyCharm Community Edition 2019.1.2\helpers\pydev\_pydev_comm\transport.py", line 226, in _req
return super(TSyncClient, self)._req(_api, *args, **kwargs)
File "C:\Program Files\JetBrains\PyCharm Community Edition 2019.1.2\helpers\third_party\thriftpy\_shaded_thriftpy\thrift.py", line 157, in _req
self._send(_api, **kwargs)
File "C:\Program Files\JetBrains\PyCharm Community Edition 2019.1.2\helpers\third_party\thriftpy\_shaded_thriftpy\thrift.py", line 169, in _send
self._oprot.trans.flush()
File "C:\Program Files\JetBrains\PyCharm Community Edition 2019.1.2\helpers\pydev\_pydev_comm\transport.py", line 132, in flush
self._get_writer().write(struct.pack("!i", len(out)) + out)
File "C:\Program Files\JetBrains\PyCharm Community Edition 2019.1.2\helpers\pydev\_pydev_comm\transport.py", line 84, in write
self._socket.sendall(buf)
OSError: [WinError 10093] Either the application has not called WSAStartup, or WSAStartup failed
------------------------------------------------------------------
Any idea what is wrong and how can I make it work?
Thanks wskopalik
(posted 2019-12-04 11:39:38.0) This is a response from Wolfgang at Thorlabs. Thank you for your feedback!
This error could be due to an issue in the TLPM driver. I will contact you directly so we can find a solution. veeranna daravath
(posted 2019-09-20 14:24:15.607) Dear thorlab,
Iam planing to purchase this device to measure power of He Ne laser MKiess
(posted 2019-10-01 06:30:06.0) This is an answer from Michael von Thorlabs. Thank you very much for your inquiry. All three of our wireless portable power meters (PM160, PM160T, PM160T-HP) are suitable for measuring the wavelength of a typical He-Ne laser. Which of the sensors and whether one of them is suitable for you depends on the exact specifications of your laser and the application of the sensor. I have contacted you directly to discuss further details. martin.possolt
(posted 2018-12-17 12:36:34.33) Hello again.. if there is no way I can get the current value of the meter to Python, can I ask for the samples codes for Matlab? I read here in a previous post it is possible to read the current value. Thank you nreusch
(posted 2018-12-18 10:44:03.0) This is a response from Nicola at Thorlabs. Thank you very much for your inquiry. We know that customers have used python to read out our power meters, but we cannot provide a sample code yet. I will send you a guide with recommendations for the implementation in Matlab via e-mail. martin.possolt
(posted 2018-12-10 13:52:24.09) Hello, is it possible to read the current value of the meter in Python? Or at least trigger measurement from Python so I could then load the log file? Is there a sample code or programming manual somewhere? nreusch
(posted 2018-12-18 10:43:15.0) Please find my response under your second post. j.stirling
(posted 2018-12-06 18:07:42.783) The fact that this very simple device required a Windows driver to run is infuriating for a Linux user. I have spectrum analysers from the 1970s which still talk of GPIB to any operating system without drivers. There are no shortage of open USB protocols from simple usb over serial using a cheap FTDI chip to USBTMC.
I guarantee that in a decade the old HP spectrum analysers will still talk to all computers whether windows or not, because GPIB is an open standard. But as soon as you are bored of keeping drivers up to date on this device it becomes a rather under-weight paperweight. To a lab already running linux it is fairly useless, I could get a specific machine to run it, but that would be mental. I could place a nice shiny screened iPad on the optical bench at 45 degrees and blind everyone with stray beams.
Communication standard exist for a reason. So that YOU don't have to specifically support every device and operating system under the sun, and so that I don't have to use the exact systems you wrote it for.
Pathetic! nreusch
(posted 2018-12-18 10:33:51.0) This is a response from Nicola at Thorlabs. Thank you very much for your feedback and I do understand your disappointment. We are aware of the demand for Linux support and are already working on it. Just recently, we finalized Linux drivers for our USB power meters, but unfortunately the bluetooth integration is not available yet. You can also communicate with the PM160 via bluetooth by using SCPI commands. We also know that customers have successfully implemented our power meters by means of a native USB module using the USBTMC protocol. Please contact us if you have any questions. S.Zhang.3
(posted 2018-11-22 12:43:45.18) At this moment, the power meter can not turn on, can you help to solve it? swick
(posted 2018-11-30 03:17:17.0) This is a response from Sebastian at Thorlabs. Thanks you for the inquiry.
I contacted you directly for troubleshooting. b.povazay
(posted 2018-01-09 08:47:02.143) Is it possible to sample and hold the Data or log a sequence without supervision with the wireless powermeter? - For example: We need to place the device into a sample chamber that is not accessible visually or via bluetooth and I want to be able to monitor the maximum value of exposure.
Best regards! wskopalik
(posted 2018-01-11 11:36:39.0) This is a response from Wolfgang at Thorlabs. Thank you very much for your feedback.
The power meters of the PM160 series do not have a logging function on the meter, but only in the software. The meters themselves only show the current power values. They can however be read out through a Bluetooth or USB connection and the software can log the measurement values for further evaluation.
I will contact you directly to discuss your application in further detail. chenav
(posted 2017-09-18 21:47:10.97) Amazon product. Very useful. But, it would be nice to have a POWER symbol engraved next to the power button, on the /front/ of the device as well. Right now the user must turn the device around to see which button powers it up. Cheers. wskopalik
(posted 2017-09-19 03:19:26.0) This is a response from Wolfgang at Thorlabs. Thank you very much for your feedback.
I have forwarded it to our R&D department so it can be taken into account for future developments in this product range. kaccie
(posted 2017-06-12 13:54:41.763) Would you guys consider releasing code for the iOS app? All the available code examples are windows and we mainly use macs at my company. An Xcode project would help immensely. Thank you swick
(posted 2017-08-01 03:27:52.0) This is a response from Sebastian at Thorlabs. Thank you for the inquiry. I am sorry but we are not allowed to share X-Code project. eprend
(posted 2017-03-21 10:00:50.83) I would appreciate it if the Solidworks information was available for the SM1 adapter that comes with the power meter. The 2D drawing does not provide enough information to reconstruct the part and after speaking with technical support there is no other way to get this part. Thorlabs is pretty good about having part information ready for download seems like it would be easy to construct this part so it is available. swick
(posted 2017-03-22 04:56:54.0) This is a response from Sebastian at Thorlabs. Thank you for the inquiry.
The SM1-adapter which is included to PM160T is the same mechanical part as for our S130C-Series (SM1A29). The main difference is that for PM160T the adapter has a viewing target (fluorescent ring) made out of VRC6 instead of VRC1.
As only the viewing target is different the CAD file of SM1A29 can be used:
https://www.thorlabs.com/_sd.cfm?fileName=23425-E0W.sldprt&partNumber=SM1A29 user
(posted 2015-07-27 18:55:02.28) It would be nice if there were an update for wavelength presets. We bought one and now, everytime we change the laser line, we have to dial in the new wavelength, which takes quite a bit. Would be great if there were like 5 or so presets, just like the big units offer. shallwig
(posted 2015-07-28 08:39:20.0) This is a response from Stefan at Thorlabs. Thank you very much for your inquiry. We are discussing if such feature can be implemented with the next update but due to its small design in terms of display size we have to make sure to arrange that in a way not to lose clarity. I would like to discuss that with you in in more detail but unfortunately you left no Email address, please feel free to contact me at europe@thorlabs.com dmkim
(posted 2015-07-27 09:34:01.64) A short example on how to get the power read in Matlab would be very useful! shallwig
(posted 2015-07-29 05:33:05.0) This is a response from Stefan at Thorlabs. Thank you very much for your inquiry. We have a MATLAB example for the PM160 as for the other power meters. We have contacted you directly and sent you the MATLAB example. user
(posted 2014-12-01 16:08:04.653) The iOS app I downloaded has the wavelength range max and min reversed. Thus it will not accept any wavelength I try to enter making the power meter almost useless. Didn't anybody actually try using the software before releasing it??? shallwig
(posted 2014-12-02 05:23:04.0) This is a response from Stefan at Thorlabs. Thank you very much for your inquiry. Unfortunately we were not able to reproduce your problem neither with the first version nor with the updated version of the IOS App. By clicking on the wavelength symbol you should be able to enter the wavelength at which you want to measure directly. Alternatively you can set it by sliding the bar below to the desired value. As you left no contact information can you please contact me at europe@thorlabs.com to discuss this problem in more detail? Thank you. ivan
(posted 2014-08-08 12:44:56.1) Hello,
What is the value of this product put to Brazil via Fedex?
1 pc - PM-160 - Wireless Handheld Meters Power
Country: Brazil
City: Sao Paulo
State:
Cesar Ramos R. Penna, 1087, São Paulo - SP, 02563-001
Thank you
Ivan Maranhão
www.orbebrasil.com.br shallwig
(posted 2014-08-11 02:54:21.0) This is response from Stefan at Thorlabs. Thank you very much for your inquiry. We will contact you directly to provide you with this information. tschlosser
(posted 2014-06-04 11:04:50.303) Hello, the animation video on the Overview tab is not working. Thank you. lmorgus
(posted 2014-06-04 12:04:58.0) A response from Laurie at Thorlabs: I apologize that our animation was not working correctly. We recently migrated all our animations to a new platform, and this one was missed. We've corrected the error in our code, and the animation should work as expected now. Thanks so much for taking the time to point out the error so that we could get it updated. user
(posted 2014-02-25 22:01:07.95) I want an Android version application! jvigroux
(posted 2014-02-26 03:46:22.0) a response from Julien at Thorlabs: Thank you for your feedback! Unfortunately we are still working on this project and are only quite at the beggining so that the timeline is not yet fully defined. We would nonetheless be happy to keep you updated about the progress we make and possibly share with you some beta versions as we go along. Please contact us at techsuport@thorlabs.com if this woulld be of interrest for you. user
(posted 2013-12-24 19:16:12.69) All I want for the holidays is an Android App for the PM160. jvigroux
(posted 2014-01-07 09:24:50.0) A reponse from Julien at Thorlabs: Thank you for your feedback! we have started owkring on this project and hope to be able to release such an app in the upcoming months. Please feel free to contact techsupport@thorlabs.com if you would like to be informed when we will have the app ready. shallwig
(posted 2014-04-22 04:42:03.0) This is a response from Stefan at Thorlabs. Thank you very much for your feedback and your patience. An android App for the PM160 power meter is available now. You can find the app here:
https://play.google.com/store/search?q=thorlabs thomas.huemmer
(posted 2013-09-18 11:34:17.777) What can the iOS app actually do? Is it as powerful as the windows GUI? Can i configure the wavelength and other things via iOS? Can it display a Graph? And if not, are there plans to implement this? tschalk
(posted 2013-09-20 11:23:00.0) This is a response from Thomas at Thorlabs. Thank you very much for your inquiry. The iOS App is a tool to display the power measured by a PM160 wireless power meter on the screen of an iphone or ipad. It is not as powerful as the windows GUI and you are not able to store data or perform graphical analysis. The wavelength is able to be set via the App and can be used without a PM160 connected. user
(posted 2013-07-17 11:44:21.113) Is there anyway to get a revision of this with a power head that reads up to 500mW? This woud be useful on the 2 Photon systems with the 4W lasers that are utilized in the systems. tschalk
(posted 2013-07-18 09:35:00.0) This is a response from Thomas at Thorlabs. Thank you very much for your inquiry. We can offer a special item which is able to measure optical power up to 500mW. Please contact me if you need more detailed information: europe@Thorlabs.com cbrideau
(posted 2013-06-17 19:38:29.073) This needs an Android app! I would love to use it with my tablet. tschalk
(posted 2013-06-28 07:51:00.0) This is a response from Thomas at Thorlabs. Thank you very much for your inquiry. We plan to release an Android App by the end of the year. user
(posted 2013-06-14 08:02:20.54) "The PM160 app is available in Apple's AppStore." I cannot find it. A link would be great. lmorgus
(posted 2013-06-14 09:11:00.0) A response from Laurie at Thorlabs to the previous poster: Thank you for noting that you couldn't find the app we mention at Apple's AppStore. We double checked with them and determined that the app will be posted at their store in the coming weeks. We will add a direct link as soon as it is available on their site. |

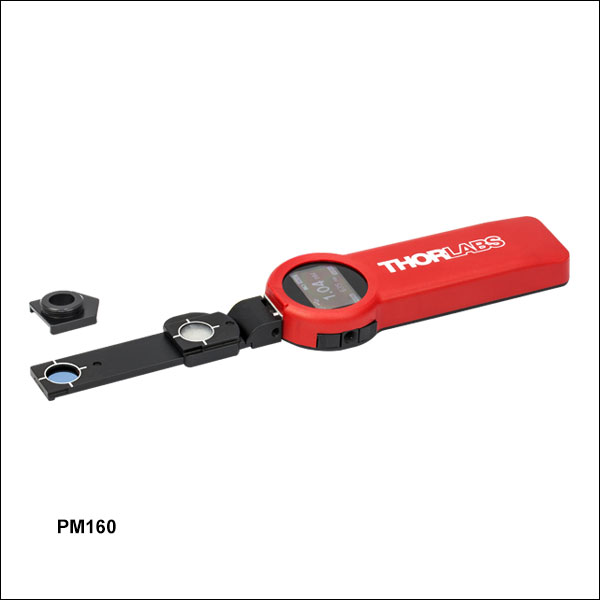 Zoom
Zoom- PM160 Optical Power Meter
- SM05 Adapter
- 1.5 m Long USB Cable w/ USB
Type A and Micro B Connectors - Certificate of Calibration
- Quick Reference User Manual
- Sensor for the 400 - 1100 nm Range
- Measures Optical Powers from 10 nW to 2 mW and up to 200 mW with Sliding Neutral Density (ND) Filter
- Ultra-Slim 3.5 mm Thick Sensor End (6 mm with ND Filter)
- Includes Detachable SM05-Threaded Adapter
The PM160 Wireless Power Meter consists of a sensitive Silicon photodiode connected to a portable power meter with a built-in graphical Organic LED (OLED) display. The Ø9.5 mm (Ø0.37") sensor is designed to detect optical powers between 10 nW and 2 mW at wavelengths between 400 and 1100 nm. The PM160 also comes with a sliding neutral density filter that increases the maximum measurable optical power from 2 mW to 200 mW. The unit automatically detects the position of the neutral density filter to display the correctly calibrated power measurement. To use the filter, simply slide it up the handle until it locks into place over the detector.
Each individual PM160 power meter is calibrated to accurately convert the detected signal to the displayed power reading and a unit-specific calibration certificate is included. To ensure accurate measurements, we recommend recalibrating this power meter annually. Recalibration can be ordered using Item # CAL-PD2 below.
Three taps compatible with 8-32 and M4 screws allow the power meter to be post mounted in a variety of orientations. The device is shipped with an externally SM05 (0.535"-40) threaded adapter plate that slides over either the filter housing or the end of the sensor arm and snaps into place. When the adapter plate is attached to the sliding ND filter, the entire assembly can still be moved up and down the sensor arm. The external SM05 threads allow other components, such as fiber connector adapters (see the table to the lower right), to be attached directly to the PM160. We recommend operating the PM160 wireless power meter in environments between 0 and 50 °C (32 to 122 °F).
| Item # | PM160a |
|---|---|
| Wavelength Range | 400 - 1100 nm |
| Optical Power Measurement Range | 10 nW - 2 mW (1 µW to 200 mW w/ Filter) |
| Max Average Power Densityb | 1 W/cm² (20 W/cm² w/ Filter) |
| Optical Power Resolution | 100 pW (10 nW w/ Filter) |
| Measurement Uncertainty | ±3% (451 - 1000 nm) ±5% (Over Rest of Range) |
| Sliding Optical Filter | Reflective ND (OD 1.5) with Diffuser |
| Sensor Responsivity (Click for Graph) |  |
| Distance to Sensor from Top Surface of Housing |
1.7 mm (4.2 mm w/ Filter) |
| Sensor Aperture | Ø9.5 mm (Ø0.37") |

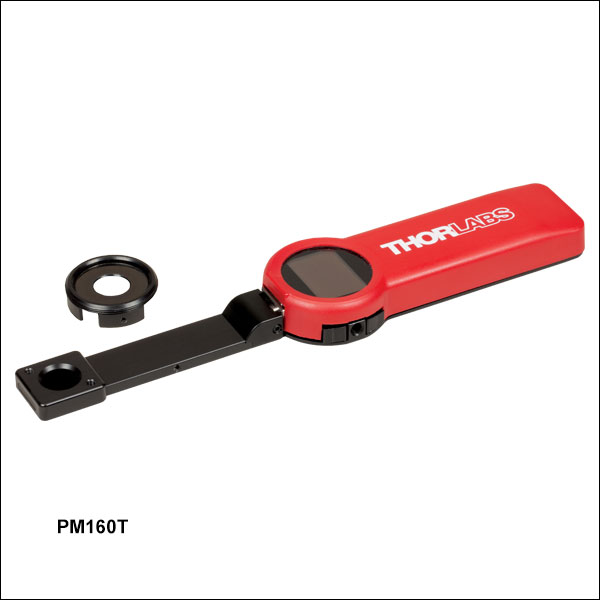 Zoom
Zoom- PM160T Optical Power Meter
- SM1 Adapter w/ MIR Viewing Target
- 0.9 mm (0.035") Hex Key
- 1.5 m Long USB Cable w/ USB
Type A and Micro B Connectors - Certificate of Calibration
- Quick Reference User Manual
- Thermal Sensor for the 190 nm - 10.6 µm Range
- Measures Optical Powers from 100 µW to 2 W
- Ultra-Slim 5.5 mm Thick Sensor End
- Includes Detachable SM1-Threaded Adapter with MIR Viewing Target
The PM160T Wireless Power Meter consists of an ultra-slim thermal sensor connected to a portable power meter with a built-in graphical Organic LED (OLED) display. The Ø10 mm (Ø0.39") sensor is designed to detect optical powers between 100 µW and 2 W at wavelengths between 190 nm and 10.6 µm. The almost flat absorption curve of the detector, maximum power of 2 W, and wavelength range that extends into the MIR make the PM160T well suited for use with a wide variety of broadband and MIR light sources, including LEDs, SLDs, and MIR quantum cascade lasers.
Each individual PM160T power meter is calibrated to accurately convert the detected signal to the displayed power reading and a unit-specific calibration certificate is included. To ensure accurate measurements, we recommend recalibrating this power meter annually. Recalibration can be ordered using Item # CAL-THPY below.
Three universal taps compatible with 8-32 and M4 screws allow the power meter to be post mounted in a variety of orientations. The device is shipped with an externally SM1 (1.035"-40) threaded adapter plate with an MIR viewing target. This target is fabricated from thermochromic liquid crystal material and reacts to light from 1500 nm to over 13.2 µm. To install the adapter, place it over the sensor and secure it by tightening the setscrew with the included 0.9 mm (0.035") hex key. The external SM1 threads allow other components, such as fiber connector adapters (see the table to the lower right for recommendations), to be attached directly to the PM160T. We recommend operating this wireless power meter in environments between 0 and 50 °C (32 to 122 °F).
| Item # | PM160Ta |
|---|---|
| Wavelength Range | 190 nm - 10.6 µm |
| Optical Power Measurement Range | 100 µW - 2 W |
| Max Average Power Densityb | 500 W/cm² |
| Optical Power Resolution | 10 µW |
| Measurement Uncertainty | ±3% (1064 nm) ±5% (Entire Range) |
| Sensor Coating | Black Broadband |
| Sensor Absorption (Click for Graph) |  |
| Distance to Sensor from Top Surface of Housing |
2.6 mm |
| Sensor Aperture | Ø10 mm (Ø0.39") |

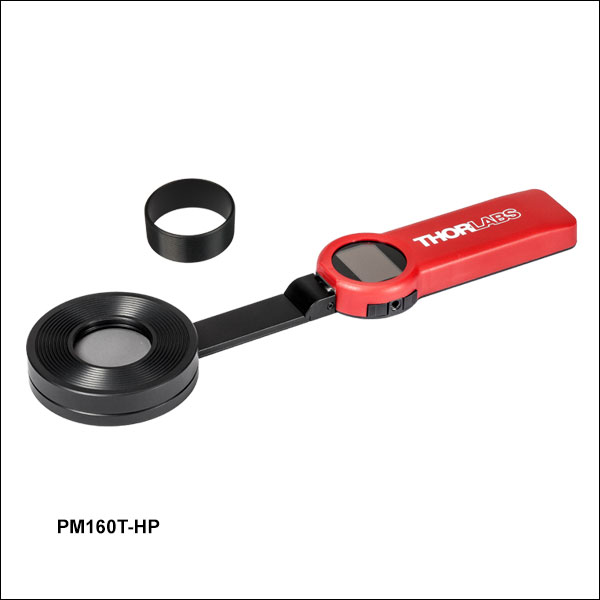 Zoom
Zoom- PM160T-HP Optical Power Meter
- External SM1 Thread Adapter
- 1.5 m Long USB Cable w/ USB
Type A and Micro B Connectors - Certificate of Calibration
- Quick Reference User Manual
- Thermal Sensor for the 190 nm - 20 µm Range
- Measures Optical Powers from 10 mW to 70 W
- Slim 13.0 mm Thick Sensor End
- Includes Externally SM1-Threaded (1.035"-40) Adapter for Compatibility with Fiber Adapters
The PM160T-HP Wireless Power Meter consists of a slim thermal sensor connected to a portable power meter with a built-in graphical Organic LED (OLED) display. The Ø25.2 mm sensor is designed to detect optical powers between 10 mW and 70 W at wavelengths between 190 nm and 20 µm. The almost flat absorption curve of the detector, maximum power of 70 W, and wavelength range that extends into the MIR make the PM160T-HP well suited for use with a wide variety of broadband and MIR light sources, including LEDs, SLDs, and MIR quantum cascade lasers.
Each individual PM160T-HP power meter is calibrated to accurately convert the detected signal to the displayed power reading and a unit-specific calibration certificate is included. To ensure accurate measurements, we recommend recalibrating this power meter annually. Recalibration can be ordered using Item # CAL-THPY below.
Three universal taps compatible with 8-32 and M4 screws allow the power meter to be post mounted in a variety of orientations. The device is shipped with an externally SM1 (1.035"-40) threaded adapter. To install the adapter, screw it into the internal SM1 threads on the sensor housing. The external SM1 threads allow other components, such as fiber connector adapters (see the table to the lower right for recommendations), to be attached directly to the PM160T-HP. We recommend operating this wireless power meter in environments between 0 and 50 °C (32 to 122 °F).
| Item # | PM160T-HPa |
|---|---|
| Wavelength Range | 190 nm - 20 µm |
| Optical Power Measurement Rangeb | 10 mW - 70 W |
| Max Average Power Densityc | 2 kW/cm² |
| Optical Power Resolution | 1 mW |
| Measurement Uncertainty | ±3% (1064 nm) ±5% (250 nm to 17 µm) |
| Sensor Coating | High-Power Broadband |
| Sensor Absorption (Click for Graph) | |
| Distance to Sensor from Top Surface of Housing |
4.5 mm |
| Sensor Aperture | Ø25.2 mm (Ø0.99") |
| Calibration Service Item # | Compatible Power Meter |
|---|---|
| CAL-PD2 | PM160 |
| CAL-THPY | PM160T, PM160T-HP |
Thorlabs offers recalibration services for our wireless power meters. To ensure accurate measurements, we recommend recalibrating power meters annually.
Refer to the table to the right for the appropriate calibration service Item # that corresponds to your power meter.
Requesting a Calibration
Thorlabs provides two options for requesting a calibration:
- Complete the Returns Material Authorization (RMA) form. When completing the RMA form, please enter your name, contact information, the Part #, and the Serial # of the item being returned for calibration; in the Reason for Return field, select "I would like an item to be calibrated." All other fields are optional. Once the form has been submitted, a member of our RMA team will reach out to provide an RMA Number, return instructions, and to verify billing and payment information.
- Select the appropriate calibration Item # below, enter the Part # and Serial # of the sensor that requires recalibration, and then Add to Cart. A member of our RMA team will reach out to coordinate return of the item for calibration. Should you have other items in your cart, note that the calibration request will be split off from your order for RMA processing.
Please Note: To ensure your item being returned for calibration is routed appropriately once it arrives at our facility, please do not ship it prior to being provided an RMA Number and return instructions by a member of our team.