 Products Home
Power Meter and Sensor Tutorial

Please Wait
Power Meter Measurements
Thorlabs' power meter consoles have the ability to recognize the connected sensor type as well as its responsivity. The measured output signal depends on the sensor type. In addition, Thorlabs' Power Meter Consoles are capable of displaying the photocurrent or voltage delivered by the sensor. The equivalent of the measured value is also provided at the analog output.
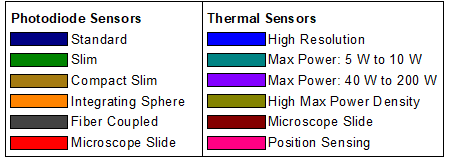
Photodiode Sensors

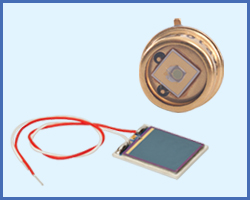
Photodiode sensors deliver a current that depends on the optical power and wavelength of the incident beam. This current is fed into a transimpedance amplifier, which outputs a voltage that is proportional to the input current. The photodiode's individual calibration data (responsivity vs. wavelength) is saved to the EEPROM in the sensor's DB9 connector. Since the photodiode's responsivity depends on the wavelength, the actual wavelength needs to be entered to obtain an accurate measurement. The power meter console determines the responsivity for the input wavelength from the connected sensor and calculates the optical power from the measured photocurrent.
Thermal Sensors

Thermal sensors deliver a voltage that is proportional to the input optical power. The sensor's individual responsivity is saved to its EEPROM and read by the console. Based on the measured sensor output voltage and its responsivity, the console calculates the optical power incident upon the sensor.
Energy Sensors

Energy sensors are based on the pyroelectric effect. Hence, they deliver a peak voltage that is proportional to the pulse energy. The individual sensor's responsivity is saved to its EEPROM. If a pyrosensor is recognized, the console automatically detects the peak voltage and calculates the pulse energy from the responsivity.
How a Photodiode Works
Typical Properties of Photodiodes
| Photodiode | Wavelength Range |
Max Powerb |
|---|---|---|
| Si - UVa | 200 - 1000 nm | 3 - 5 mW |
| Si | 400 - 1100 nm | |
| Ge | 700 - 1800 nm | |
| InGaAs | 800 - 1700 nm |
A photodiode (PD) is a semiconductor p-n junction. When photons of sufficient energy hit the p-n junction, they excite electrons, resulting in a current in the junction. Photodiodes can be operated in photovoltaic or photoconductive mode. In photovoltaic mode, the anode and the cathode are connected to a load so the photodiode delivers a current. In photoconductive mode, the photodiode is biased in the reverse direction, and the reverse current depends on the incident optical power. Reverse biasing significantly decreases the reaction time to incident photons. Consequently, the photoconductive mode is used in high-speed photodetectors. The temperature dependency of the PD current, however, is a downside of the photoconductive mode.
In power measurement applications, photodiode sensors are used in photovoltaic mode. The anode and cathode are connected to the input of a transimpedance amplifier that converts the photocurrent into a voltage. A photodiode can deliver a photocurrent up to several mA. The responsivity of a photodiode is the ratio of delivered current to incident optical power and is usually stated in A/W. This responsivity depends significantly on the material the photodiode is made from as well as the wavelength of the incident optical power. The maximum output current of a photodiode is limited to the linear part of the characteristic IPD = f (Poptical) curve, or in other words, by the saturation.
To extend the maximum measurable power to tens of milliwatts, an attenuator is placed in front of the photodiode. Usually this attenuatior is a neutral density (ND) filter. Like the responsivity, the optical density of an ND filter is also wavelength dependent. Over time, a photodiode's responsivity will change as a result of aging. For very small beam diameters, variations in photodiode sensor uniformity may lead to discrepancies in the output current. If the PD sensor's active area is overfilled, incorrect readings may result.
How an Integrating Sphere Sensor Works

The inner surface of an integrating sphere has a high reflectance over a wide wavelength range. It is manufactured from PTFE based high reflective bulk material and is resistant to heat, humidity, and high levels of radiation.
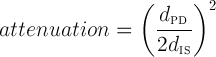
The incoming light beam is diffusely reflected from the inner surface of the sphere, which creates an even intensity distriution over the entire sphere surface. A photodiode is recessed inside a detector port to avoid exposure from incidental light. Therefore, the attenuation of the light detected by the photodiode is proportional to the active area of the detector divided by the surface area of sphere. If dPD is the diameter of the detector's active area and dIS is the inner diameter of the integrating sphere, then the attenuation can be written as:
How a Thermal Power Sensor Works
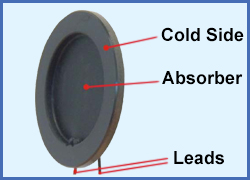
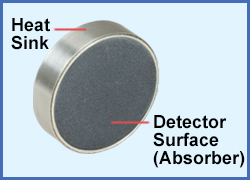
Thermal power sensors incorporate thermocouples and utilize the principles laid out in the thermoelectric effect (aka the Seebeck Effect), which state that any conductor subjected to a thermal gradient generates a voltage. Hence, if a temperature difference is present between two surfaces, the temperature gradient will generate a voltage difference between these two surfaces. This process can be thought of as the inversion of the Peltier effect.
In a thermal power sensor, the power of the incident laser beam is absorbed by the incident surface of the thermocouple and converted into heat. The other surface of the thermocouple remains cold, as it is thermally connected to the radiator of the sensor. The temperature gradient between the two surfaces depends on the incident optical power. Therefore, the generated voltage between the hot and cold surfaces is proportional to the incident power.
The conversion of optical power into a measurable voltage depends on the capability of the sensor surface to absorb the optical power and convert it into heat. In order to increase absorption, the sensing surface is coated. Preferably, the coating should be wavelength independent (i.e., the absorption efficiency is independent of wavelength) and should have a high damage threshold (i.e., capability to withstand high optical power densities).
Wavelength Dependency of a Thermal Sensor
The thermocouple itself is insensitive to the laser wavelength - it only converts the heat into a voltage. However, the absorptive coating shows a wavelength dependency because the coating's surface reflects a small part of the incident light, and the reflectance depends slightly on the wavelength. Since the coating is not transparent, it does not transmit light and, to a very good approximation, the efficiency of the conversion process is solely dependent on the reflection (R) and absorption (A) factors with the equation R + A = 1 or A = 1 - R. Consequently, absorbance as a functon of wavelength can be calculated by measuring the reflectivity over a certain wavelength range.
How a Pyroelectric Sensor Works
Pyroelectric sensors can be classified as thermal detectors. They permit the direct transformation of an energy pulse into a voltage pulse independent of the wavelength of the incident radiation. These detectors are built on a coaxial basis and are therefore extremely insensitive to interference from electromagnetic radiation from sources such as a pulsed gas laser.
Thorlabs' selection of pyroelectric energy sensors support a wide variety of applications, from broadband measurements of energies in the µJ range, pulses with high energy densities up to 0.45 J/cm2, or detecting repetition rates up to 10 kHz.
The maximum pulse repetition rate depends on the internal capacitance of the detector as well as the load resistor. Thorlabs' C-Series pyroelectric sensors can be connected directly to an oscilloscope with a 1 MΩ input resistance via the BNC connector. For our Standard and High-Energy Pyroelectric Sensors, a load resistor (100 kΩ load resistors are included) can be used to obtain the highest pulse repetition rate, making it possible to measure repetition rates up to 100 Hz. Alternatively, Thorlabs' Fast Energy Sensors, which can detectect repetition rates ≥250 Hz, are optimized for use with 1 MΩ loads.
Calibration of a Power Meter Console
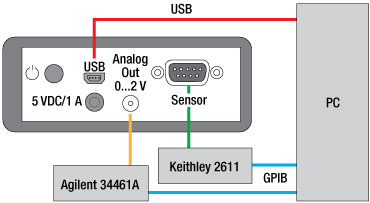
Thorlabs' PM100x Power Meter Display Units are calibrated by applying a known current from a traceable calibrated source (Keithley 2611A Source Meter) on each gain stage of the photodiode input and a known voltage on each gain stage of the thermal and pyroelectric sensor input. Each gain stage is adjusted at the zero and 90% full scale levels. The analog output is not adjusted but measured during the adjustment and calibration procedure using a traceable multimeter (Agilent 34461A). A PC controls the automated setup, acquires the data, and stores the measured values.
Calibration of a Photodiode Power Sensor
The variation of the PD's responsivity and of the ND filter's attenuation over the operating wavelength range causes the need to calibrate the photodiode in combination with the attenuator. Thorlabs uses a NIST-traceable calibration procedure. The responsivity vs. wavelength of a NIST- traceable reference diode is compared to that of the sensor (i.e., detector) under test (DuT), The responsivity of the sensor being tested is then calculated from the well-known responsivity curve of the reference diode.
Block Diagram of Thorlabs' Photodiode Sensor Calibration Setup
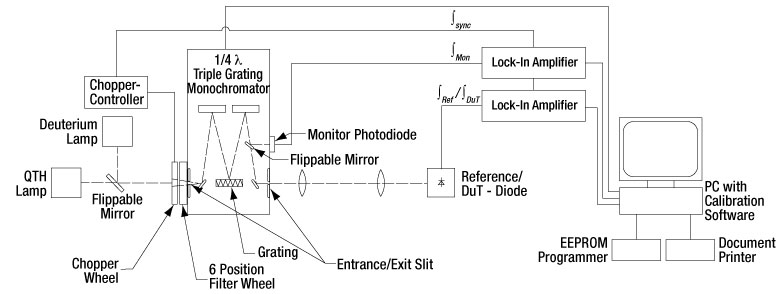
The optical signal is generated by a suitable white light source [deuterium lamp for 200 - 400 nm or a quartz tungsten halogen lamp (indicated as QTH Lamp in the schematic above) for 350 - 2500 nm], followed by a chopper and a CornerstoneTM 260 1/4m monochromator. The monochromator allows the wavelength of the optical signal incident to the REF / DuT to change with a step size of 5 nm. The measured photocurrent is applied to the input of a high gain (40/50 dB) transimpedance amplifier, and its output voltage is measured by a Lock-In Amplifier. The advantage of a Lock-In Amplifier is that noise and DC offsets are efficiently suppressed and only the wanted signal is measured. The required alternating signal is provided by chopping the light source prior to entering the monochromator; the chopper is synchronized with the Lock-In Amplifier. The entire light path, from illuminator to the DuT, is shielded from environmental light with blackout material.
A PC controls the entire calibration process via a LabVIEW application, programs the EEPROM of the DuT with the measured calibration data, and creates the Certificate of Calibration. For quality management purposes, each calibration scan is saved and can be recalled at any time if the sensor type and its serial number are known. The light source's overall operation time is counted by an operation-hour counter in order to follow the manufacturer's exchange instructions.
Calibration Procedure:
- The light source and the reference photodiode are chosen depending on the sensor type to be calibrated.
- Prior to any calibration scan, a monitor diode is used to observe power variations due to lamp aging.
- A reference scan is carried out and the reference current (IRef) vs. wavelength is recorded. This allows the calculation of the optical power at each wavelength step. The Reference photodiodes are recalibrated annually at PTB or NIST, which gives the traceability.
- The reference diode is replaced by the DuT. The wavelength scan is repeated, and its current (IDuT) vs. wavelength is recorded.
- The responsivity of the DuT is then calculated over the entire specified wavelength range of the DuT with a step size of 5 nm. These data sets (responsivity and wavelength) are saved to the sensor's memory, located in the DSUB connector. Additionally, the calibration data are printed out to the Certificate of Calibration and are saved to our server.
Summary
The complex procedure described above allows the calibration of all Thorlabs photodiode sensors (i.e., S12xC Series, S13xC Series, and S14xC Series) in a NIST- or PTB-traceable way. Due to aging of photodiodes, Thorlabs recommends a recalibration cycle of 12 months for a.m. power meter sensors in order to ensure the specified power measurement accuracy of ±5%.
Calibration of a Thermal Power Sensor and Traceability
The goal of the calibration is to characterize the spectral responsivity of the sensor under test (SuT). The use of PTB- and NIST-calibrated references makes the calibration of Thorlabs' power sensors traceable. The responsivity is defined as the proportionality factor between the input optical power and the output voltage of the SuT. As described above, the responsivity depends on the wavelength, due to the wavelength dependency of the absorbance; thus, the measurements need to be conducted over the complete range of the SuT. The calibration consists of two main steps: measurement of the reflectivity over a given spectral range and measurement of the absolute responsivity at a known wavelength.
Reflectivity of the Coating from 266 - 1064 nm
Thermal sensors rely on an absorbing layer that efficiently converts the optical intensity into heat. The relative spectral responsivity of the sensor can be accurately determined if the reflectivity of this absorbing layer is known over a given spectral range. In this calibration step, the reflectivity of the sensor is examined using the following setup: Reflectance Standard (REF) or Sensor under Test (SuT).
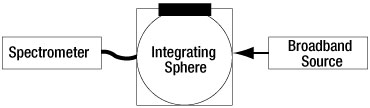
A broadband light source is fed into an integrating sphere. The output port of the integrating sphere is covered with a NIST-traceable certified 20% reflectance standard (REF). A spectrometer is connected to the detector port of the integrating sphere (aka "baffled port"), using an optical fiber.
The spectrum is measured in the wavelength range from 266 - 1064 nm and the spectral intensity distribution is used as a reference.
In the next step, the reflectance standard (REF) is replaced by the sensor under test (SuT). A second spectrum is measured. The spectral reflectivity of the sensor's absorber surface is the difference between the two measured spectral intensity distributions.
Absolute Responsivity Measurement at a Certain Wavelength
NIST- and PTB-traceable reference sensors are used to measure the responsivity of Thorlabs' thermal heads. In order to exactly determine the optical power of a laser with a known wavelength, a NIST/PTB reference sensor is used and its output voltage recorded. The reference sensor is then replaced by the sensor under test, and the measurement is repeated for the same optical power. During the measurement, the optical power is observed by a separate monitor sensor. The responsivity of the sensor under test is derived from a comparison of the measurement results of the reference sensor and the sensor under Test.
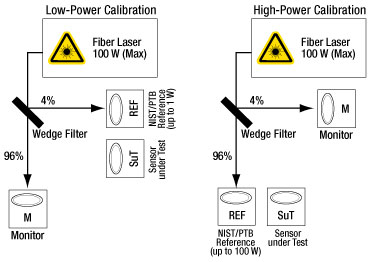
The laser (fiber laser, 1064 nm, output power up to 100 W) is warmed up for 20 minutes to ensure maximum stability. The beam is split into two paths using a 96:4 wedge beamsplitter. Depending on the measurement range of the SuT, the 4% or the 96% path is chosen. In the left figure above, the calibration of a low-power sensor is illustrated: The 96% path is being monitored by a secondary reference sensor. This monitoring is necessary to observe possible power variations during the measurements. The NIST/PTB Reference sensor is placed into the 4% path. The laser output power is set and monitored, and the output voltage of the reference sensor is averaged over 60 seconds. This procedure is subsequently repeated 5 times.
The reference sensor is then replaced by the SuT and the above procedure is repeated. The output voltage of the sensor under test is measured and averaged over 60 seconds, and 5 subsequent measurements are conducted. The correlation between the measurements allows the calculation of the responsivity of the sensor under test at the lasing wavelength (1064 nm) through an unbroken chain of comparisons (traceability) with the NIST/PTB reference. This value will be used as the anchor point for the responsivity.
Summary
The relative spectral responsivity is measured over a wide spectral range. The responsivity is then accurately determined at one given wavelength. The correlation of those two results allows one to obtain the absolute responsivity over the 266 - 1064 nm range in a traceable way.
The responsivity for the remaining operating wavelength range (up to 25 μm, depending on the sensor type) is extrapolated. Each coating has a theoretical reflection curve for its entire measurement range. This theoretical curve is fitted onto the traceably determined responsivity between 266 nm and 1064 nm. Then, the responsivity of the sensor under test can be calculated up to the maximum specified wavelength. NIST/PTB traceable calibration of the sensor under test at longer wavelengths is available upon request.
Traceability
All our equipment used for calibration is traceable to both national and international standards and is periodically recalibrated to maintain the required standards.
| National Standard Lab. | NIST, NPL, or PTB | ||||||
| Thorlabs Reference Standards | Agilent STDs Lab. | Silicon Power Sensor | InGaAs Power Sensor | Ge Power Sensor | Thermal Power Sensor | Pyroelectric Energy Sensor | |
| DMM AG3451A | |||||||
| Thorlabs Working Standards | Sourcemeter KE2611 | DMM AG34461A | |||||
| Parameters | Voltage, Current | Optical Power | Optical Energy | ||||
Abbreviations
| DB9 | D-Sub connector, 9 pins | PD | Photodiode |
| DuT | Device under Test | PTB | Physikalisch-Technische Bundesanstalt (NIST's German counterpart) |
| EEPROM | Electrically Erasable Programmable Read-Only Memory | PC | Personal Computer |
| GPIB | General Purpose Interface Bus (IEEE488) | QTH | Quartz Tungsten Halogen (type of light source) |
| M | Monitoring Sensor (secondary reference) | REF | Reference |
| NIST | National Institute of Standards & Technology (USA) | SuT | Sensor under Test |
| NPL | National Physical Laboratory (NIST's UK counterpart) |
USB | Universal Serial Bus |
Click to Enlarge
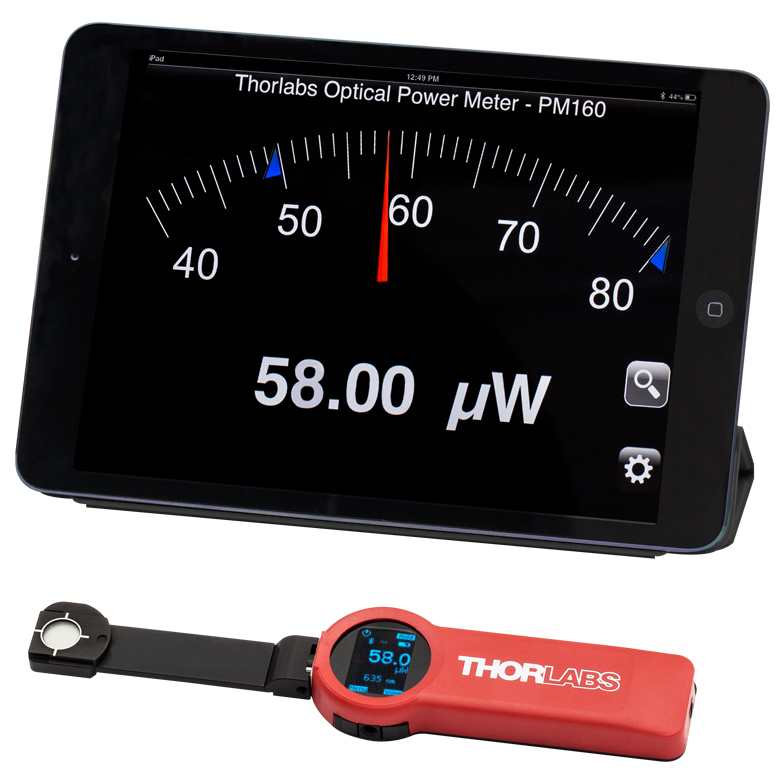
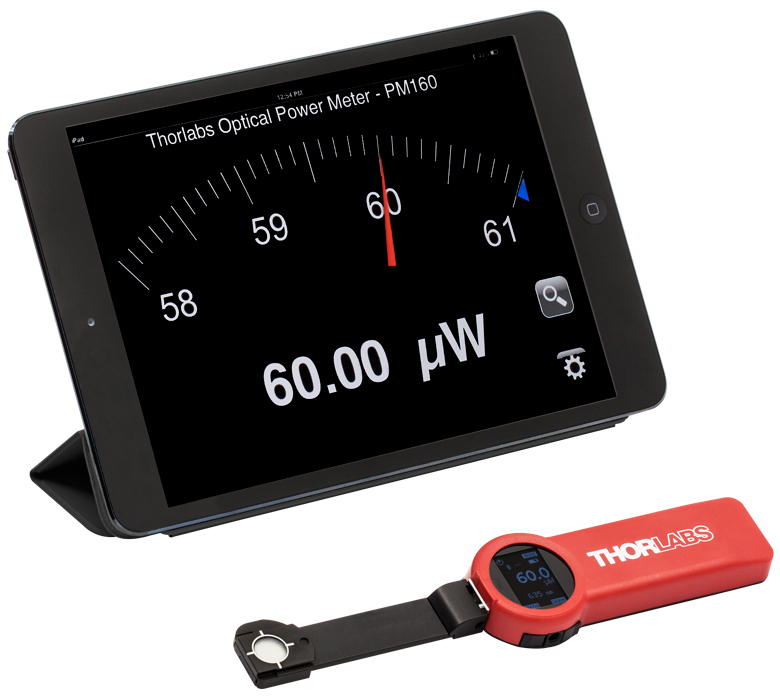
The PM160 wireless power meter, shown here with an iPad mini (not included), can be remotely operated using Apple mobile devices.
This tab outlines the full selection of Thorlabs' power and energy sensors. Refer to the lower right table for power meter console and interface compatibility information.
In addition to the power and energy sensors listed below, Thorlabs also offers all-in-one, wireless, handheld power meters and compact USB power meter interfaces that contain either a photodiode or a thermal sensor, as well as power meter bundles that include a console, sensor head, and post mounting accessories.
Thorlabs offers four types of sensors:
- Photodiode Sensors: These sensors are designed for power measurements of monochromatic or near-monochromatic sources, as they have a wavelength dependent responsivity. These sensors deliver a current that depends on the input optical power and the wavelength. The current is fed into a transimpedance amplifier, which outputs a voltage proportional to the input current.
- Thermal Sensors: Constructed from material with a relatively flat response function across a wide range of wavelengths, these thermopile sensors are suitable for power measurements of broadband sources such as LEDs and SLDs. Thermal sensors deliver a voltage proportional to the input optical power.
- Thermal Position & Power Sensors: These sensors incorporate four thermopiles arranged as quadrants of a square. By comparing the voltage output from each quadrant, the unit calculates the beam's position.
- Pyroelectric Energy Sensors: Our pyroelectric sensors produce an output voltage through the pyroelectric effect and are suitable for measuring pulsed sources, with a repetition rate limited by the time constant of the detector. These sensors will output a peak voltage proportional to the incident pulse energy.
| Console Compatibility | ||||||||
|---|---|---|---|---|---|---|---|---|
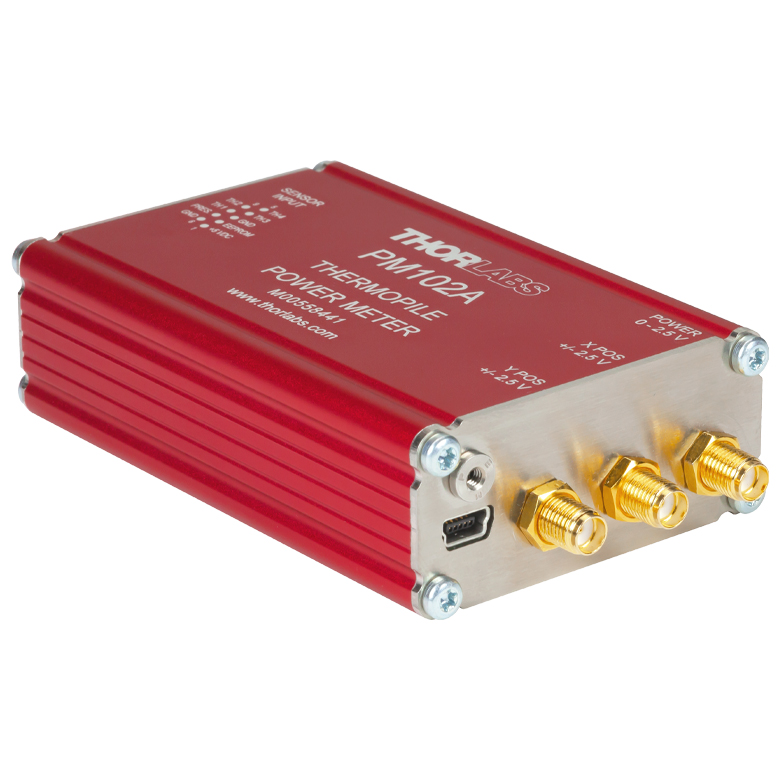
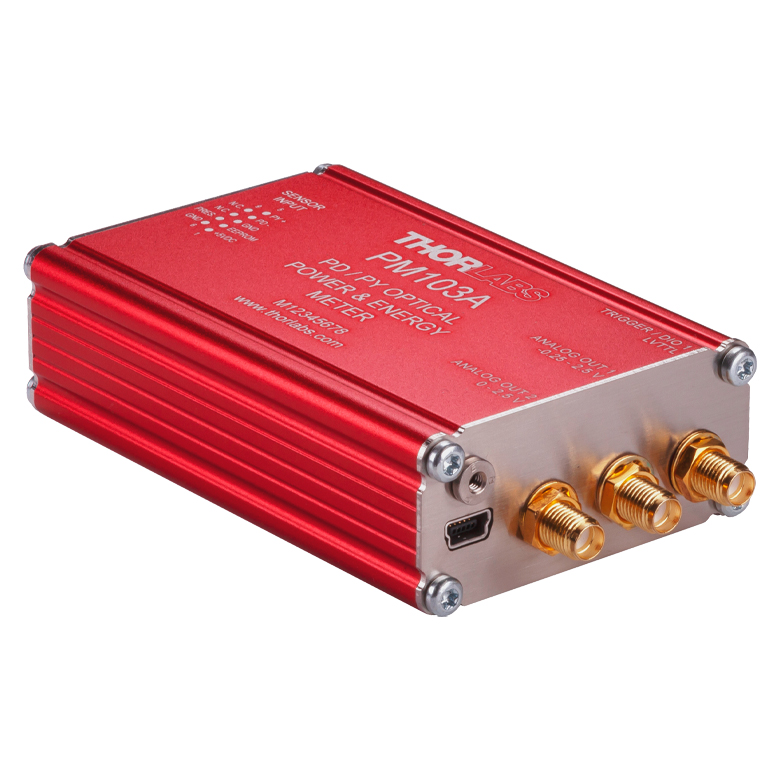
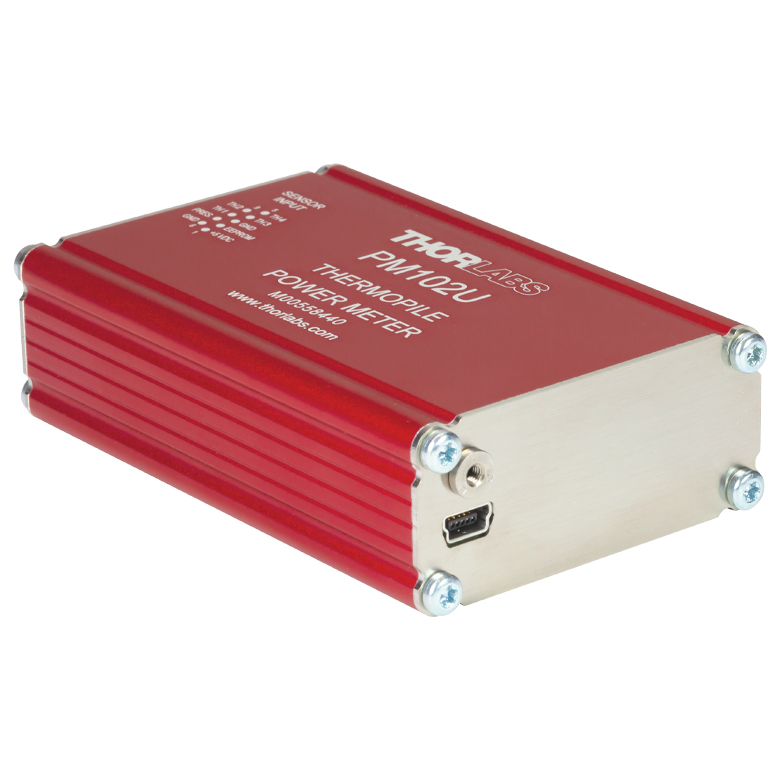
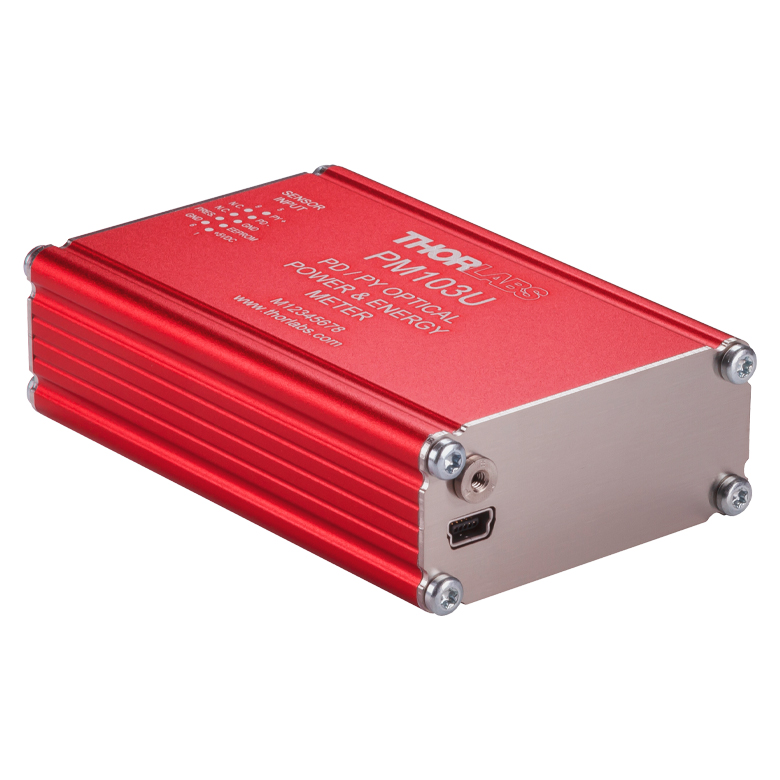
| Console Item # | PM100A | PM100D | PM400 | PM5020 | PM101 Series |
PM102 Series |
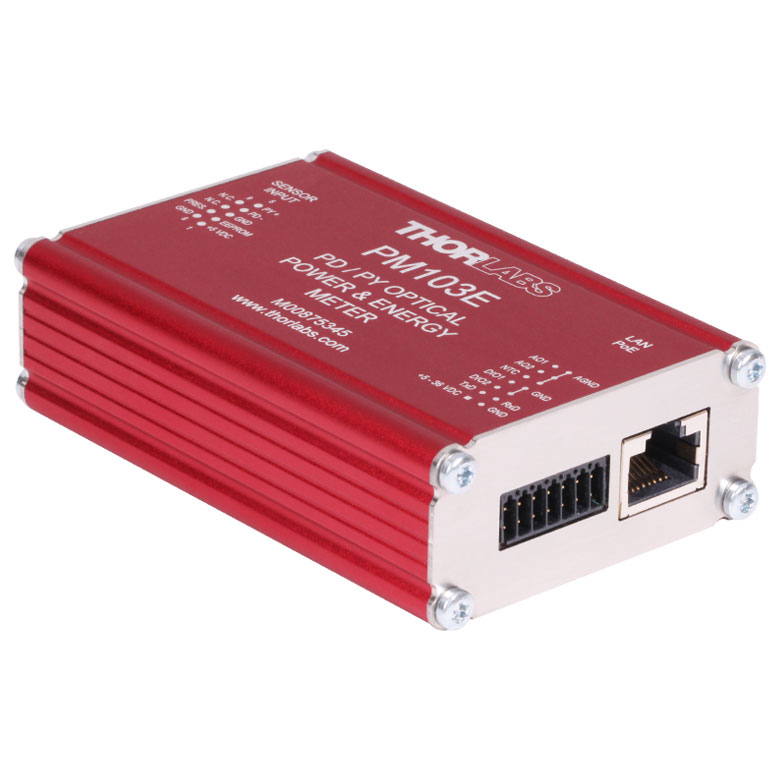
PM103 Series |
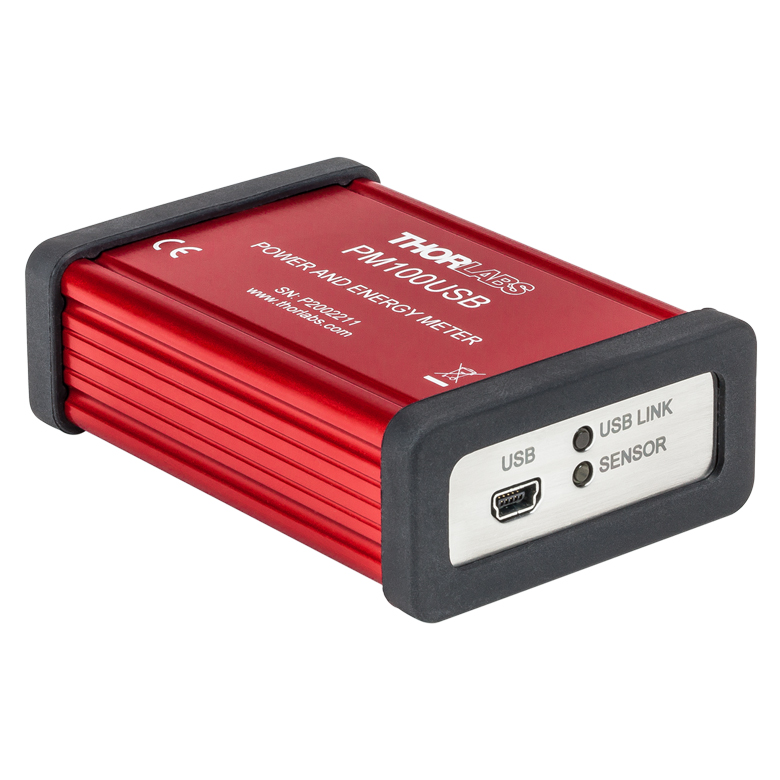
PM100USB |
| Photodiode Power |  |
|
|
|
|
- | |
|
| Thermal Power | |
|
|
|
|
|
- | |
| Thermal Position | - | - | |
|
- | |
- | - |
| Pyroelectric Energy | - | a |
a |
|
- | - | |
a |
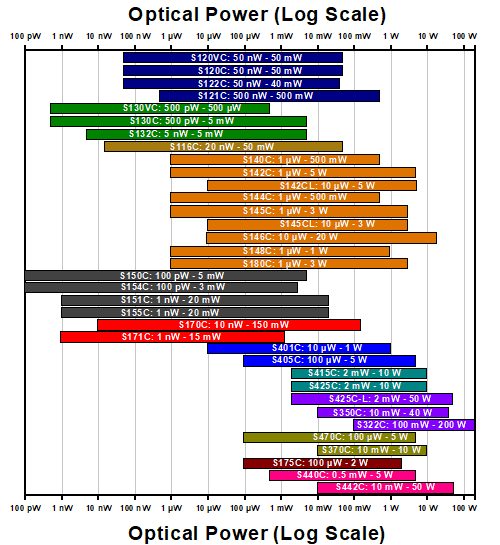
Power and Energy Sensor Selection Guide
There are two options for comparing the specifications of our Power and Energy Sensors. The expandable table below sorts our sensors by type (e.g., photodiode, thermal, or pyroelectric) and provides key specifications.
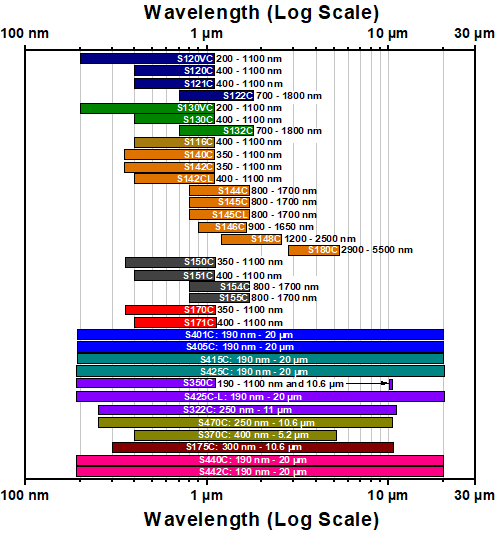
Alternatively, the selection guide graphic further below arranges our entire selection of photodiode and thermal power sensors by wavelength (left) or optical power range (right). Each box contains the item # and specified range of the sensor. These graphs allow for easy identification of the sensor heads available for a specific wavelength or power range.
| Photodiode Power Sensors |
|---|


| Thermal Power Sensors |
|---|


| Thermal Position & Power Sensors |
|---|

| Pyroelectric Energy Sensors |
|---|


Sensor Options
(Arranged by Wavelength Range)
Sensor Options
(Arranged by Power Range)
Thorlabs offers a wide selection of power and energy meter consoles and interfaces for operating our power and energy sensors. Key specifications of all of our power meter consoles and interfaces are presented below to help you decide which device is best for your application. We also offer self-contained wireless power meters and compact USB power meters.
When used with our C-series sensors, Thorlabs' power meter consoles and interfaces recognize the type of connected sensor and measure the current or voltage as appropriate. Our C-series sensors have responsivity calibration data stored in their connectors. The console will read out the responsivity value for the user-entered wavelength and calculate a power or energy reading.
- Photodiode sensors deliver a current that depends on the input optical power and the wavelength. The current is fed into a transimpedance amplifier, which outputs a voltage proportional to the input current. The photodiode's responsivity is wavelength dependent, so the correct wavelength must be entered into the console for an accurate power reading. The console reads out the responsivity for this wavelength from the connected sensor and calculates the optical power from the measured photocurrent.
- Thermal sensors deliver a voltage proportional to the input optical power. Based on the measured sensor output voltage and the sensor's responsivity, the console will calculate the incident optical power.
- Energy sensors are based on the pyroelectric effect. They deliver a voltage peak proportional to the pulse energy. If an energy sensor is recognized, the console will use a peak voltage detector and the pulse energy will be calculated from the sensor's responsivity.
The consoles and interfaces are also capable of providing a readout of the current or voltage delivered by the sensor. Select models also feature an analog output.
Consoles
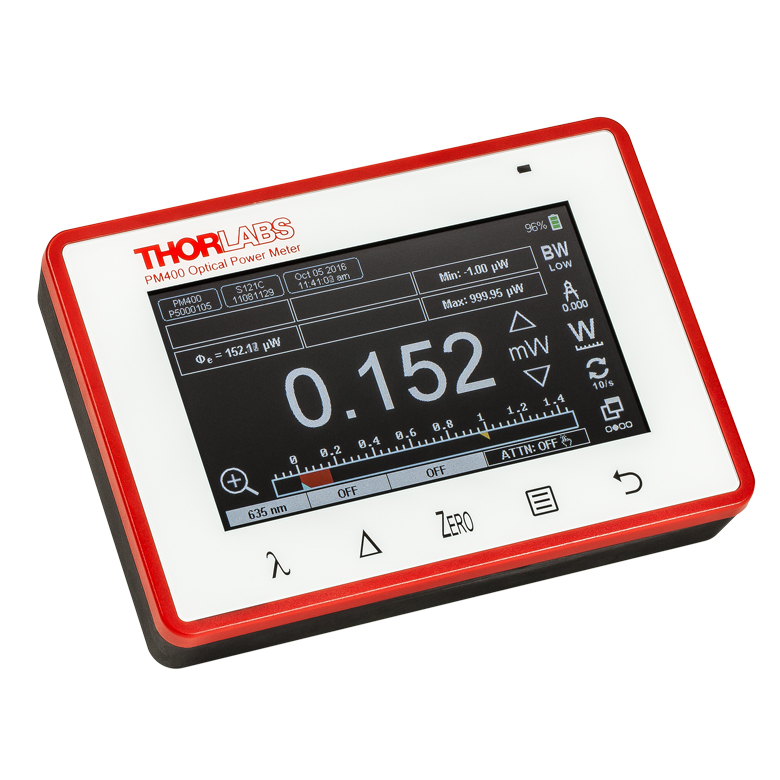
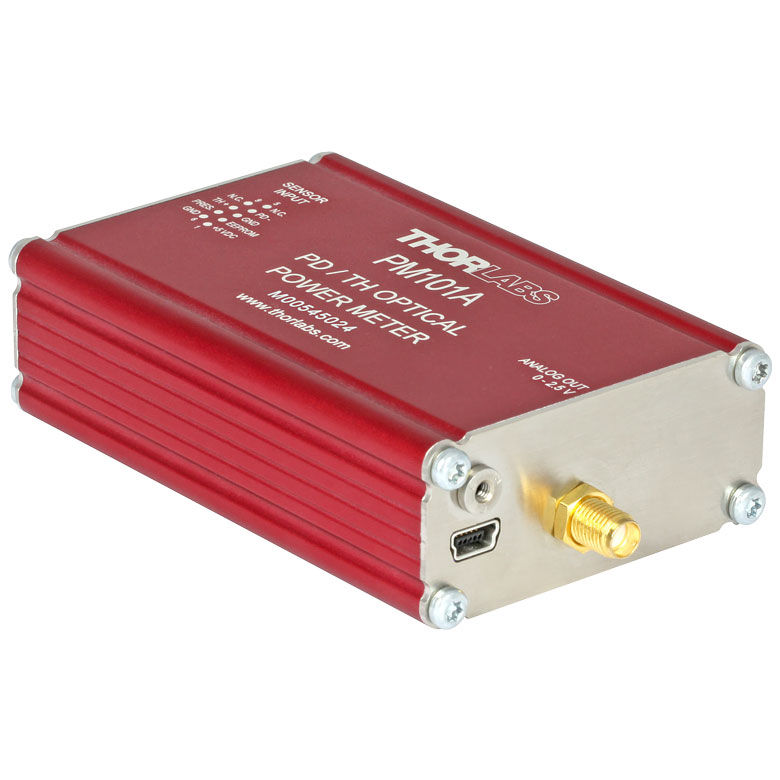
| Item # | PM100A | PM100D | PM400 | PM5020 |
|---|---|---|---|---|
| (Click Photo to Enlarge) | 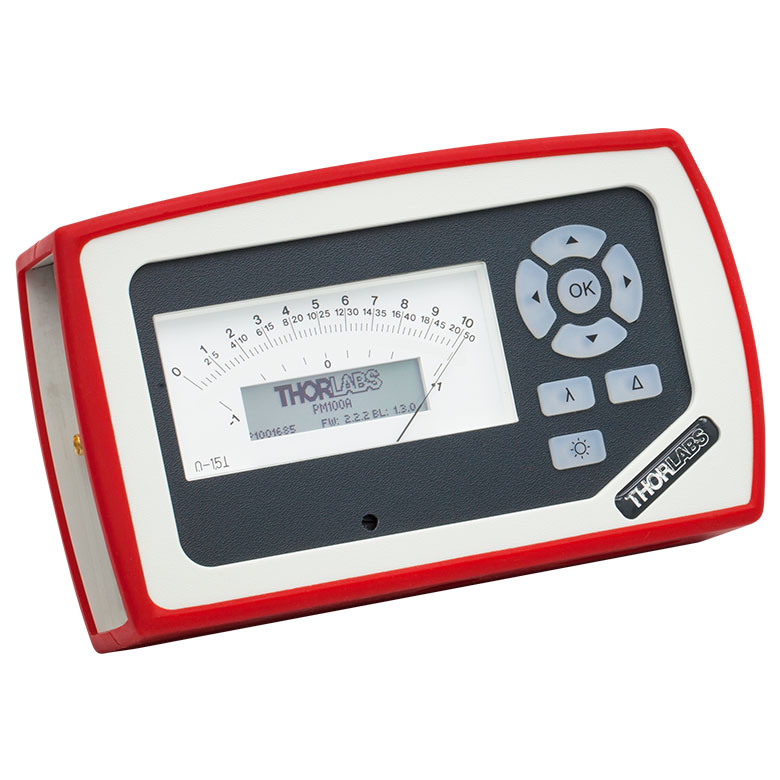 |
 |
 |
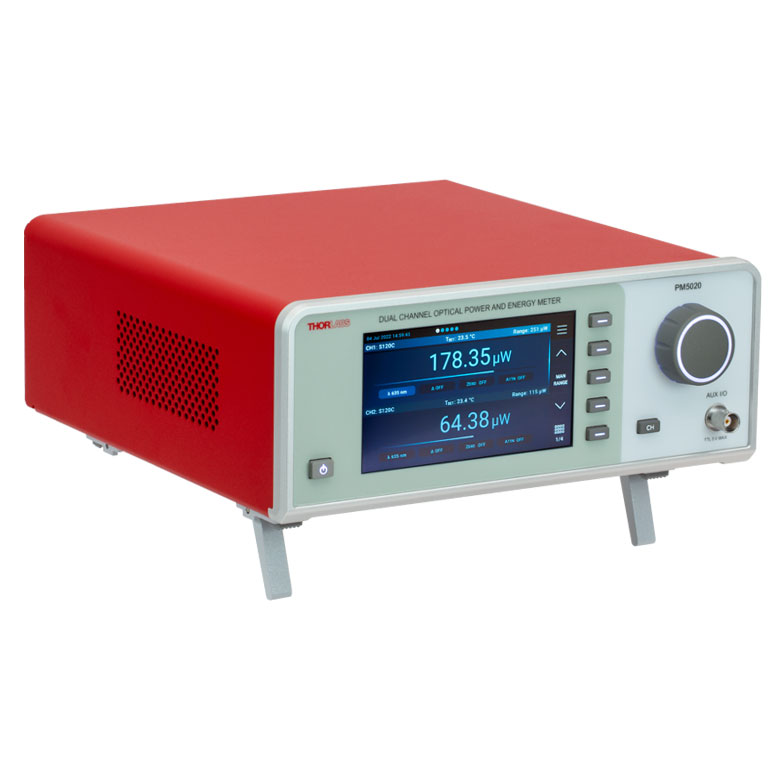 |
| Key Features | Analog Power Measurements | Digital Power and Energy Measurements | Digital Power and Energy Measurements, Touchscreen Control | Dual Channel |
| Compatible Sensors | Photodiode and Thermal Power | Photodiode Power, Thermal Power, and Pyroelectric Energya | Photodiode Power, Thermal Power, Thermal Power and Position, and Pyroelectric Energya | Photodiode Power, Thermal Power, Thermal Power and Position, and Pyroelectric Energy |
| Housing Dimensions (H x W x D) |
7.24" x 4.29" x 1.61" (184 mm x 109 mm x 41 mm) |
7.09" x 4.13" x 1.50" (180 mm x 105 mm x 38 mm) |
5.35" x 3.78" x 1.16" (136.0 mm x 96.0 mm x 29.5 mm) |
9.97" x 4.35" x 11.56" (253.2 mm x 110.6 mm x 293.6 mm) |
| Channels | 1 | 2 | ||
| External Temperature Sensor Input (Sensor not Included) | - | - | Readout and Record Temperature Over Time | Readout and Record Temperature Over Time |
| External Humidity Sensor Input (Sensor not Included) | - | - | Readout and Record Humidity Over Time | Readout and Record Humidity Over Time |
| Input/Output Ports | - | 4 GPIO, Programmable | 4 Configurable Digital I/O Channels | |
| Shutter Control | - | - | - | Support for SH05R(/M) or SH1(/M) Optical Shutter with Interlock Input |
| Fan Control | - | - | - | |
| Source Spectral Correction | - | - | ||
| Attenuation Correction | - | - | ||
| External Trigger Input | - | - | - | |
| Display | ||||
| Type | Mechanical Needle and LCD Display with Digital Readout | 320 x 240 Pixel Backlit Graphical LCD Display | Protected Capacitive Touchscreen with Color Display | |
| Dimensions | Digital: 1.9" x 0.5" (48.2 mm x 13.2 mm) Analog: 3.54" x 1.65" (90.0 mm x 42.0 mm) |
3.17" x 2.36" (81.4 mm x 61.0 mm) |
3.7" x 2.1" (95 mm x 54 mm) |
4.32" x 2.43" (109.7 mm x 61.6 mm) |
| Refresh Rate | 20 Hz | 10 Hz (Numerical) 25 Hz (Analog Simulation) |
25 Hz | |
| Measurement Viewsb | ||||
| Numerical | ||||
| Mechanical Analog Needle | - | - | - | |
| Simulated Analog Needle | - | |||
| Bar Graph | - | |||
| Trend Graph | - | |||
| Histogram | - | - | - | |
| Statistics | ||||
| Memory | ||||
| Type | - | SD Card | NAND Flash | SD Card |
| Size | - | 2 GB | 4 GB | 8 GB |
| Power | ||||
| Battery | LiPo 3.7 V 1300 mAh | LiPo 3.7 V 2600 mAh | - | |
| External | 5 VDC via USB or Included AC Adapter | 5 VDC via USB | Line Voltage: 100 - 240 V | |


| Item # | PM160 | PM160T | PM160T-HP |
|---|---|---|---|
| (Click to Enlarge) | 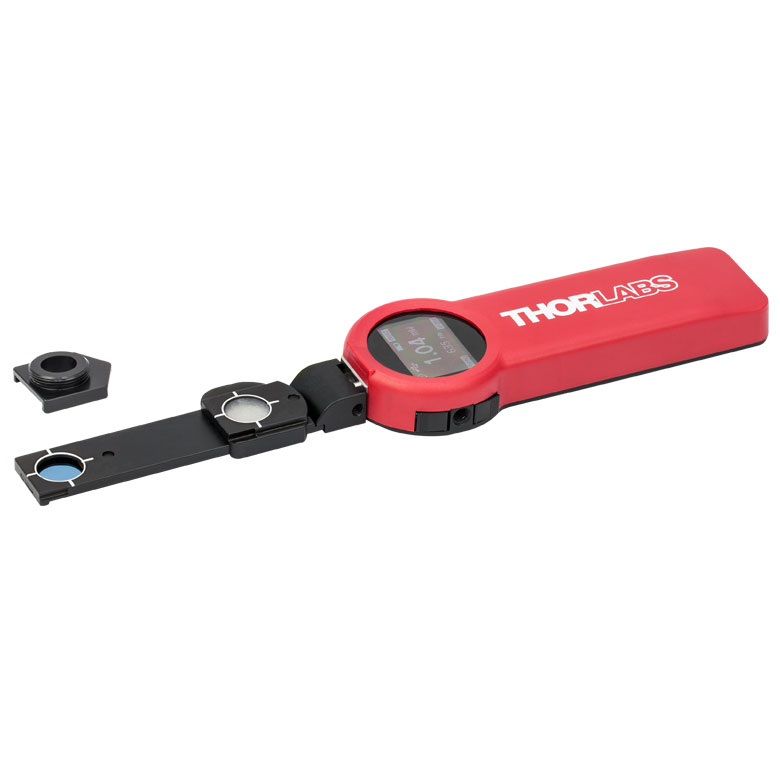 |
 |
 |
| Detector Type | Slim Si Photodiode | Thermal | Thermal |
| Wavelength Range | 400 - 1100 nm | 190 nm - 10.6 µm | 190 nm - 20 µm |
| Optical Power Measurement Range |
10 nW - 2 mW Up to 200 mW w/ ND Filter |
100 µW - 2W | 10 mW - 70 Wa |
| Optical Power Resolution | 100 pW (10 nW w/ Filter) |
10 µW | 1 mW |
| Aperture | Ø9.5 mm | Ø10 mm | Ø25.2 mm |
| Distance to Sensor From Top Surface of Housing |
1.7 mm (4.2 mm w/ Filter) |
2.6 mm | 4.5 mm |
| Included Adapter | External SM05 (0.535"-40) Threads |
External SM1 (1.035"-40) Threads |
External SM1 (1.035"-40) Threads |
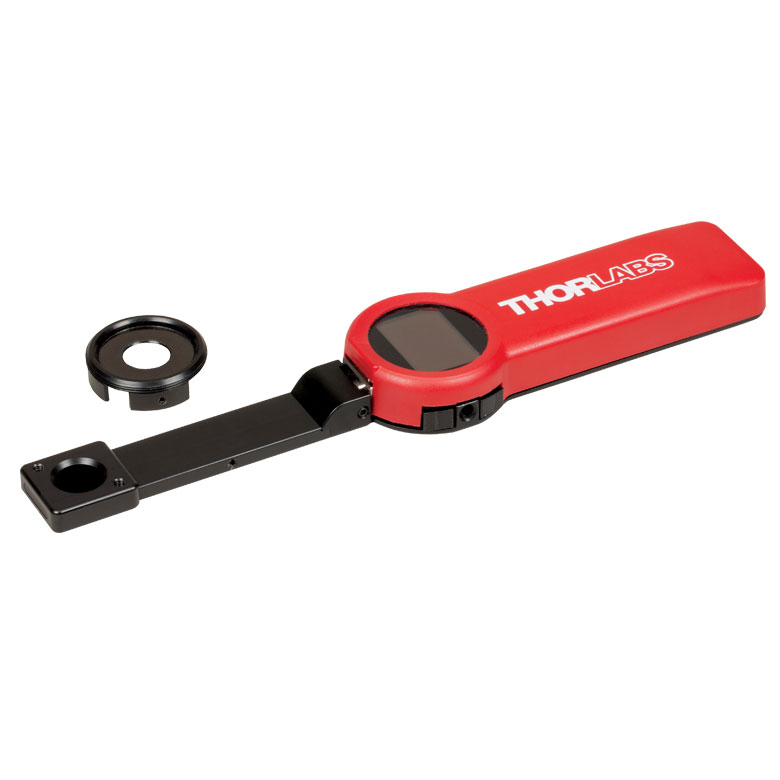
All-in-One Wireless Handheld Power Meters
Thorlabs offers two all-in-one handheld, wireless power meters with built-in graphical Organic LED (OLED) displays. The PM160 wireless power meter uses an ultra-slim silicon photodiode sensor, similar to our slim photodiode sensors. The sensor is designed to detect optical powers between 10 nW and 2 mW at wavelengths between 400 and 1100 nm. This device comes with a slideable neutral density (ND) filter that can be used to increase the maximum measurable optical power from 2 mW to 200 mW. The power meter will automatically detect the presence of the filter over the sensor to display the correct power measurement.
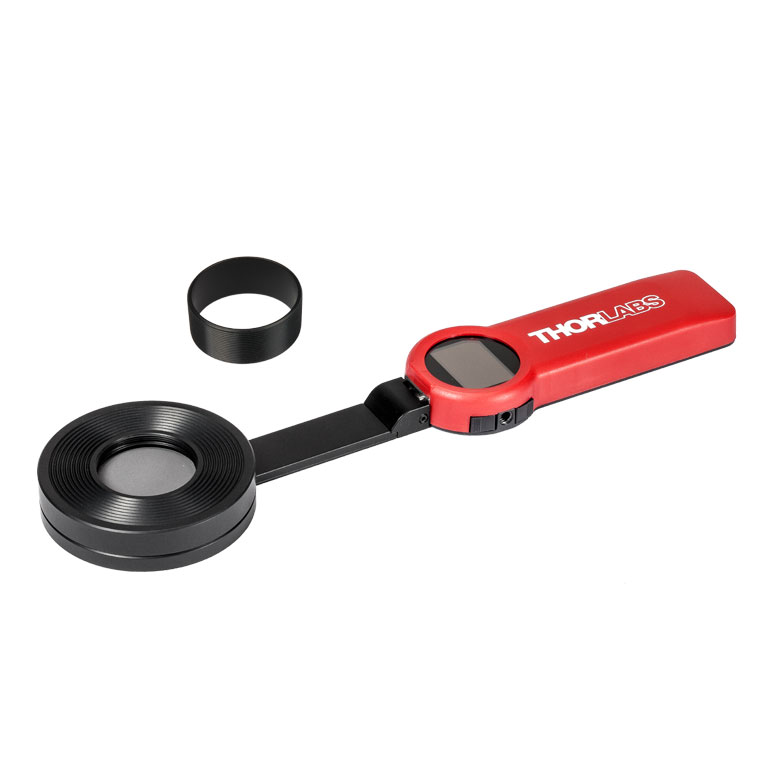
The PM160T wireless power meter contains the same thermal detector used in the S401C high-sensitivity thermal sensor head, making it suitable for broadband power measurements. It can detect powers between 100 µW and 2 W for wavelengths from 190 nm to 10.6 µm.
Click to Enlarge
The PM160 wireless power meter, shown here with an iPad mini (not included), can be remotely operated using Apple mobile devices.
The PM160T-HP high-power wireless power meter features a Ø25.2 mm sensor that is designed to detect optical powers between 10 mW and 70 W at wavelengths between 190 nm and 20 µm. It is well suited for use with a wide variety of broadband and MIR light sources, including LEDs, SLDs, and MIR quantum cascade lasers.
These wireless power meters can fit into tight spaces and pick up an incident beam from any direction. The ultra-slim sensor end of the device connects to the handle with a joint mechanism that allows 270° degrees of rotation. When rotating the sensor arm, there is a detent every 90° and enough friction in the joint mechanism that the sensor arm can be positioned at any angle within the allowed rotation range.
The output of the sensor is converted to a calibrated optical power measurement that can be displayed on the built-in OLED screen. The power meter can be controlled locally by the four buttons located on the sides of the OLED display's housing. Alternatively, data can be transmitted via Bluetooth or USB to an external device. A USB stick with an application for acquiring and displaying data on PCs running Windows and on Mac computers is included with each power meter. They can also be operated from Apple mobile devices via bluetooth using the Optical Power Meter App, available free of charge at the Apple App Store.
The table to the right summarizes some of the key features of our handheld power meters. More details can be found here.
Click to Enlarge
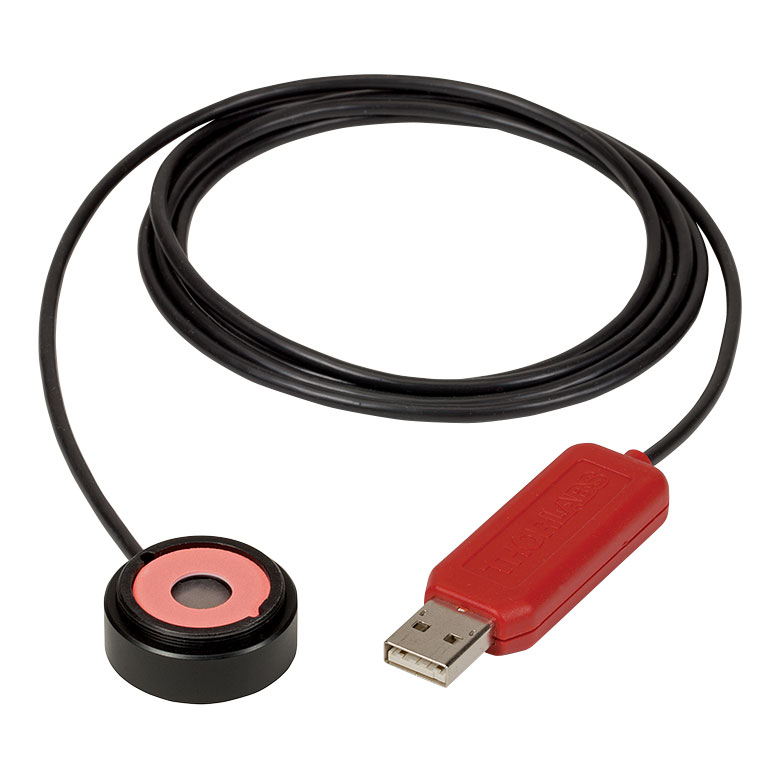
PM16-121 USB Power Meter with Silicon Photodiode Sensor
Compact USB Power Meters with Popular Sensor Heads
Thorlabs has integrated some of our most popular sensor head formats with a compact USB power meter interface that can be operated using a computer running one of Thorlabs' power meter software packages. Sensor head options include our standard photodiode sensors, a slim-format photodiode sensor, integrating spheres, and a thermal sensor. A 1.5 meter cable connects the sensor head to the power meter electronics, which are contained in a compact 65 mm x 20 mm x 10 mm (2.60" x 0.80" x 0.40") USB package. These extremely compact power meters feature similar internal electronics to Thorlabs' PM160 and PM160T Wireless Power Meters and can be controlled via a computer running the Optical Power Monitor Software.
The wavelength and power ranges of available stock options are outlined in the table below. Each sensor head is individually calibrated and is shipped with a NIST- and PTB-traceable calibration certificate. The calibration and identification data is stored in the power meter's USB stick housing and applied to calculate accurate power measurements. If you are interested purchasing a Thorlabs sensor head with a compact USB power meter interface that is not offered below, please contact tech support for information on custom options. Four a complete list of sensor and console options, see the Sensor Selection and Console Selection tabs, respectively.
| Item # | PM16-120 | PM16-121 | PM16-122 | PM16-130 | PM16-140 | PM16-144 | PM16-401 |
|---|---|---|---|---|---|---|---|
| Detector Type | Si Photodiode | Ge Photodiode | Slim Si Photodiode, Slideable ND Filter |
Integrating Sphere (Si Photodiode) |
Integrating Sphere (InGaAs Photodiode) |
Stabilized Thermal Volume Absorber |
|
| Wavelength Range | 400 - 1100 nm | 700 - 1800 nm | 400 - 1100 nm | 350 - 1100 nm | 800 - 1700 nm | 190 nm - 10.6 µm | |
| Optical Power Measurement Range |
50 nW - 50 mW | 500 nW - 500 mW | 50 nW - 40 mW | 500 pW - 5 mW (Up to 500 mW with Filterb) |
1 µW - 500 mW | 100 µW - 1 W (3 Wa) | |
| Optical Power Resolution | <1 nW | <10 nW | <2 nW | <100 pW (10 nW with Filterb) |
<1 nW | <1 µW | |
Power Meter Bundles
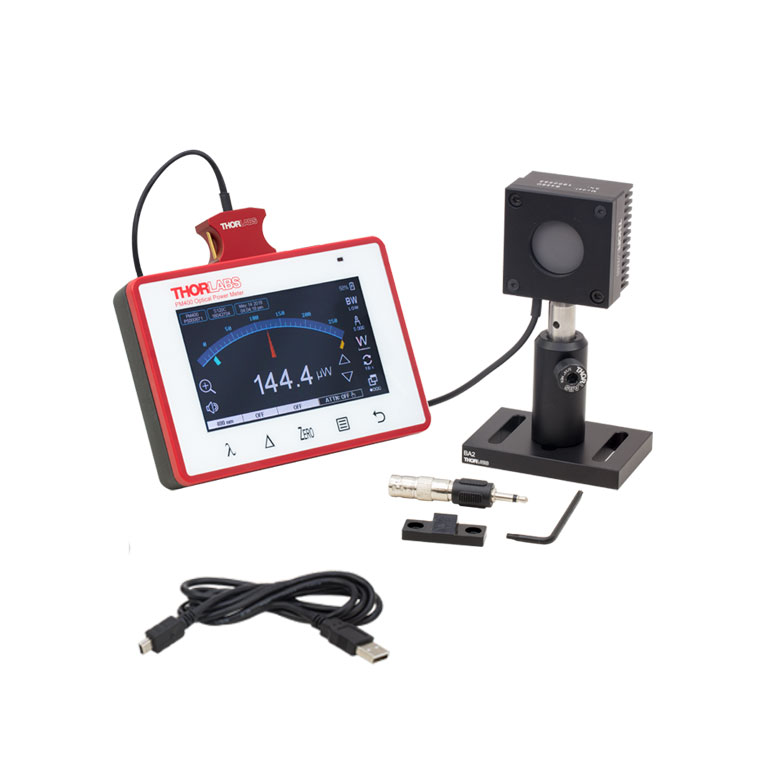
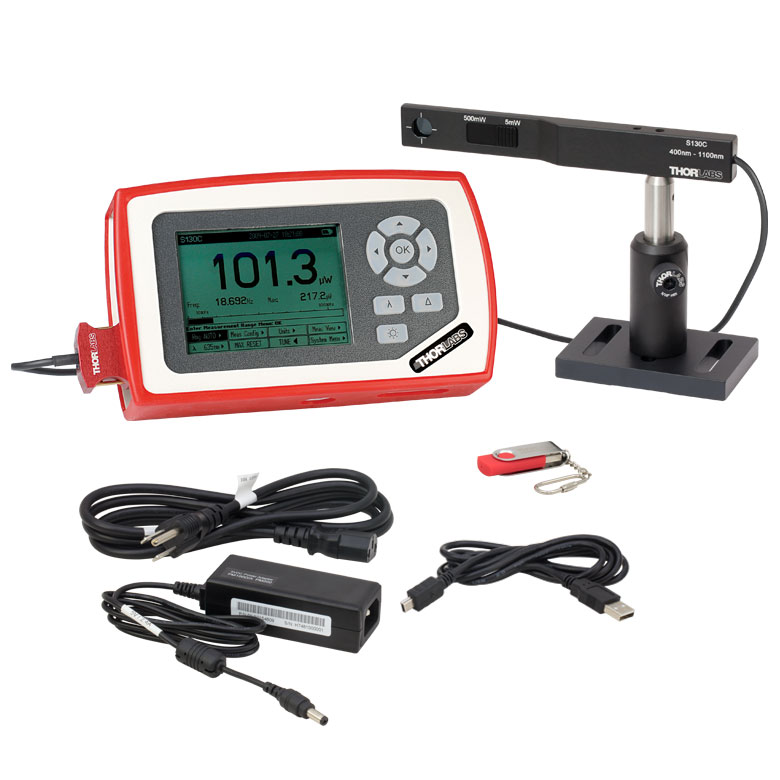
Thorlabs also offers bundles that combine one of our popular PM100D, PM100A, or PM400 power meter consoles with a C-series photodiode or thermal sensor, and a post assembly consisting of a TR2 Ø1/2" post, a PH2 post holder, and BA2 base. Available bundle options are outlined in the table below. For more details on our complete selection of sensor and console options, see the Sensor Selection and Console Selection tabs. Additional information on available power meter bundles can be found here.
| Bundle Item # |
Wavelength Range |
Power Range | Sensor Type (Item #) |
Console Type (Item #) |
|---|---|---|---|---|
| PM120VA | 200 - 1100 nm | 50 nW - 50 mW | Si (S120VC) | Analog (PM100A) |
| PM120D | 400 - 1100 nm | 50 nW - 50 mW | Si (S120C) | Digital (PM100D) |
| PM121D | 500 nW - 500 mW | Si (S121C) | ||
| PM130D | 500 pW - 500 mWa | Slim Si (S130C) | ||
| PM122D | 700 - 1800 nm | 50 nW - 40 mW | Ge (S122C) | |
| PM125D | 0.19 - 20 µm | 2 mW - 10 W | Thermal (S425C) |
| Bundle Item # |
Wavelength Range |
Power Range | Sensor Type (Item #) |
Console Type (Item #) |
|---|---|---|---|---|
| PM400K1 | 400 - 1100 nm | 50 nW - 50 mW | Si (S120C) | Touchscreen Digital (PM400) |
| PM400K2 | 500 nW - 500 mW | Si (S121C) | ||
| PM400K3 | 500 pW - 500 mWa | Slim Si (S130C) | ||
| PM400K4 | 700 - 1800 nm | 50 nW - 40 mW | Ge (S122C) | |
| PM400K5 | 0.19 - 20 µm | 2 mW - 10 W | Thermal (S425C) |
Choosing a Sensor
Beam Size Compared to the Sensor's Active Area
Most sensors do not provide completely uniform response over their active area (with the exception of integrating sphere sensors, which incorporate this feature as part of their design). Thus, to overcome these uniformity issues, the incident beam should have a diameter that fills at least 10% of the sensor's active area. However, it is also important not to overfill the sensor (i.e., the beam size in the plane of the sensor's active area must not exceed the size of the active area). For high power or high energy beams, we recommend selecting a detector size that is about 20% to 30% larger than the beam diameter.
The beam size will also affect whether a source is within the maximum allowed power and energy density specifications for the sensor. These maximum ratings are included in the specifications for each sensor. Please note that if your beam does not have a flat spatial intensity distrubution, the maximum power or energy density specification must not be exceeded in the brightest region of the beam. For example, a beam with gaussian intensity distribution should not have a power (energy) density at the center of the beam that exceeds the power (energy) density specification. See the Definitions tab above for a breakdown of the type of specifications that apply to each sensor type.
Linewidth of Light Sources
When using a thermal or pyro-electric sensor, the linewidth of light sources can be neglected. However, for photodiode sensors, the current generated is strongly dependent on the operating wavelength. If the light source has a linewidth greater than 10 nm (e.g., an LED), the power meter may display an incorrect power reading.
To achieve a reasonable power measurement for broadband light sources when using a photodiode sensor, the detector's response curve must be nearly linear over the linewidth of the source. If the operating wavelength is set on the power meter as the center wavelength of the light source, the measured optical output power will be approximately correct if the spectrum of the light source is symetric around the center wavelength.
Back Reflection
The surfaces of photodiodes, neutral density (ND) filters, and even the black coatings of thermal sensors all cause some back reflection of incoming light. If this back reflection enters the aperture of devices such as a laser diode or a HeNe laser, it may impact the laser's power stability. We recommend slightly tilting the power meter sensor with respect to the laser beam so that any back reflection will not enter the output aperture of the laser. If back reflections must be completely avoided, we recommend using one of our integrating sphere sensors, since the incoming light is nearly completely absorbed inside the sensor.
Ambient and Stray Light
Ambient or stray light can strongly affect measurement accuracy in free-space applications. A constant background light level can be subtracted by resetting the zero level of the detector. The power meter cannot compensate for varying ambient light, such as daylight or turning the room light on or off. In these cases, the sensor should be properly shielded from ambient and stray light. Thorlabs offers a large selection of blackout materials that can be used for this application.
Ambient Temperature
Thorlabs' power sensors are all calibrated at room temperature (23 ± 5 °C).
In most cases, the responsivity of a photodiode sensor has a negligible temperature dependency when compared to the overall measurement accuracy of ±5%. However, the dark current is temperature sensitive, which can interfere with measurements of low optical powers. Proper zeroing is recommended to compensate in this case (see your sensor's manual for details).
In constrast, thermal sensors will respond to any temperature differences that occur between the thermal disk and the heat sink. Disturbances in airflow around the sensor or an increase in the temperature of the heat sink, as could occur during a long-term exposure of the thermal disk to a laser beam, can all interfere with obtaining an accurate power measurement. To minimize these effects, the sensor should be shielded from air flow as much as possible. The sensor should also be zeroed properly for the user's operating conditions. For instance, a cold sensor can be zeroed for short measurements. However, for long-duration measurements, the sensor should be allowed to reach a state of thermal equilibrium prior to zeroing (e.g., after ~10 minutes of light exposure).
Reducing Noise for High Accuracy Measurements
Noise from grounding, cable capacitance, temperature effects, stray and ambient light, and the detector can interfere with the accuracy of measurements. These noise sources will have a higher impact when attempting to measure low optical powers. Below are some hints and recommendations to minimize the effects of noise:
- Power sensors should be grounded directly to the earth (e.g., via post mounting), since the housing is connected to the digital ground of the meter.
- Energy sensors should be mounted so that they are isolated from earth ground since the housing is connected to the analog ground of the power meter.
- Since the sensor cable can conduct very small currents or voltage signals, and cable capacitance induces disturbances when the cable is moved, the cable should be in a fixed position for very small power or energy measurments.
- The bandwidth should be set to the "Low" setting for photodiode sensors. For thermal sensors, the acceleration circuit should be shut off.
- The detector noise is lowest for Si or InGaAs sensors.
- Long-term measurements in free-space applications require constant ambient light conditions or shielding the light path from external light sources.
- The temperature should be stable over the time of the measurement.
Fiber-Based Measurements
Laser light is emitted from an optical fiber tip in a conical shape with an opening angle of twice the acceptance angle of the fiber. The fiber acceptance angle can be calculated by:
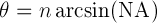
where NA is the numerical aperture of the fiber and n is the index of refraction (for air, n=1).
For typical fibers, the total angle (2Θ) of the emitted light is between 15° and 25°. If an angled connector (APC) is used, the cone will be tilted by approximately 4° from the fiber axis.
To obtain an accurate measurement, the expansion of the beam that occurs from the fiber tip to the detector location must be considered to avoid overfilling the detector. Conversely, maintaining a certain size gap between the fiber tip and detector surface is desirable for high-power fiber lasers to decrease the power density.
Thorlabs offers fiber adapters in most common connector styles that are compatible with our standard photodiode power sensors, all-in-one wireless power meter, and most of our thermal sensors. For measurements of the output from fibers with large divergence angles or where avoiding back reflections is critical, we recommend using one of our integrating sphere sensors.
We also offer sensor heads specifically designed for fiber-based measurements. These sensor heads plug directly into the power meter and have no cable between the sensor and the console, minimizing measurement interferences.
Special Considerations for Energy Sensors
Thorlabs' energy sensors are based on the pyroelectric effect. The ES1xxC and ES2xxC sensors have a thermal time constant of 20 ms; as a result, the energy measurements are limited to a maximum repetition rate of 30 to 40 Hz when the sensor is connected to a 1 MΩ load. For applications requiring higher repetition rates, we offer the ES3xxC and ES4xxC sensors which have a maximum repetition rate of up to 10 kHz. Important considerations for obtaining an accurate energy measurement are outlined below.
Trigger Level
A pyroelectric sensor delivers a voltage pulse with a peak amplitude proportional to the pulse energy. When the power meter console is operating in peak detector mode, it indicates the energy of each individual pulse. The trigger level can be set between 0 and 99% of the selected energy range and defines the lower threshold at which the peak detector recognizes the pulse, begins recording data, and waits until the peak is reached. Consequently, the trigger level must be set higher than the noise level and lower than the expected energy. A useful method is to connect the sensor, select the desired range, and increase the trigger level until the console ceases to measure the power continuously. Please note that the last measurement value remains displayed (peak-hold in energy measurement mode).

Repetition Rate
The pulse repetition rate must not exceed the maximum value specified for the actual sensor type. Otherwise, the measured value will be affected by the subsequent pulse.
Increasing the Maximum Repetition Rate
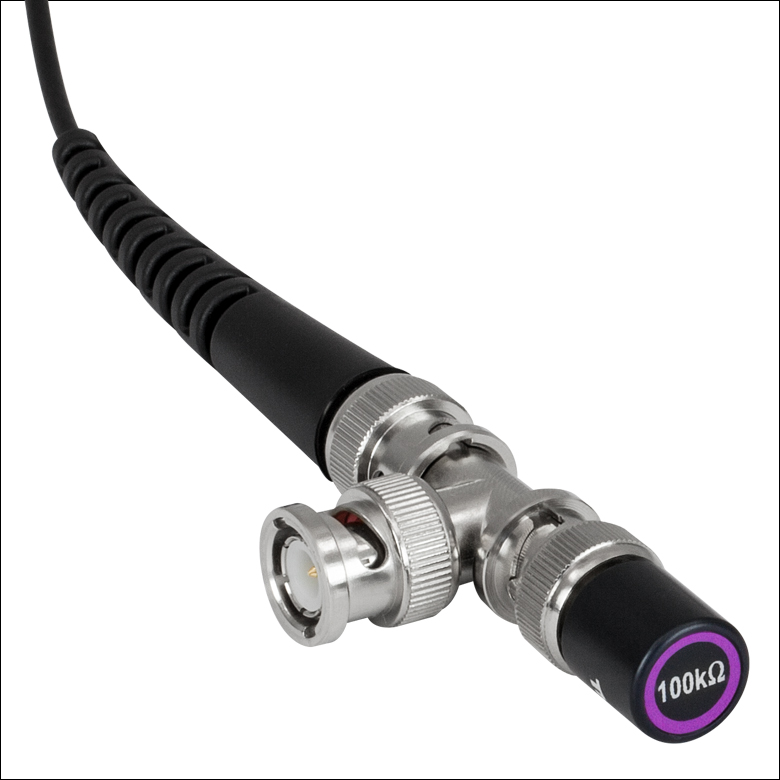
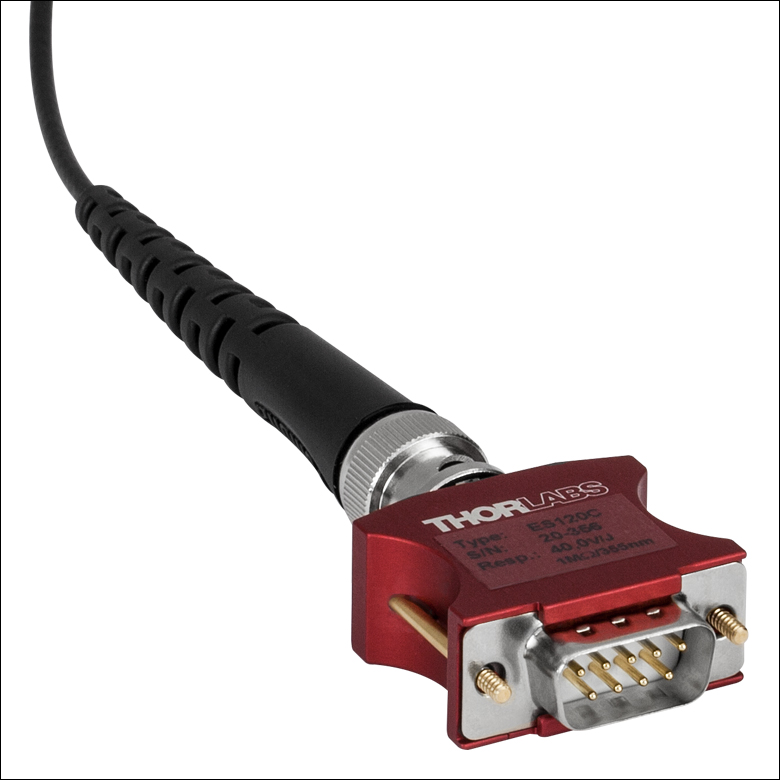
The only way to increase the maximum measurable repetition rate of the ES1xxC standard and ES2xxC high-energy sensors is to use the energy sensor with an oscilloscope (high-Z input) and a 100 kΩ termination resistor. To accomplish this setup with these sensors, first disconnect the BNC connector from the red D-sub connector. Connect the BNC connector via the 100 kΩ terminator to the high impediance Y input of the oscilloscope.
We do not recommend this procedure for the ES3xxC and ES4xxC sensors, as they are optimized for use with a 1 MΩ load.
Pulse Length
Energy sensors can detect and measure pulses with a duration from the sub-nanosecond range to approximately 2 ms. The maximum pulse duration depends on two factors:
- The electrical time constant of the sensor, given by the detector capacity and load resistance
- The thermal time constant of the sensor
Usually, the thermal time constant has a more significant effect.
Simple Function Test
An energy sensor not only responds to optical pulses incident on the absorber but also to mechanical pulses as well. This feature can be used to quickly check the operability of a pyroelectric sensor.
- Detach the red 9-pin D-sub connector and connect the sensor's BNC cable to the scope input. Make sure that the input is set to DC coupled and "High-Z" (high input impedance). Select an appropriate X and Y resolution.
- Lightly tap the sensor onto the desk surface. If the sensor is functional, pulses should be displayed on the oscilloscope's screen. If you do not see pulses, try changing the setting for the Y sensitivity and triggering. If the snsor still does not respond, please contact technical support for further assistance at techsupport@thorlabs.com.
Power Measurements of Pulsed Signals
Click to Enlarge
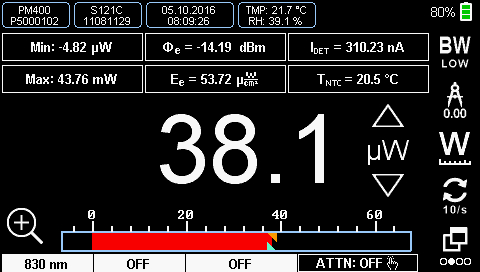
Several of our consoles feature a statistics view, where parameters such as the min and max detected power are displayed.
Click to Enlarge
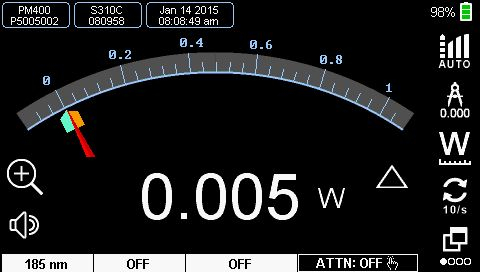
The needle view marks the maximum and minimum detected power with a green and a yellow arrow, respectively. This feature can be useful for determining the appropriate power range for detecting pulsed signals with a photodiode sensor.
A power meter can read the average power of a pulsed signal under the following conditions:
Using a Thermal Sensor
The peak power is lower than the damage threshold of the sensor. This is true regardless of pulse length and repetition rate. As thermal sensors react very slowly, they will integrate the power incident on the active area.
Using a Photodiode Sensor
A photodiode sensor can differentiate short pulses in the nanosecond range. Therefore, the pulse peak power should not be larger than the maximum power range of the sensor. If the pulse peak power exceeds the set power range, the reading will clip and produce an incorrect average value. The Min-Max display function can be helpful for finding the appropriate power range.
The bandwidth setting will also influence the power reading for certain pulse lengths and repetition rates. Use the 'LOW' bandwidth setting for a stable display and the 'HIGH' bandwidth setting to monitor the pulse via the analog output.
Femtosecond Lasers
The repetition rate of femtosecond lasers is up to several hundred MHz, while the the pulse duration is on the order of tens of femtoseconds. Thermal sensors usually provide the best results for measuring the average power, since the energy of the pulses is usually moderate. However, it is still important to verify that the source won't exceed the maximum ratings for the selected sensor. Definitions of the sensor specifications and common formulas for calculating pulse characteristics can be found on the Definitions tab.
Troubleshooting with Continuous Wave (CW) Sources
Is the Wavelength Setting Correct?
Make sure that the wavelength entered in the console matches the wavelength of the incident light source. An incorrect wavelength setting can cause large inaccuracies in the power reading. Also check the accuracy and precision to which the wavelength of your incident light source is known.
Example: An S120C photodiode power sensor is used to measure a light source with a stated wavelength of 405 nm. However, the light source actually has an emitted wavelength of 401 nm, resulting in a a 15% error in the measured power.
When was the sensor last calibrated?
The responsivity of a sensor will change over time. Photodiode sensors or sensors used in the UV range are particularly susceptible to this effect. We recommend recalibrating our sensors annually. More information about how to order recalibration for your sensor can be found on the pages with the full presentation for each sensor (see the Sensor Selection tab for links).
Is the power of the incident light within the specified operating range?
The specifications for your sensor are included in the Specifications Sheet. Be careful not to confuse the "Resolution" specification with the minimum measurable power (the resolution is the minimum detectable change in power and is equal to the least significant digit on the console's display when the console is set to the lowest measurment range).
Example: The S120C is specified as having an optical power range between 50 nW and 50 mW and a resolution of 1 nW. This means that the minimum measurable power is 50 nW and that the least significant digit on the display for this measurement range will have a value of 1 nW.
How well was the sensor zeroed?
Photodiode sensors will emit a low level current even if no photons are incident on the active area, referred to as the sensor's dark current. The dark current, which is temperature dependent, will generally be on the order of a few nA for Si and InGaAs sensors and up to a few µA for Ge sensors.
Thermopile sensors need to be zeroed if thermal differences appear between the active area (thermal disk) and the sensor heat sink in the dark state (no incident light upon the active area) or in the case that the heat sink becomes hot during light exposure. The voltage generated by a thermopile with no light incident on the active area will be negative if the heat sink is hotter than the active area and positive if the heat sink is cooler than the active area. When both the heat sink and detector are at room temperature, a voltage of a few µV is typical.
The effects of dark current can be avoided by correctly zeroing the sensor. Detailed instruction can be found in the manual for you sensor head.
Frequently Asked Questions
Can the maximum repetition rate of an energy sensor be increased?
For applications requiring repetition rates ≥250 Hz, consider our ES3xxC and ES4xxC fast pyroelectric sensors which have a maximum repetition rate of up to 10 kHz. To increase the maximum measurable repetition rate of the ES1xxC and ES2xxC sensors, use the energy sensor with an oscilloscope (High Z input) and a 100 kΩ termination resistor. Disconnect the BNC connector of the sensor from the red D-sub connector; then, connect it via the 100 kΩ terminator to the high impedance Y input of the scope.
Is the specified maximum optical power of the photodiode and integrating sphere sensors related to CW or pulsed power?
The maximum power range is specified for use with CW sources. For pulsed light sources, the pulse peak power must not exceed this value in order to avoid saturation of the photodiode.
Can I use the photodiode-based sensors for pulsed measurements?
Under certain conditions, the average power of pulsed light sources can be measured. The pulse peak power must not exceed the specified maximum optical power to avoid saturating the sensor. Please refer to the Measurement Considerations/Power Measurement of Pulsed Signals section of the power meter manual or the appropriate trouble shooting topic for further information.
How does an integrating sphere work? Can I use it for measurements of pulsed lasers?
See the Overview tab to learn how an integrating sphere functions. Integrating spheres can be used for pulsed signal measurements under the same conditions as photodiode sensors.
My ESxxxC sensor does not show any energy. Which settings do I need to change? What is the definition of the trigger level?
Check if the measurement range and trigger level are set correctly. The trigger level defines the minimum measureable pulse energy and is required to suppress sensor noise. If you are measuring a pulsed signal, check if the sensor is capable of detecting signals with your source's repetition rate and pulse length.
| Sensor Type | Parameters Indicating Damage Thresholds |
|---|---|
| Photodiode (Except Integrating Sphere) | Maximum Average Power Density Maximum Pulse Energy |
| Integrating Sphere (Photodiode) | Maximum Average Power Density Maximum Pulse Energy Maximum Intermittent Power (2 min) |
| Thermal Sensor | |
| Pyroelectric Sensor | Maximum Power Density (Peak Power) Maximum Pulse Energy Density Maximum Average Power |
How is the damage threshold defined? Do I need to use the peak power value or the average power value?
When measuring pulsed signals, the damage threshold depends on a variety of parameters such as pulse duration, beam diameter, and power (pulse energy). The maximum ratings given for our power and energy sensors should not be exceeded, particularly those listed for the maximum power or energy densities. Exceeding these values might damage the sensor.
The "Maximum Intermittent Power (2 min)" specification is given for sensors capable of measuring high powers. This value is specified above the upper limit of the measurement range; consequently, the sensor will not give correct power readings if used with these high intermittent powers. However, the sensor will not be damaged if it is exposed to these power levels for less than 2 minutes. In the case of pulsed signals, the average power of the pulse must not exceed this specification. Please refer to the Definitions tab to see how these parameters are calculated.
Which sensors can I use for measuring femtosecond pulses?
A thermal sensor will provide the best results when measuring the average power of a femtosecond laser pulse.
How can I increase the bandwidth of an ES1xxC or ES2xxC sensor?
If we assume that the bandwidth is equivalent to the maximum pulse repetition rate, this parameter can be altered by changing the input resistance of the measurement device. In the case of a power meter console, the input resistance is fixed at 1 kΩ and the maximum repetition rate cannot be changed. In order to increase the repetition rate, see the Sensor Tutorial tab for how to accomplish this using an oscilloscope and a 100 kΩ termination resistor for the ES1xxC and ES2xxC sensors. Alternatively, consider our ES3xxC and ES4xxC sensors which have a maximum repetition rate of up to 10 kHz.
What is the difference between resolution and minimum optical power?
The resolution is the minimum detectable change of power. The minimum optical power is given by the optical power range of the sensor. Please see the Tutorial tab for an example.
Sensor Specifications
| Parameter | Definition | Sensor Types |
|---|---|---|
| Wavelength Range | The range of wavelengths over which the sensor is calibrated. The specified measurement uncertainty only applies for this wavelength range. |
All Sensors |
| Resolution | This is the minimum detectable change of the measured parameter. Resolution is always specified for a certain console type and bandwith setting, which is typically given in the footnotes of the specifications table on the sensor's spec sheet. | All Sensors |
| Measurement Uncertainty | This parameter indicates the measurement accuracy and is generally specified for the entire wavelength range of the sensor. For certain sensor types, several values may be specified (on the specification sheet), with different values corresponding to different regions of the specified wavelength range. | All Sensors |
| Optical Power Range | The optical power range lists the minimum and maximum measurable power that the sensor can detect. Exceeding the upper limit leads to sensor saturation and incorrect measurement results. When measuring pulsed signals, the peak power of the pulse must not exceed the maximum measurable power to avoid saturation. Attempting to use a sensor to acquire power measurements below the lower limit will increase the measurement uncertainty due to the effects of noise. | Photodiode, Integrating Spheres, Thermal |
| Optical Energy Range | Specifies the minimum and maximum measurable energy. Care should be taken when setting the trigger level to measure pulses with energy levels close to the lower limit of the optical energy range. Sensor noise may interfere with the pulse edge triggering the sensor correctly, causing incorrect measurement results. | Pyroelectric |
| Linearity | Linearity is the percentage change in the sensor's responsivity (in A/W, V/W, or V/J, depending upon the sensor) over the optical power range. In this range, the output photocurrent is linearly dependent on the incident optical power. Outside the optical power range, the sensor's response deviates from linear, due to saturation at higher powers and the noise floor at lower powers. | All Sensors |
| Max Average Power Density | The average power per unit area that can be incident on the sensor without causing damage. This value must not be exceeded to avoid damaging the sensor. Equations for calculating the average power density of a light source with a square pulse train and circular beam shape are given below in the Calculations section. | Photodiode, Integrating Spheres, Thermal |
| Max Pulse Energy | An alternative specification to the max average power density. The total energy in a pulse must not exceed this value to avoid damaging the sensor. | Photodiode |
| Max Pulse Energy Density | Another alternative specification to the max average power density. The maximum energy density a pulse can have before causing damage to the sensor. Besides thermal sensors and integrating spheres, we provide this specification for our fiber power sensors. Fibers may have a very small beam diameter at the tip, leading to high energy densities that could damage the sensor if they are above this specification. | All Sensors |
| Max Intermittent Power (2 minutes Max) |
The maximum power that can be applied to the sensor for less than 2 minutes without causing damage. For pulsed signals, this value should be compared with the average power of the pulse train. This specification is higher than the maximum measurable power, so the sensor will be saturated at this value and provide an incorrect measurement. | Integrating Spheres, Thermal |
| Max Power Density | This value is related to the peak power of the incident pulse and should not be exceeded to avoid damaging the sensor. | Pyroelectric |
| Max Average Power | The maximum average pulse power that can be incident on the sensor without overheating it. Equations for calculating the average power of a light source with a square pulse train and circular beam shape are given below in the Calculations section. | Pyroelectric |
Console Specifications
Measurement Range - The ranges that the power meter console can display power or energy readings. The optical power or energy measurement ranges for Consoles are stated in terms of current (photodiode sensors) or voltage (thermal and pyroelectric sensors). How the current or voltage is converted to a power or energy measurement is sensor dependent.
Display Resolution - The minimum detectable change in power or energy that can be shown on the power meter console's display screen. These values are also given in terms of current or voltage, as this is the input that the console measures. The optical power resolution will depend on the responsivity of the detector connected to the console.
Current Input Resolution - This specification applies to photodiode sensors and is generally specified in terms of current per responsivity value, e.g. "1 pA / Responsivity Value (A/W). This means that the console has a resolution of 1 pA in its lowest measurment range. Note at this is not the minimum measurable power. As the responsivity of photodiode sensors is wavelength dependent, the power resolution of the console will be wavelength dependent as well.
Example: An S120C sensor has a responsivity of 7.35 × 10⁻² A/W at 930 nm, and 5.05 × 10⁻³ A/W at 455 nm. In the lowest measurement range the displayed power resolution is at 930 nm given by
1.1 x 10⁻¹² A/(1.36 x 10-11 A/W) = 13.6 pW and at 455 nm by 1.1 x 10-12 A/(5.05 x 10-3 A/W) = 198 pW. Note that this is not the same as the minimum measurable optical power for the S120C of 50 nW.
Voltage Input Resolution - Typically, power and energy meters will have the voltage resolution specified separately for thermopile and pyroelectric sensors. For thermopile sensors, this value is specified as volts per responsivity value in V/W, e.g. 1 µV/Responsivity Value (V/W). As with photodiode sensors, the power resolution will depend on the responsivity of the sensor. For pyroelectric sensors, the resolution will be specified as volts per responsivity value in V/J, e.g. 100 µJ/ Responsivity Value (V/J). Again, the energy resolution is sensor dependent.
Accuracy - The power meter accuracy is determined by the voltage or current measurement accuracy. This value is typically given as a percentage of the full scale value (% f.s.). The console's accuracy is a different specification than the sensor's measurement uncertainty.
Wavelength Correction - A value that can be entered into the console in order to apply the correct responsivity so that the correct power or energy reading calculated and displayed. Thorlabs calibrated sensors have a responsivity calibration tables stored in their connectors. Our consoles can access this information to perform the power or energy calculation. For custom sensors, the console needs to be set to the correct sensor type (photodiode, thermal, or pyroelectric) and the responsivity will need to be entered as a numerical value.
Calculations
The following equations can be used to quickly convert the parameters defining a square pulse train into values that can be compared to the specifications of our sensors. The first table outlines how use the pulse duration and pulse period to calculate the repetition rate and duty cycle, how to convert between average and peak power, and how to use the power to determine the total energy in your pulse. The second table describes how calculate the power and energy densities for a circular beam with a square pulse train using these parameters. Making sure that the power density and/or energy density of your source are within the specifications of the sensor is important in order avoid damaging the sensor head.
| Pulse Characteristic | Equation |
|---|---|
| Repetition Rate: fP |  |
| Duty Cycle: D | 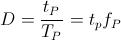 |
| Pulse Average Power: Pav | 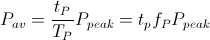 |
| Pulse Peak Power: Ppeak | 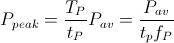 |
| Energy: W | 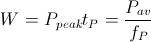 |
Pulse Parameters
| tP: Pulse Duration | TP: Pulse Period |
| Ppeak: Pulse Peak Power | Pav: Pulse Average Power |
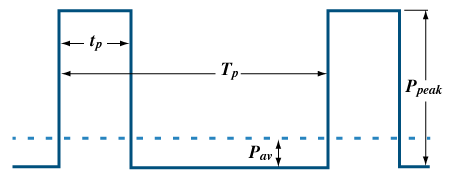
The diagram above outlines the defining properties of a square pulse train.
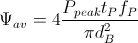
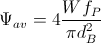
Power and Energy Density
Power density and energy density are defined as the power or energy per unit area of a beam, respectively. The following formulas are based on a circular beam shapre with a beam diameter dB and an area of

For non-circular beam shapes, other forumlas must be used to calculate the beam area.
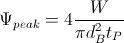
The average power density is the ratio of the average power of the light beam to the area illuminated by the beam.
| Pulse Characteristic | Known Pulse Parameters | Formula |
|---|---|---|
| Average Power Density: Ψav | Average Power: Pav Beam Diameter: dB |
 |
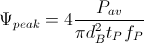
| Pulse Peak Power: Ppeak Repetition Rate: fP Pulse Duration: tP Beam Diameter: dB |
 |
|
| Pulse Energy: W Repetition Rate: fP Beam Diameter: dB |
 |
|
| Peak Power Density: Ψpeak | Pulse Peak Power: Ppeak Beam Diameter: dB |
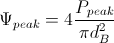 |
| Pulse Energy: W Pulse Duration: tP Beam Diameter: dB |
 |
|
| Average Power: Pav Repetition Rate: fP Pulse Duration: tP Beam Diameter: dB |
 |
|
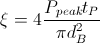
| Pulse Energy Density: ξ | Pulse Energy: W Beam Diameter: dB |
 |
| Pulse Peak Power: Ppeak Pulse Duration: tP Beam Diameter: dB |
 |
|
| Average Power: Pav Repetition Rate: fP Beam Diameter: dB |
 |
| Posted Comments: | |
Prabhu Das
(posted 2023-10-23 16:08:24.15) Can you help us out in applicability of Power meter and sensor product in out application - Electrical maintenance in Steel Industry. We have many laser sensors and we need a condition monitoring system to check its healthiness level. dpossin
(posted 2023-10-25 05:35:12.0) Dear Prabu,
Thank you for your feedback. I will reach out to you in order to discuss possible solutions. user
(posted 2021-11-09 05:49:14.057) I need to measure the total power emitted by a white light source. I do not need the power per wavelength. I just need a total estimate. Would using a photodiode (e.g. S130C) and any console (e.g. PM100D) centered around 500 nm be a good approximation? Is there any other wavelength that would represent a better approximation? The center wavelength of my spectrum or the mean sensitivity of the photodiode? soswald
(posted 2021-11-12 05:13:37.0) Dear customer,
thank you for your feedback. For measurements of broadband sources we recommend thermal power sensors: https://www.thorlabs.de/newgrouppage9.cfm?objectgroup_id=3333
Their responsitivity vs. wavelength curve is flat compared to photodiodes so the measurement error by using an approximate wavelength is smaller.
The intensity-weighted center wavelength of your source's spectrum should give the best approximation. Zhiqiang Wang
(posted 2020-03-03 23:30:09.213) How to use MATLAB to cummunicate with PM 100D power meter?
Is there some other way to read out and save the data from the power meter? nreusch
(posted 2020-03-04 08:27:19.0) This is a response from Nicola at Thorlabs. Thank you for your inquiry. There are several ways to read out and save data from a power meter via USB port, e.g. by using the graphical user interface that we provide or by means of a program code. For MATLAB, we recommend to use the SCPI commands that are listed in the manual of PM100D. I will send you an instruction. aklossek
(posted 2017-07-04 12:55:58.81) Dear ladies and gentlemen,
we are using a 80MHz laser with pulse width of about 6ps.
Our classic thermal sensors show laser powers that are 4-5 times higher than the actual laser power.
Do you have an idea what it's wrong and wich power meter would you suggest?
Best regards
André Klossek swick
(posted 2017-07-05 03:48:31.0) This is a response from Sebastian at Thorlabs. Thank you for the inquiry. I have contacted you directly for assistance. mizuno.k.ae
(posted 2017-01-28 17:34:31.257) いつもお世話になっております。東京工業大学波多野研究室の水野と申します。
センサS121C(SN16111644)およびコンソールPM100D(SNP0012879)を用いてレーザーパワー(532nm, CW)の測定を行っています。
これまで問題なく使用していましたが、コンソール表示値に不可解な挙動を見たので連絡いたします。
1. 明らかに数十mWほどのレーザーが入射しているのに表示が数uWになってしまう。この状態でコンソールの電源を切って再起動すると50mWと表示される。
2. 校正期限の切れた他社製(OPFIR)パワーメータで2.2mWと表示されている状態(目視した感覚でもその程度と思われます)で、コンソール表示は0.8mWとなる。この状態で表示レンジを変えると表示値も変わる。レンジを高いものにすると表示が2.2mWになる。
おそらくレンジ設定に関してコンソールのソフトウェアに問題があると思うのですが、
コンソールの中身をアップデートする方法などありますでしょうか?
対処方法など指示をお願い致します。 tfrisch
(posted 2017-02-14 04:27:42.0) Hello, thank you for contacting Thorlabs. It looks like you are already in contact with the Tech Support Branch in our Japan office. |