 Products Home / Optical Fiber & Fiber Patch Cables / Fluoride Optical Fiber / AR-Coated Multimode Fluoride Fiber Optic Patch Cable
AR-Coated Multimode Fluoride Fiber Optic Patch Cable
- Features Fluoroindate (InF3) Fiber with Transmission from 310 nm to 5.5 µm
- AR-Coated on Both Ends for 4.0 - 4.6 µm
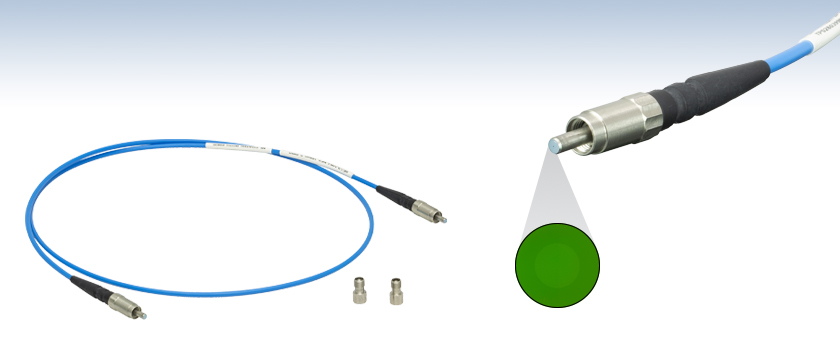
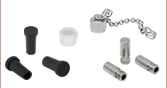
- SMA905 Connectors with Stainless Steel Caps
SMA905 Connectors AR Coated for 4.0 - 4.6 µm
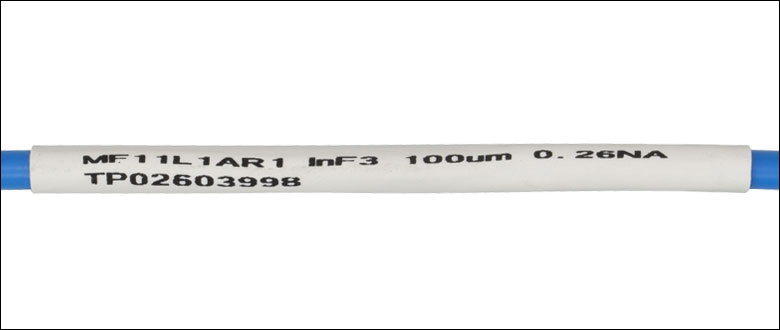
MF11L1AR1
Included Caps
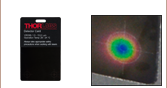
AR-coated endface of an MF11L1AR1 cable under 50X magnification. The bright green color is due to the AR coating.


Please Wait
Applications
- Spectroscopy
- Environmental Monitoring
- Chemical Sensing
- Systems Requiring Low Feedback

Click to Enlarge
Click for Raw Data
Compared to standard silica glass fibers, Thorlabs' multimode
fluoride fibers are transmissive at much longer wavelengths.
Features
- Incorporates Fluoroindate (InF3) Fiber Manufactured at Thorlabs' Fiber Draw Facility
- Core Size: Ø100 µm
- Stiff, Ø3.0 mm Plastic Jacket and SMA905 Connectors
- Antireflection-Coated for for 4.0 - 4.6 µm
- <0.50% Average Reflection Loss
- Compatible with Visible-Wavelength Alignment Beams
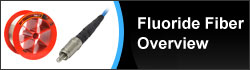
The MF11L1AR1 AR-Coated Multimode Fluoride Fiber Patch Cable is designed for low-loss transmission in the mid-IR spectral range. It incorporates Thorlabs' InF3 (fluoroindate) multimode optical fiber, which is manufactured in-house and has world-class purity, precision, and strength. For more information about fluoride glass and our manufacturing process, see the Manufacturing tab or our main fluoride fiber web presentation.
Fluoride fibers offer low attenuation in the mid-IR wavelength range, aided by an extremely low hydroxyl ion (OH) content. Our fluoroindate (InF3) patch cables have a transmission range of 310 nm - 5.5 µm. The graph to the right shows how the wavelength-dependent attenuation compares to a fused silica fiber, as well as our ZBLAN multimode fiber. To further reduce light loss, the MF11L1AR1 cable features an antireflection (AR) coating for 4.1 - 4.6 μm on both end faces. This coating suppresses average Fresnel losses to <0.50% per face across this range, which can reduce feedback to sensitive systems such as quantum cascade lasers (see the Applications tab for details).
Click to Enlarge
The MF11L1AR1 patch cable is labeled with its item #, key specifications, and batch number.
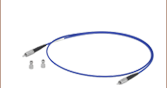
Both ends of each cable are terminated using SMA905 connectors. Each cable includes two stainless steel protective caps that shield the ferrule ends from dust and other hazards. Replacement CAPM (rubber) and CAPSM (metal) caps for SMA905-terminated cables are available separately.
Since fluoride glass is softer than standard silica glass, extra care should be taken while cleaning and handling. See the Handling tab for suggested procedures. Compared to unterminated fiber, the maximum power that these cables can withstand is limited by the connectors. Depending on the application, we recommend using these cables with a maximum CW power of several Watts.
Thorlabs offers AR-coated silica patch cables for use in the 250 - 370 nm, 400 - 700 nm, or 650 - 1100 nm wavelength ranges. We also offer uncoated multimode fluoride patch cables, bare fluoride fiber, single mode patch cables, and other fluoride fiber components. See the selection guide below for links to the main web presentation for each type of component.
Custom Fluoride Patch Cables
If our standard offerings do not meet your needs, please contact us to discuss customization. Some of the many customization options we provide for fluoride patch cables include:
- Custom Options: Fiber Type, Length, Termination, and Tubing
- OEM Patch Cables: Designed for Application Requirements
- AR-Coated Patch Cables
- Ruggedized Cabling for Harsh Environments
| In-Stock Multimode Fiber Optic Patch Cable Selection Guide |
|---|
| Silica (180 nm to 2.4 µm) |
| Fluoride (285 nm to 5.5 µm) |
Fluoride Fibers and Components |
|||
 |
 |
 |
 |
 |
 |
 |
 |
| MF11L1AR1 Specifications | |
|---|---|
| Connectors | SMA905 |
| Jacket | FT030DF-B |
| Fiber Type | Fluoroindate (InF3) |
| Transmission Rangea | 310 nm - 5.5 µm |
| Typical Attenuationb | 0.1 dB/m @ 2.5 µm and 3.6 µm |
| Maximum Attenuationb | ≤0.25 dB/m (from 2.0 to 4.6 µm) |
| NAc | 0.26 ± 0.02 @ 2 µm |
| Typical Core Indexd | 1.487 @ 3.6 µm |
| Core Diameter | 100 ± 2.0 µm |
| Cladding Diameter | 192 ± 2.5 µm |
| Coating Diameter | 287 ± 15 µm |
| Core/Cladding Concentricity | ≤2 µm |
| Core Circularity | ≥98% |
| Long-Term Bend Radiuse | ≥5 cm |
| Short-Term Bend Radius | ≥2.5 cm |
| Operating Temperature | -40 to 85 °C |
This tab contains plots of the typical attenuation, numerical aperture, and core and cladding refractive indices of our Ø100 μm InF3 fiber as a function of wavelength. Variations in these properties can occur between fiber draws. Please contact Tech Sales to discuss whether this patch cable is appropriate for your application.
 Click to Enlarge
Click for Raw Data
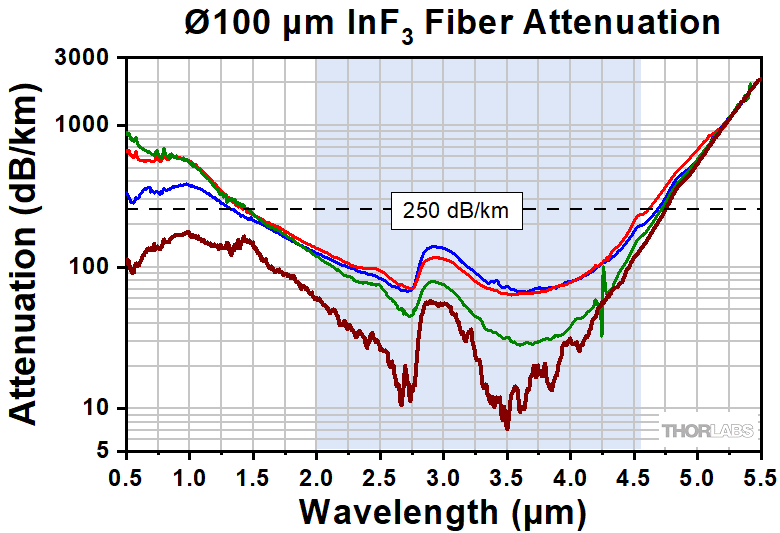
This graph contains the measured attenuation from four independent runs of uncoated Ø100 µm core InF3 fiber. The shaded region from 2.0 - 4.6 µm represents the wavelength range with guaranteed attenuation performance, represetned by the dashed line.
Click to Enlarge
Click for Raw Data
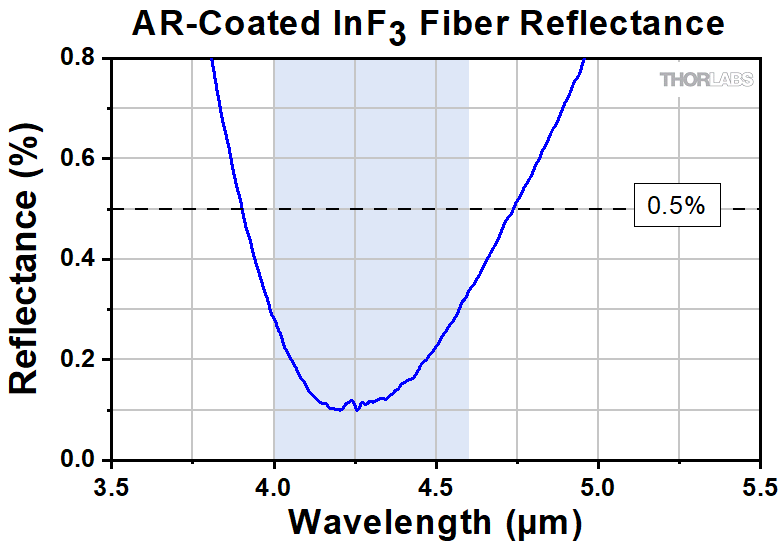
Reflectance of an AR-coated Ø100 µm core InF3 fiber. The shaded region represents the 4.0 - 4.6 µm range over which the coating provides <0.5% average reflectance.

Click to Enlarge
Click for Raw Data
This graph shows the typical refractive indices of the core and cladding of our Ø100 µm InF3 fiber. The graphed data was obtained by fitting the Sellmeier equation to measured data. The Sellmeier equation and best-fit parameters for the core and cladding can be seen below.
 Click to Enlarge
Click for Raw Data
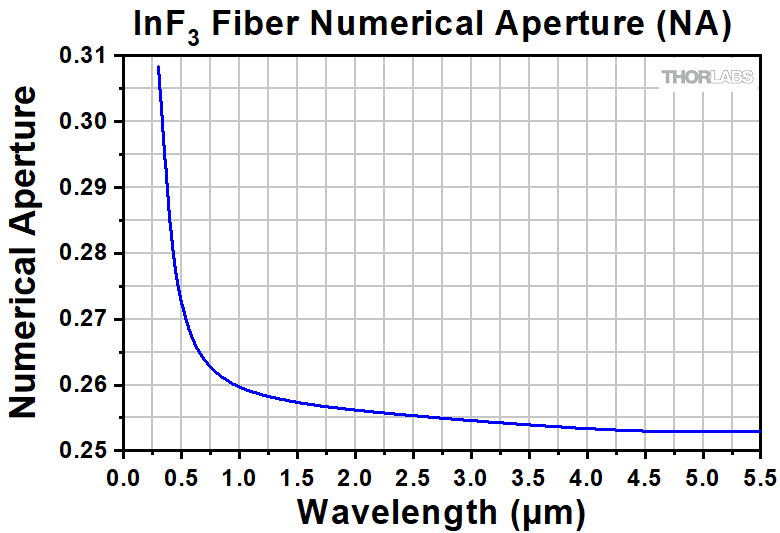
This graph shows the typical numerical aperture (NA) for the Ø100 µm InF3 fiber, calculated from the core and cladding refractive indices.
Sellmeier Equation
| Sellmeier Coefficients | ||
|---|---|---|
| Coefficient | Core | Cladding |
| u0 | 0.47627338 | 0.68462594 |
| u1 | 0.76936893 | 0.4952746 |
| u2 | 5.01835497 | 1.4841315 |
| u3 | 0.0179549 | 0.0680833 |
| u4 | 0.11865093 | 0.11054856 |
| u5 | 43.64545759 | 24.4391868 |
| A | 1 | 1 |
Click to Enlarge
This diagram compares on-axis tension, which can be safely applied, to off-axis tension, which can induce unsafe curvature and damage the fiber.
Click to Enlarge
The recommended procedure for removing tape from the bare fiber spools is shown in this image. The tape should be pulled parallel to the fiber when removing, while the other hand applies gentle force to stabilize the fiber.
Click to Enlarge
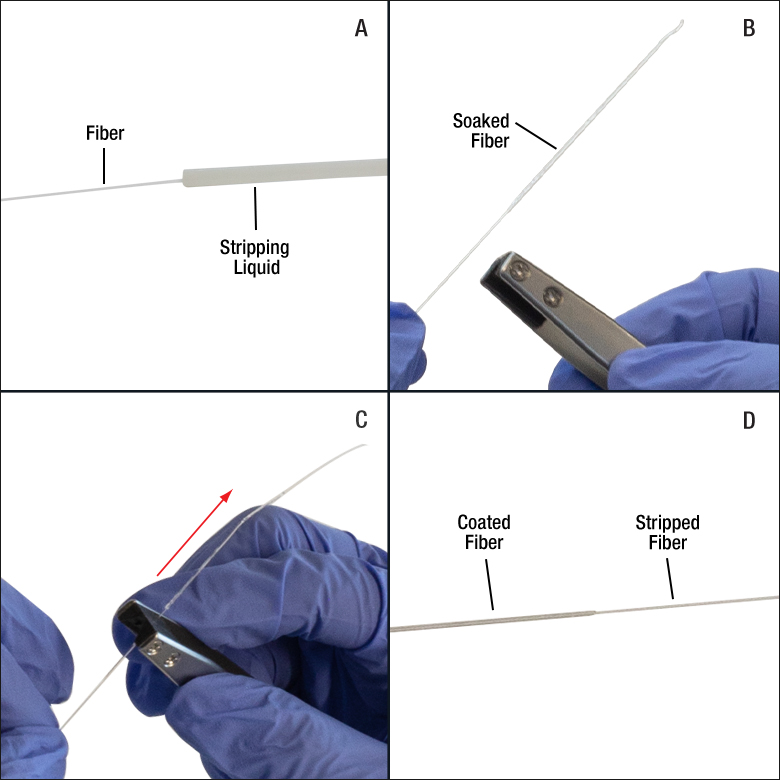
These images depict the recommended stripping procedure. A: Immerse the target fiber secion in stripping liquid.
B-C: Gently pinch the base of the soaked section with FSGT tweezers and pull toward the end of the fiber.
D: The coating should slide off, leaving a stripped section.
The material properties of fluoride glass differ from those of silica glass. This tab details recommended handling procedures for our fluoride fibers and patch cables.
Safety and Disposal
ZBLAN and InF3 glasses may present health risks. Information about the composition of our fluoride fibers is available from Tech Support upon request. When handling bare, stripped fluoride fiber, chemically resistant gloves such as our nitrile gloves should always be worn. Fiber shards generated from cleaving should be disposed of in a sharps container such as our FTDU fiber optic disposal unit.
Thorlabs will accept and dispose of any fluoride fiber or filled disposal units that you wish to discard. Please contact Tech Support before returning fiber or filled disposal units. If you wish to dispose of fiber locally, please follow all applicable local laws and regulations.
Storage
Because fluoride glass is softer than silica glass, exposed end faces are easily scratched during storage, and care should be taken to ensure that they are not exposed to mechanical abrasion. Storage under normal lab temperatures and humidities will not affect the integrity of the fiber. Prolonged, direct contact with liquid water or water vapor should be avoided.
Bending and Tension
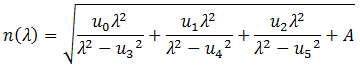
Fluoride fiber is strong in tension, but can break easily if forces are applied off-axis or if it is bent to a small radius. These fibers should never be bent to smaller than their short-term bend radii. Moderate on-axis forces can be safely applied to the fiber, such as tension applied during spooling. The diagram to the right demonstrates safe on-axis tension and unsafe off-asix tension.
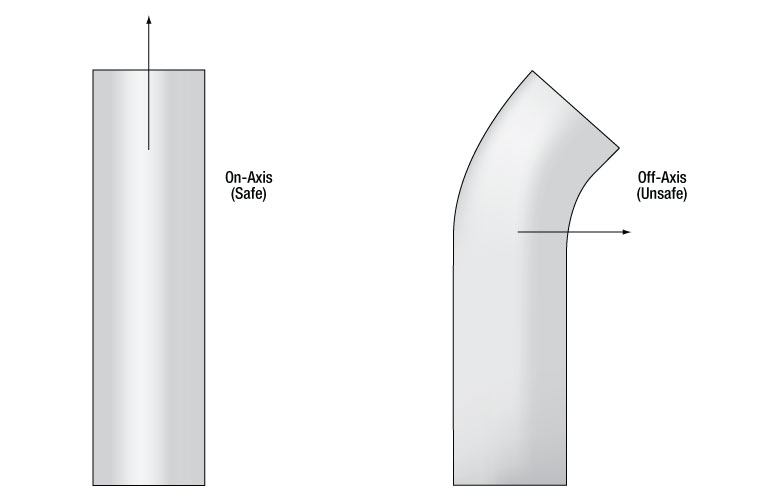
Our bare fluoride fibers ship on a spool, with their ends taped to the spool body. When removing the fiber, the tape should be pulled parallel to the fiber, as shown in the image to the top right.
For protection, our fluoride patch cables are jacketed with PVDF furcation tubing or stainless steel tubing that is stiffer than the jackets used in typical patch cables. As long as the jacket is not forced to bend below its specified minimum radius, the fiber will remain intact. For out patch cables with PVDF jackets, the tubing will become discolored if the bending limit is exceeded. Our patch cables with stainless steel tubing are designed so that the tubing mechanically limits the fiber to be unable to bend below its minimum radius.
Stripping
Fluoride fibers are susceptible to damage when conventional mechanical stripping techniques are used, owing to the softness of the glass. Our FSGT Coating Stripping Tweezers can be used along with a chemical stripping agent to effectively strip these fibers without scratching or nicking the cladding.
To strip a fiber, the coating should first be exposed to a stripping liquid such as a paint stripper for three to five minutes. Placing the stripping liquid in a long vessel such as a syringe with a long tip is recommended to increase ease of application. If using a gel-type stripper, it can be applied manually to the exterior of the fiber. Note that the required soaking time will depend on the particuar stripping agent being used as well as the chemical composition of the coating. For example, if a dicholomethane (DCM) based stripping liquid is used, the required time may be shorter.
The coating on the section of the fiber soaked in stripping liquid will visibly swell, as seen in section B of the image to the right. A pair of FSGT tweezers can then be used to gently pinch the fiber in the soaked section, and pull toward the end of the fiber. Care should be taken to ensure that only moderate pressure is applied, or else the fiber may break. The soaked coating should slide off the end of the fiber, leaving the cladding exposed. If residue remains on the stripped section, it can be cleaned as detailed below.
Refer to any safety documentation for the chemical stripping agent before use.
Click to Enlarge
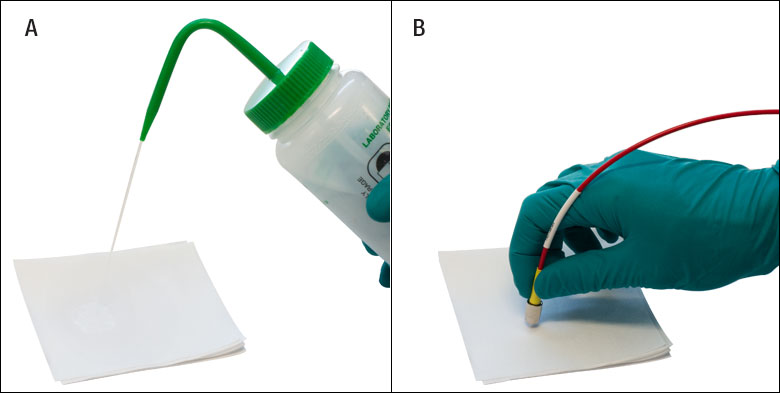
These images depict the recommended procedure for cleaning end faces with a solvent.
A: Wet a stack of five or mote TCW604 wipes with an appropriate solvent (see the text for examples).
B: Gently pass the fiber end face across the wet wipe.
Cleaning
Because fluoride glass is soft, end faces and stripped sections of our fluoride fibers and patch cables can be easily scratched during cleaning. If particulates are present on the glass surface, first try to remove them using compressed air. If compressed air is insufficient, then an appropriate solvent can be used with our TCW604 TechniCloth®† Lint-Free Wipes to clean the tip, as shown in the image to the left. Methanol and isopropanol are examples of appropriate solvents, while acetone is unsuitable. Wiping with a dry cloth is not recommended as it may scratch the surface.
Please note that Kimwipes®†† are extremely likely to scratch the fiber tip and should not be used.
Cleaving
Our fluoride fibers can be cleaved using a tension-and-scribe cleaver such as our Vytran® LDC401 large-diameter fiber cleaver. Note that cleaving these fibers may generate shards. Safety glasses and chemically resistant gloves should always be worn when cleaving.
†TechniCloth® is a registered trademark of the Illinois Tool Works, Inc. Corporation.
††Kimwipes® is a registered trademark of the Kimberly-Clark Corporation.
Click to Enlarge
Click for Raw Data
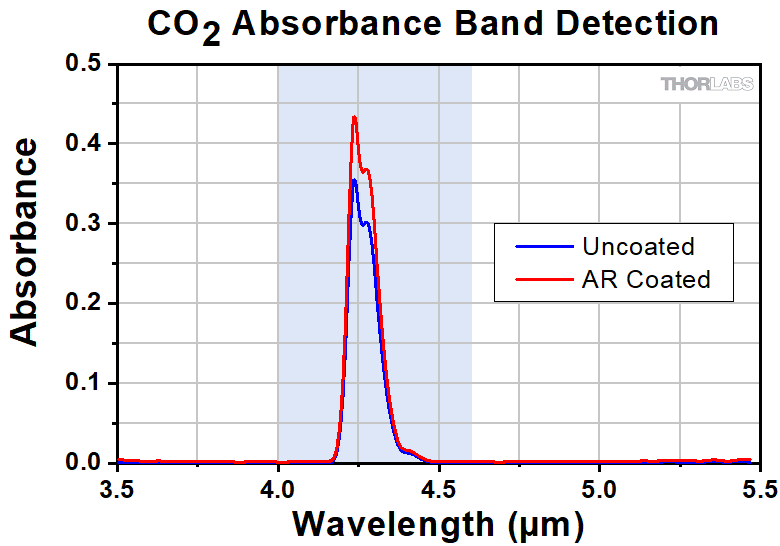
The CO2 4.3 µm band has a stronger signal using the AR-coated InF3 fiber than the uncoated InF3 fiber. The shaded region represents the 4.0 - 4.6 µm AR coating range of the fiber.
Usage Recommendations
Since fluoride glass is softer than standard silica glass, extra care should be taken when handling this patch cables. Please see the Handling tab for fluoride-fiber-specific usage tips. Compared to unterminated fiber, the maximum power that these cables can withstand is limited by the connectors. Depending on the application, we recommend using these cables with a maximum CW power of several Watts.
Example Application: MIR Spectroscopy
This AR-coated InF3 patch cable can help improve sensitivity in spectroscopy, environmental monitoring, and chemical sensing applications. Major absorption bands for CO, CO2, and N2O all occur between 4.0 µm and 4.6 µm. The AR coating on this cable helps to propagate the signature generated by these molecules with reduced reflection loss, leading to improved signal strength.
This increase in signal can be seen in example data from the CO2 4.3 µm absorption band shown in the graph to the right. The experimental setup that collected this data used an FTIR spectrometer with an InSb detector. White light from the FTIR was coupled into the fiber using an Off-Axis Parabolic (OAP) mirror. A second OAP mirror then coupled light from the fiber into the InSb detector. The FTIR has open air spaces between the fiber output and the detector into which CO2 gas was introduced through respiration. Scans were made in the absence of respiration to establish a baseline and then the performance of the AR-coated InF3 patch cable was compared to the performance of the uncoated InF3 patch cable (Item # MF11L1). Although this experiment was elementary, it indicates that the AR coating on the InF3 patch cables can aid spectroscopy and other chemical sensing applications in the 4.0 - 4.6 µm range.
Example Application: Quantum Cascade Lasers
The AT coating on this cable can significantly reduce harmful reflections to sources sensitive to feedback, such as QCLs. We highly recommend using these cables when working with MIR Fabry-Perot lasers such as Item #s MLQF4000 (center wavelength of 4.00 µm) or MLQF4550 (center wavelength of 4.55 µm). To couple a light source into the Ø100 InF3 core, a spot size of approximately 70 µm is needed. These Turnkey QCL lasers have a beam diameter of approximately 1.75 mm, giving an ideal focal length of f = 21.4 mm for the IR lens used to couple light into these Ø100 core patch cables. To couple light from MLQF4000 or MLQF4550 to the fiber, we recommend a translation stage (Item # MBT616D) with an SMA adapter (Item # HFB001B), a fixed angle bracket (Item # AMA009), an appropriate lens mount (HCS0xx series), and the IR lens (Si Plano-Convex, BaF2 Plano-Convex, or ZnSe Plano-Convex) best suited to your needs. To ensure minimal back reflections, optics can be mounted at a slight angle.
Other Applications
With the addition of a 500 nm wide bandpass filter centered around 4250 nm (Item # FB4250-500), these AR-coated InF3 patch cables are also well matched to white light sources such as SLS202La, a stabilized fiber-coupled IR light source providing a blackbody radiation spectrum spanning from the visible into the MIR. Some application examples are shown in the photos below.
Click to Enlarge
In this setup, a fluoride patch cable is used to propagate MIR light into a sample chamber for gas-phase spectroscopy. (More information on the pictured setup is available here.)
Click to Enlarge
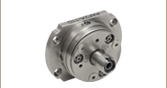
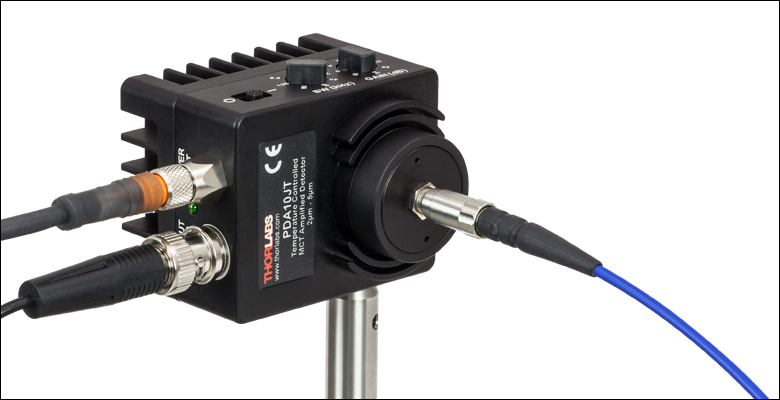
AR-coated fluoride patch cables can be connected to our MIR photodetectors using fiber adapters.
Click to Enlarge
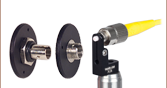
AR-coated InF3 patch cables can be incorporated into illumination applications that use our Stabilized Light Sources with the use of appropriate filters (see above).

Click to Enlarge
Total Internal Reflection in an Optical Fiber
Guiding Light in an Optical Fiber
Optical fibers are part of a broader class of optical components known as waveguides that utilize total internal reflection (TIR) in order to confine and guide light within a solid or liquid structure. Optical fibers, in particular, are used in numerous applications; common examples include telecommunications, spectroscopy, illumination, and sensors.
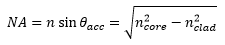
One of the more common glass (silica) optical fibers uses a structure known as a step-index fiber, which is shown in the image to the right. Step-index fibers have an inner core made from a material with a refractive index that is higher than the surrounding cladding layer. Within the fiber, a critical angle of incidence exists such that light will reflect off the core/cladding interface rather than refract into the surrounding medium. To fulfill the conditions for TIR in the fiber, the angle of incidence of light launched into the fiber must be less than a certain angle, which is defined as the acceptance angle, θacc. Snell's law can be used to calculate this angle:
![]()
where ncore is the refractive index of the fiber core, nclad is the refractive index of the fiber cladding, n is the refractive index of the outside medium, θcrit is the critical angle, and θacc is the acceptance half-angle of the fiber. The numerical aperture (NA) is a dimensionless quantity used by fiber manufacturers to specify the acceptance angle of an optical fiber and is defined as:
In step-index fibers with a large core (multimode), the NA can be calculated directly using this equation. The NA can also be determined experimentally by tracing the far-field beam profile and measuring the angle between the center of the beam and the point at which the beam intensity is 5% of the maximum; however, calculating the NA directly provides the most accurate value.
Number of Modes in an Optical Fiber
Each potential path that light propagates through in an optical fiber is known as a guided mode of the fiber. Depending on the physical dimensions of the core/cladding regions, refractive index, and wavelength, anything from one to thousands of modes can be supported within a single optical fiber. The two most commonly manufactured variants are single mode fiber (which supports a single guided mode) and multimode fiber (which supports a large number of guided modes). In a multimode fiber, lower-order modes tend to confine light spatially in the core of the fiber; higher-order modes, on the other hand, tend to confine light spatially near the core/cladding interface.
Using a few simple calculations, it is possible to estimate the number of modes (single mode or multimode) supported by an optical fiber. The normalized optical frequency, also known as the V-number, is a dimensionless quantity that is proportional to the free space optical frequency but is normalized to guiding properties of an optical fiber. The V-number is defined as:
![]()
where V is the normalized frequency (V-number), a is the fiber core radius, and λ is the free space wavelength. Multimode fibers have very large V-numbers; for example, a Ø50 µm core, 0.39 NA multimode fiber at a wavelength of 1.5 µm has a V-number of 40.8.
For multimode fiber, which has a large V-number, the number of modes supported is approximated using the following relationship.
![]()
In the example above of the Ø50 µm core, 0.39 NA multimode fiber, it supports approximately 832 different guided modes that can all travel simultaneously through the fiber.
Single mode fibers are defined with a V-number cut-off of V < 2.405, which represents the point at which light is coupled only into the fiber's fundamental mode. To meet this condition, a single mode fiber has a much smaller core size and NA compared to a multimode fiber at the same wavelength. One example of this, SMF-28 Ultra single mode fiber, has a nominal NA of 0.14 and an Ø8.2 µm core at 1550 nm, which results in a V-number of 2.404.
Click to Enlarge
Attenuation Due to Macrobend Loss
Click to Enlarge
Attenuation Due to Microbend Loss
Click to Enlarge
Beam profile measurement of FT200EMT multimode fiber and a former generation M565F1 LED (replaced by the M565F3) showing light guided in the cladding rather than the core of the fiber.
Sources of Attenuation
Loss within an optical fiber, also referred to as attenuation, is characterized and quantified in order to predict the total transmitted power lost within a fiber optic setup. The sources of these losses are typically wavelength dependent and range from the material used in the fiber itself to bending of the fiber. Common sources of attenuation are detailed below:
Absorption
Because light in a standard optical fiber is guided via a solid material, there are losses due to absorption as light propagates through the fiber. Standard fibers are manufactured using fused silica and are optimized for transmission from 1300 nm to 1550 nm. At longer wavelengths (>2000 nm), multi-phonon interactions in fused silica cause significant absorption. Fluoride glasses such as ZrF4 and InF3 are used in manufacturing Mid-IR optical fibers primarily because they exhibit lower loss at these wavelengths. ZrF4 and InF3 fibers have a multi-phonon edge of ~3.6 µm and ~4.6 µm, respectively.
Contaminants in the fiber also contribute to the absorption loss. One example of an undesired impurity is water molecules that are trapped in the glass of the optical fiber, which will absorb light around 1300 nm and 2.94 µm. Since telecom signals and some lasers operate in that same region, any water molecules present in the fiber will attenuate the signal significantly.
The concentration of ions in the fiber glass is often controlled by manufacturers to tune the transmission/attenuation properties of a fiber. For example, hydroxyl ions (OH-) are naturally present in silica and absorb light in the NIR-IR spectrum. Therefore, fibers with low-OH content are preferred for transmission at telecom wavelengths. On the other hand, fibers with high-OH content typically exhibit increased transmission at UV wavelengths and thus may be preferred by users interested in applications such as fluorescence or UV-VIS spectroscopy.
Scattering
For the majority of fiber optics applications, light scattering is a source of loss that occurs when light encounters a change in the refractive index of the medium. These changes can be extrinsic, caused by impurities, particulates, or bubbles; or intrinsic, caused by fluctuations in the glass density, composition, or phase state. Scattering is inversely related to the wavelength of light, so scattering loss becomes significant at shorter wavelengths such as the UV or blue regions of the spectrum. Using proper fiber cleaning, handling, and storage procedures may minimize the presence of impurities on tips of fibers that cause large scattering losses.
Bending Loss
Losses that occur due to changes in the external and internal geometry of an optical fiber are known as bending loss. These are usually separated into two categories: macrobending loss and microbending loss.
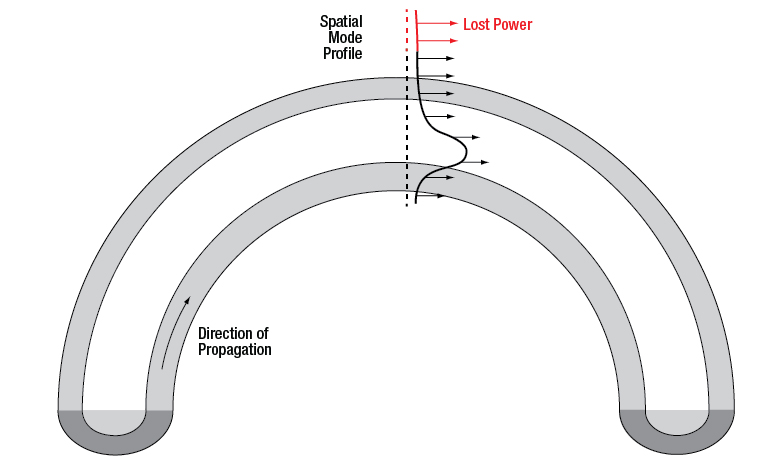
Macrobend loss is typically associated with the physical bending of an optical fiber; for example, rolling it in a tight coil. As shown in the image to the right, guided light is spatially distributed within the core and cladding regions of the fiber. When a fiber is bent at a radius, light near the outer radius of the bend cannot maintain the same spatial mode profile without exceeding the speed of light. Instead, the energy is lost to the surroundings as radiation. For a large bend radius, the losses associated with bending are small; however, at bend radii smaller than the recommended bend radius of a fiber, bend losses become very significant. For short periods of time, optical fibers can be operated at a small bend radius; however, for long-term storage, the bend radius should be larger than the recommended value. Use proper storage conditions (temperature and bend radius) to reduce the likelihood of permanently damaging the fiber; the FSR1 Fiber Storage Reel is designed to minimize high bend loss.
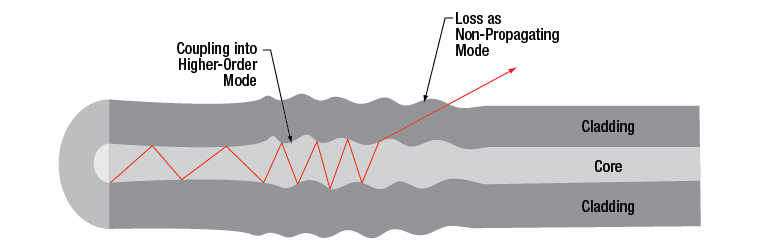
Microbend loss arises from changes in the internal geometry of the fiber, particularly the core and cladding layers. These random variations (i.e., bumps) in the fiber structure disturb the conditions needed for total internal reflection, causing propagating light to couple into a non-propagating mode that leaks from the fiber (see the image to the right for details). Unlike macrobend loss, which is controlled by the bend radius, microbend loss occurs due to permanent defects in the fiber that are created during fiber manufacturing.
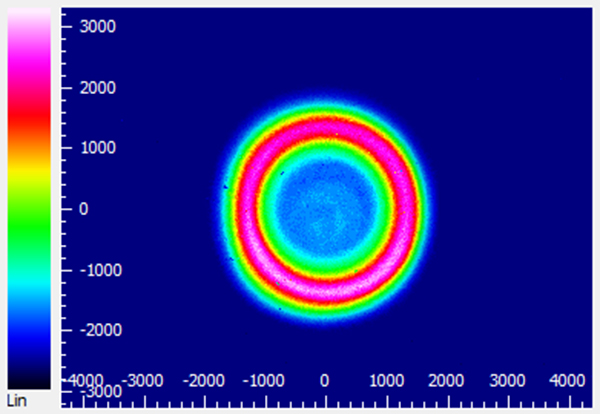
Cladding Modes
While most light in a multimode fiber is guided via TIR within the core of the fiber, higher-order modes that guide light within both the core and cladding layer, because of TIR at the cladding and coating/buffer interface, can also exist. This results in what is known as a cladding mode. An example of this can be seen in the beam profile measurement to the right, which shows cladding modes with a higher intensity in the cladding than in the core of the fiber. These modes can be non-propagating (i.e., they do not fulfill the conditions for TIR) or they can propagate over a significant length of fiber. Because cladding modes are typically higher-order, they are a source of loss in the presence of fiber bending and microbending defects. Cladding modes are also lost when connecting two fibers via connectors as they cannot be easily coupled between optical fibers.
Cladding modes may be undesired for some applications (e.g., launching into free space) because of their effect on the beam spatial profile. Over long fiber lengths, these modes will naturally attenuate. For short fiber lengths (<10 m), one method for removing cladding modes from a fiber is to use a mandrel wrap at a radius that removes cladding modes while keeping the desired propagating modes.
Launch Conditions
Underfilled Launch Condition
For a large multimode fiber which accepts light over a wide NA, the condition of the light (e.g., source type, beam diameter, NA) coupled into the fiber can have a significant effect on performance. An underfilled launch condition occurs when the beam diameter and NA of light at the coupling interface are smaller than the core diameter and NA of the fiber. A common example of this is launching a laser source into a large multimode fiber. As seen in the diagram and beam profile measurement below, underfilled launches tend to concentrate light spatially in the center of the fiber, filling lower-order modes preferentially over higher-order modes. As a result, they are less sensitive to macrobend losses and do not have cladding modes. The measured insertion loss for an underfilled launch tends to be lower than typical, with a higher power density in the core of the fiber.


Overfilled Launch Condition
Overfilled launches are defined by situations where the beam diameter and NA at the coupling interface are larger than the core diameter and NA of the fiber. One method to achieve this is by launching light from an LED source into a small multimode fiber. An overfilled launch completely exposes the fiber core and some of the cladding to light, enabling the filling of lower- and higher-order modes equally (as seen in the images below) and increasing the likelihood of coupling into cladding modes of the fiber. This increased percentage of higher-order modes means that overfilled fibers are more sensitive to bending loss. The measured insertion loss for an overfilled launch tends to be higher than typical, but results in an overall higher output power compared to an underfilled fiber launch.


There are advantages and disadvantages to underfilled or overfilled launch conditions, depending on the needs of the intended application. For measuring the baseline performance of a multimode fiber, Thorlabs recommends using a launch condition where the beam diameter is 70-80% of the fiber core diameter. Over short distances, an overfilled fiber has more output power; however, over long distances (>10 - 20 m) the higher-order modes that more susceptible to attenuation will disappear.
View our recorded webinar, in which we highlight our manufacturing techniques, the history of fluoride fiber R&D, and the state of fluoride fiber technology today and in the future.
Thorlabs manufactures ZBLAN zirconium fluoride (ZrF4) and indium fluoride (InF3) fibers at our vertically integrated fiber draw facility. The facility handles raw materials, glass preforms, fiber draw, and patch cable production, all in the same location. By controlling the process from start to finish, Thorlabs can ensure fibers consistently meet world-class specifications, including low attenuation, high mechanical strength, and precise geometry control.
The facility, located in Newton, NJ, USA, is well-equipped for high-volume manufacturing and is capable of producing many kilometers of fiber with consistent performance. In addition, because the fiber stays within Thorlabs' facilities from start to finish, the manufacturing process can be adjusted to accommodate unique custom orders or R&D needs.
Fluoride Characteristics
Fluoride fibers are ideal for transmission in the mid-IR wavelength range, and Thorlabs' fibers feature low attenuation over this range as a result of stringent manufacturing processes yielding an extremely low hydroxyl ion (OH) content. Fluoride fibers also have lower refractive indices and lower chromatic dispersion when compared to other fibers that offer transmission in the mid-IR range, such as chalcogenide glass fibers. Thorlabs' tightly controlled processes mitigate scattering and point defects in the fiber, as well as eliminate micro-crystallization in the glass matrix.
Fluoride Fiber Characterization and Testing
In addition to manufacturing fiber, Thorlabs offers testing and characterization services for our fiber products. We precisely measure the properties of each drawn fiber to ensure that it meets our high standards of quality. Extensive testing also provides feedback for our fiber draw team, enabling tight control of each step in the manufacturing process. Customers can request custom testing of any Thorlabs-manufactured fiber, which is then provided with the shipped fiber. Testing of third-party fiber samples provided by customers is also available upon request.
Available tests and services include:

Click to Enlarge
A Thorlabs engineer mixes raw materials in our fluoride glass fabrication facility.

Click to Enlarge
A Glass Drop During the Fiber Draw Process
- Spectral Attenuation Measurement
- UV / Visible / NIR / MIR Wavelength Range
- SM or MM Fiber and Bulk Glass
- SM Fiber Cutoff Wavelength Measurement
- Fiber NA Measurement
- Fiber Glass / Coating Geometry Measurement
with Sub-µm Accuracy - MIR High-Power Screening for MM Fibers
- Fiber Tensile Strength Testing
- Defect / Break Analysis
- Degree of Cure Testing for Fiber Coatings
Request testing for Thorlabs or third-party fibers by
contacting Tech Sales.
Click to Enlarge
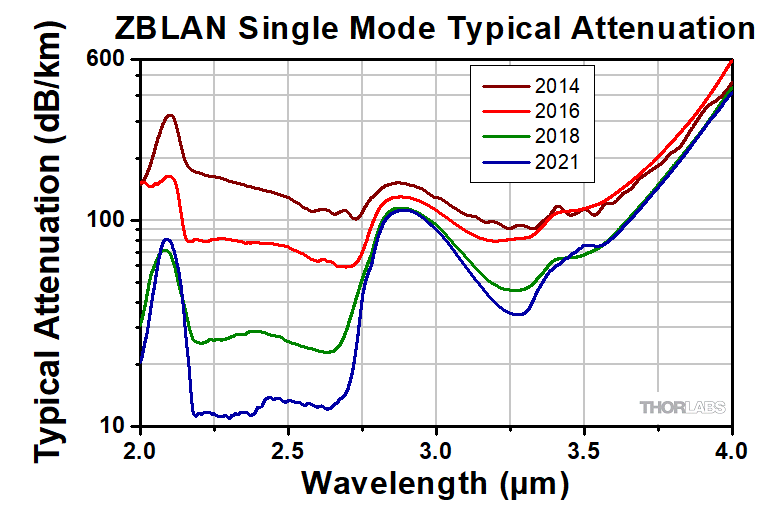
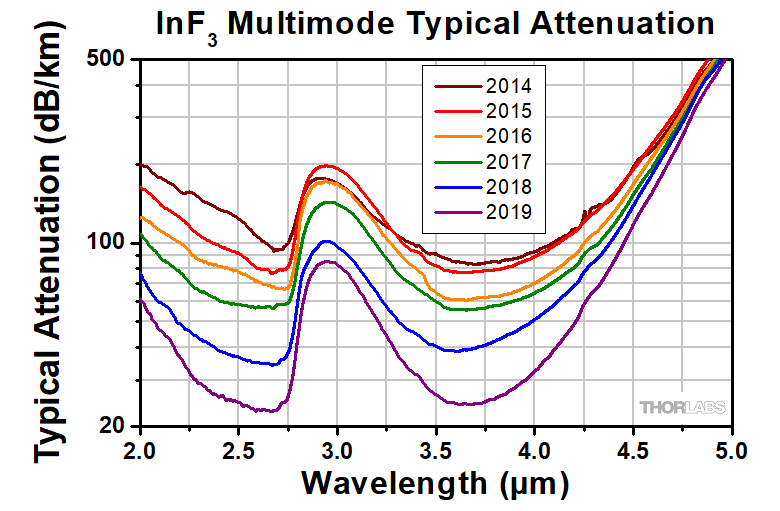
These graphs show Thorlabs' steady improvement in the average attenuation of all fiber draws during the given year.
Technical Team
Thorlabs' team of MIR fiber researchers and engineers has many years of experience in fluoride glass research and development, production, and fiber draw. Their knowledge and expertise have resulted in consistent improvement in the quality of our fluoride fiber. See the graphs to the left for the progression of our fluoride fiber performance.
Custom Fluoride Fiber and Patch Cables
If our standard offerings do not meet your needs, please contact Tech Support to discuss customization and potential fiber draws. Some of the many customization options we provide for fluoride fibers and patch cables include:
Bare Fiber
|
Patch Cables
|
Click to Enlarge
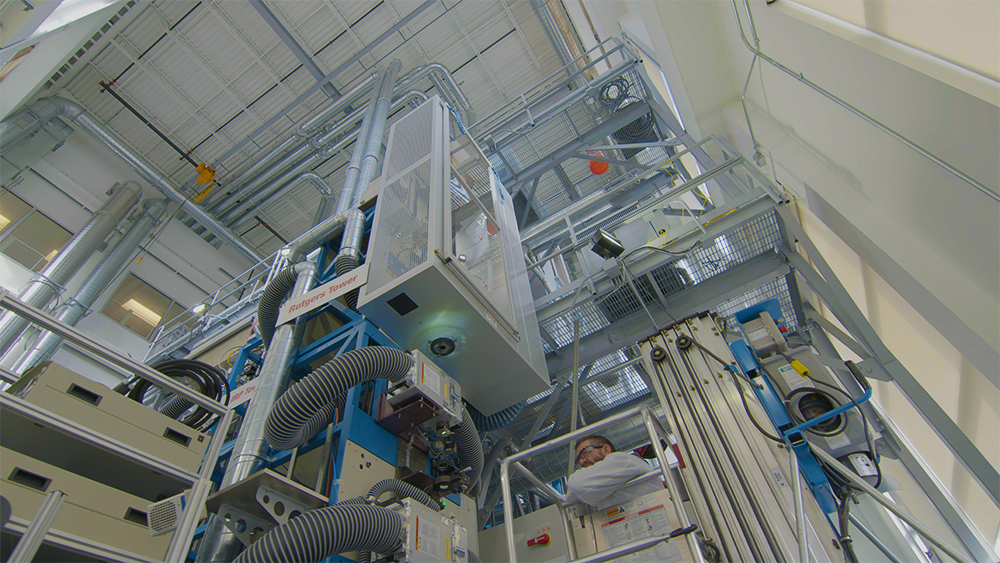
Thorlabs' Fiber Draw Tower
| Posted Comments: | |
| No Comments Posted |
| Item #a | Fiber | Operating Rangeb,c |
Attenuationb | Core Diameterb |
Cladding Diameterb |
NAb,d | Bend Radiusb (Short Term/ Long Term) |
Connectors | Jacket | Operating Temp. |
|---|---|---|---|---|---|---|---|---|---|---|
| MF11L1AR1 | InF3 Multimode | 310 nm - 5.5 µm | ≤0.25 dB/m (for 2.0 - 4.6 µm) |
100 ± 2.0 µm | 192 ± 2.5 µm | 0.26 ± 0.02 @ 2.0 µm |
≥2.5 cm / ≥5 cm | SMA905 | Blue PVDF (Ø3 mm) |
-40 to 85 °C |