 Products Home / Lab Supplies / Temperature Control and Measurement / Multichannel USB Temperature Logger
Multichannel USB Temperature Logger
- Reads Sensor Output with ±1 °C Accuracy from -10 °C to 70 °C
- Supports up to Eight Temperature Sensors
- Powered and Controlled with USB 2.0
- Ideal for OEM Applications
UPTEMP
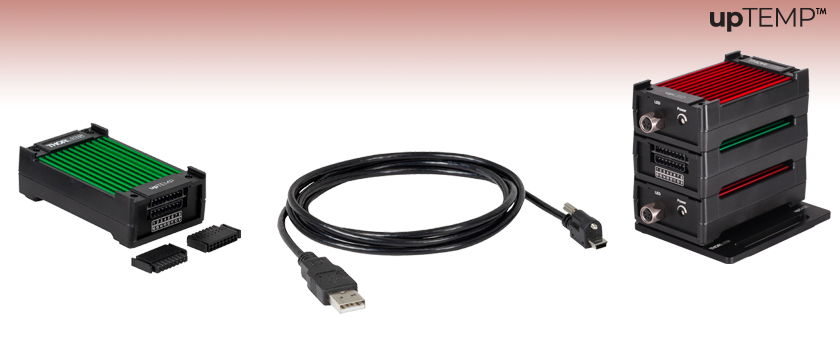
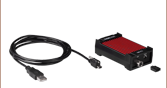
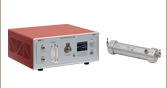
USB Temperature Logger with Two Sensor Connectors and a USB Type-A to Mini-B Cable
Application Idea
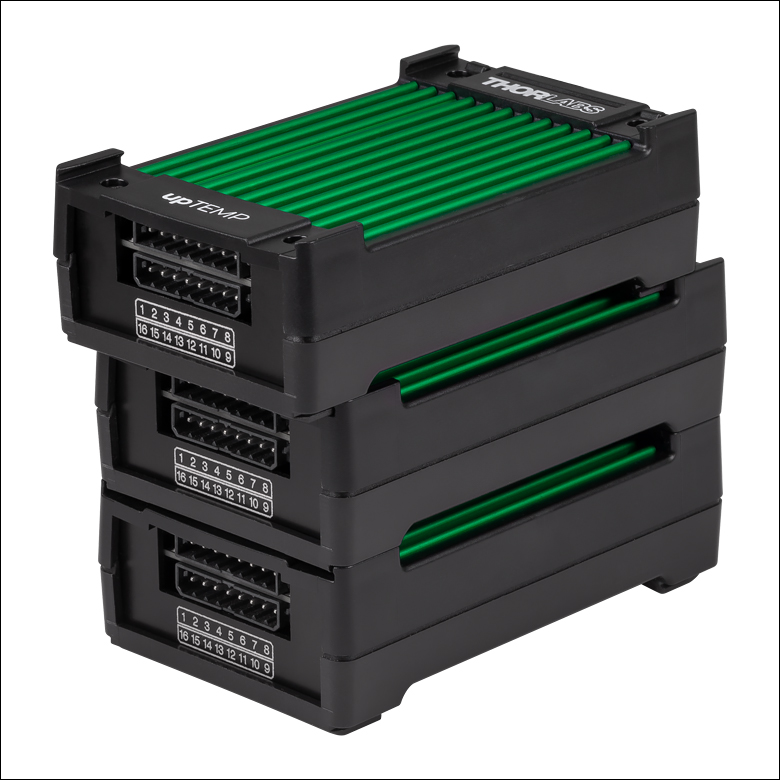
Several upSERIES® modules can be stacked together using the connection channels on the device housings. The stack can be mounted to an optical table or breadboard using the upBASE base plate.


Please Wait
Click to Enlarge
The connection channels guide the upper module onto the lower module, creating a stable stack.
Click to Enlarge
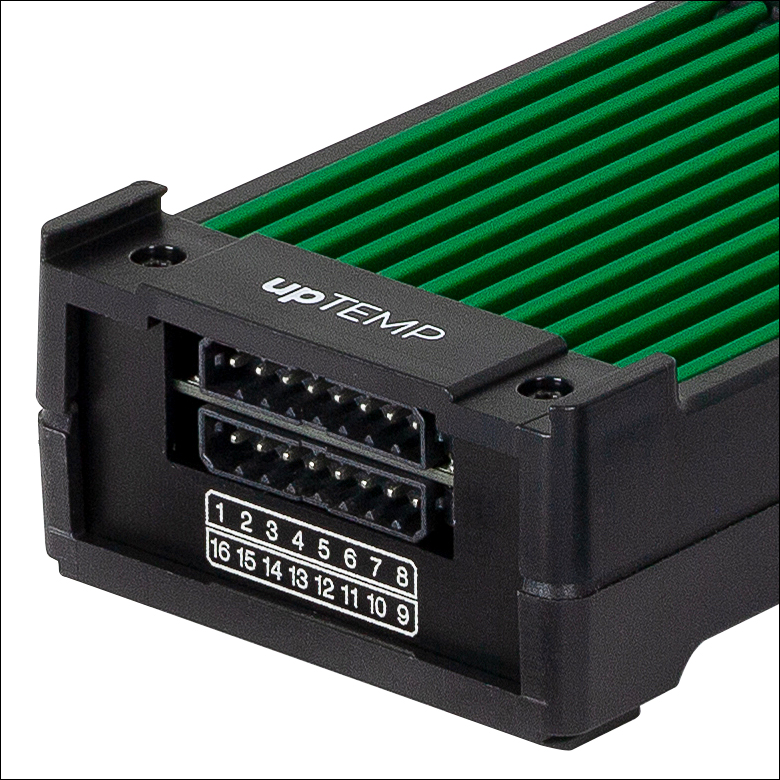
Connection channels at the corners of the upTEMP housing are included for easy stacking of modules.
Features
- Multichannel Temperature Logger with USB 2.0 Interface
- Compatible with:
- Up to Eight Negative Temperature Coefficient (NTC) Thermistors
- Up to Four Resistive Temperature Detector (RTD) Sensors
- Large Internal Memory Storage (100,000 Data Points)
- Internal Real-Time Clock for Time-Referenced Measurements
- Compact Form Factor with Stacking Capability
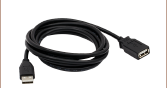
- USB 2.0 Type-A to Mini-B Cable with Locking Screw Included
- Includes upSERIES® Software
- User-Friendly Software GUI
- Drivers for LabVIEW®, CVI, C, C++, and C# Programming Environments
- Base Plate for Mounting to Optical Tables and Breadboards Available Separately (Sold Below)
Thorlabs' upTEMP™ Multichannel Temperature Logger is a compact, USB-powered device designed for monitoring and saving temperature data in both laboratory and factory environments. The upTEMP logger can read up to eight negative temperature coefficient (NTC) thermistors or four resistive temperature detector (RTD) sensors. The sensor output is read with ±0.5 °C accuracy at 25 °C and ±1 °C accuracy over the -10 °C to 70 °C temperature range1. This temperature logger, designed for use with a PC, is powered using a USB and can be controlled using the included upSERIES software.
Several modules can be used in parallel for applications that require more than the eight sensor connections provided by one device, making these an ideal option for OEM applications. To retain the compact footprint (86.7 mm x 52.5 mm) of a single unit while using multiple devices, the upTEMP housing has been designed with connection channels at the corners, which help create a stable assembly of devices. The upTEMP temperature logger can also be conveniently stacked with an upLED™ constant current, USB-controlled LED driver. The two devices feature the same stackable housing and can be simultaneously controlled using the upSERIES Software interface.
The upTEMP temperature logger, as well as a stack of upSERIES devices, can be securely mounted to an optical table or breadboard using the upBASE Base Plate (see below for details). Note that the base plate extends the footprint of the driver to 86.7 mm x 70 mm.
1These modules offer a high resolution of 10 mK. Note that the resolution is not the relative measurement accuracy, which depends on the measurement range and the sensor used.
Click to Enlarge
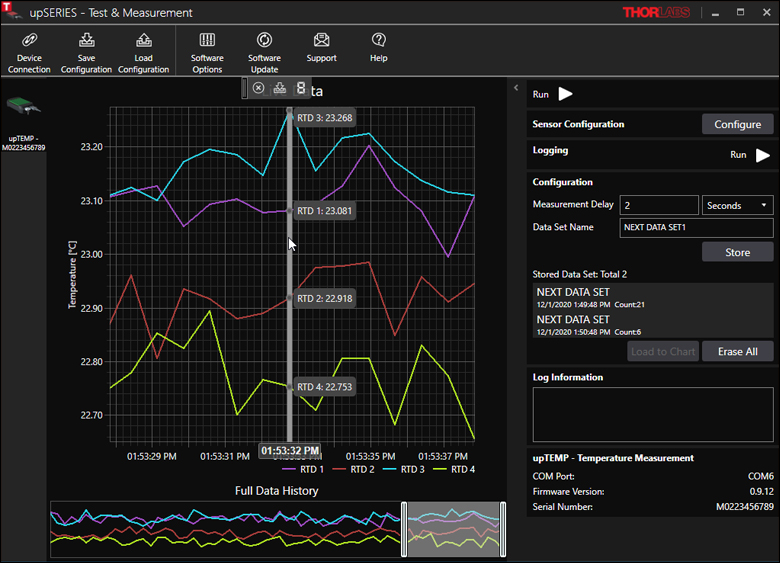
The main upSERIES software GUI displays temperature measurements from a data set, and it is possible to zoom into different regions of interest. Temperature values and time stamps for each data point can be read out.
Sensor Compatibility
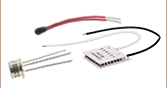
This temperature logger is compatible with either NTC thermistors or RTD sensors, such as Thorlabs' TH10K thermistor and TH100PT detector, respectively. NTC thermistors must have a resistance within 40 Ω to 900 kΩ and an operating temperature range that does not exceed -40 °C to 120 °C. RTD sensors can have two-, three, or four wires and must have a resistance within 1.95 Ω to 3450 Ω, an operating temperature range that does not exceed -200 °C to 400 °C, and be either a PT-100, PT-200, PT-500, or PT-1000 RTD sensor type. For complete sensor specifications, please see the Specs tab.
Each upTEMP module ships with two push-in spring connectors to connect the temperature sensors; additional connectors can be purchased by contacting Tech Support. Please see the Pin Diagram tab for more information on the pin assignments for each sensor type.
Back Panel Features
The upTEMP logger features a USB 2.0 Type Mini-B interface, which both powers and connects the device with a computer running the upSERIES software. A USB-ABL-60 USB 2.0 type-A to mini-B cable is included with each device and this cable features an M2.5 locking screw to prevent accidental disconnections.
A status LED indicator is included on the back panel to easily identify the operation status of the device. When the upTEMP is in measurement mode (outputting data but not saving to internal memory), the LED appears a steady green; the LED blinks yellow if the device is logging data (saving to internal memory). The LED can also appear additional colors for special states; see the device manual for more details.
A start/stop logging button is included on the upTEMP temperature logger to run measurements without the upSERIES software or a PC connection. In this case, the device must have available internal memory and power supplied via the USB port; we recommend using the Thorlabs DS5 power supply with a USB type-A port. Note that the software must be used to set the measurement configurations and to view or export the data.
PC Control
The upSERIES software monitors and saves the temperature measurements from the sensors, and it can also be used to evaluate the data. Multiple upTEMP devices can be processed by the upSERIES software, making it ideal for OEM applications that require more than eight temperature sensors. More information about the upSERIES software GUI can be found on the Software tab and the software manual.
| Item # | UPTEMP |
|---|---|
| Compatible Temperature Sensors | Negative Temperature Coefficient (NTC) Resistance Temperature Detectors (RTD) |
| Measurement Rate (Sum of All Channels) | 5 Samples per Second (Max) |
| Built-In Non-Volatile Flash Memory | 128 MBit |
| Maximum Data Points (Sum of All Channels) | 100,000 Data Points |
| Sensor Interface | |
| Connector Type | Push-In Spring Connectors |
| General Specifications | |
| Control Interface | Lockable Mini USB Connector |
| USB Protocol | USB 2.0 (USB CDC Class Device) |
| Maximum USB Cable Length | 5.0 m |
| Power Supply | 5 V; 200 mA via USB (Max) |
| DC Input | USB-ABL-60 USB Cable (Provided) |
| Operating Temperature Rangea | -20 °C to 70 °C |
| Storage Temperature Range | -40 °C to 70 °C |
| Dimensions (W x H x D) | 86.7 mm x 27.0 mm x 52.5 mm (3.41" x 1.06" x 2.07") |
| Weight | 70 g |
| Specifications with NTC Thermistors | |
|---|---|
| Sensor Channel Count | 8 (Max) |
| Sensor Resistance Range | 40 Ω to 900 kΩ |
| Sensor Temperature Rangea (Additional Sensor Limits Can Apply) |
-40 °C to 120 °C |
| Excitation Current for NTC Types | 250 nA, 500 nA, 1 µA, 5 µA, 10 µA, 25 µA, 50 µA, 100 µA |
| Accuracy at 25 °C | ±0.5 °C + Sensor Accuracy |
| Accuracy from -10 °C to 70 °C | ±1 °C + Sensor Accuracy |
| Resolutionb | 10 mK |
| Specifications with RTD Sensors | |
| Sensor Channel Count | 4 (Max) |
| Sensor Resistance Range | 1.95 Ω to 3450 Ω |
| Sensor Temperature Rangea (Additional Sensor Limits Can Apply) |
-200 °C to 400 °C |
| Supported RTD Sensors | RTD PT-100, RTD PT-200, RTD PT-500, RTD PT-1000 |
| Excitation Current for RTD Types | 100 µA |
| Calibration Curves | European Standard, American, Japanese, IST-90 |
| Accuracy at 25 °C | ±0.5 °C + Sensor Accuracy |
| Accuracy from -10 °C to 70 °C | ±1 °C + Sensor Accuracy |
| Resolutionb | 10 mK |
Front Panel
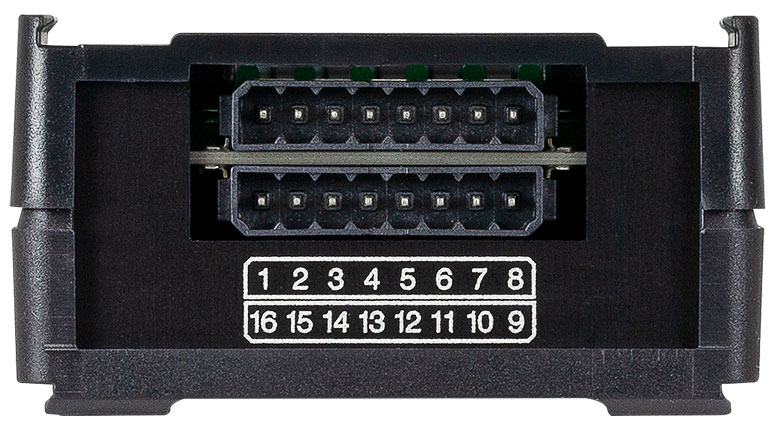
Thorlabs' upTEMP™ USB temperature logger features sixteen pins, which can connect up to eight negative thermal coefficient (NTC) thermistors or four resistive temperature detector (RTD) sensors using the two included sensor connectors. RTDs with two-, three-, and four-wire configurations can be used. Shown below are the pin assignments for connecting NTCs (left) or RTDs (right).
Note: In the case that a two-wire RTD is used, connections should be made to the two inner pins. See the upTEMP manual for more details.
| Pin | NTC Description | RTD Descriptiona | Pin | NTC Description | RTD Descriptiona |
|---|---|---|---|---|---|
| 1 | NTC1 | RTD_1F | 9 | NTC5 | RTD_3F |
| 2 | NTC1 | RTD_1S | 10 | NTC5 | RTD_3S |
| 3 | NTC2 | RTD_1S | 11 | NTC6 | RTD_3S |
| 4 | NTC2 | RTD_1F | 12 | NTC6 | RTD_3F |
| 5 | NTC3 | RTD_2F | 13 | NTC7 | RTD_4F |
| 6 | NTC3 | RTD_2S | 14 | NTC7 | RTD_4S |
| 7 | NTC4 | RTD_2S | 15 | NTC8 | RTD_4S |
| 8 | NTC4 | RTD_2F | 16 | NTC8 | RTD_4F |
Back Panel
| upTEMP™ USB Temperature Logger Back Panel | |
|---|---|
| Callout | Description |
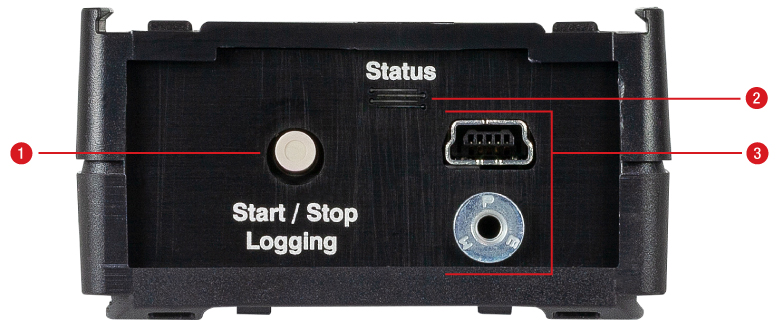
| 1 | Start / Stop Button for Data Logging |
| 2 | Status LED |
| 3 | Lockable USB 2.0 Type Mini-B Connector with Threading for M2.5 Locking Screw |
Click to Enlarge
upTEMP Temperature Logger Back Panel Features
| Recommended System Requirements | |
|---|---|
| Operating System | Windows® 8.1 (64 Bit), Windows® 10 (64 Bit, Recommended) |
| Processor (CPU) | 1 GHz |
| Memory (RAM) | 512 MB |
| Hard Drive | 200 MB (Min) of Available Disk Space |
| Graphics Card Resolution |
1280 x 768 (Min) |
| Interface | Free USB 2.0 Port |
Software
Version 1.4
The upSERIES software includes a GUI for control of Thorlabs' upTEMP USB Temperature Data Logger and upLED LED Driver. To download, click the button below.

upSERIES® Software
The upSERIES Software is designed for straight forward use with the upTEMP™ Multichannel USB Temperature Logger and the constant current upLED™ LED Driver. The upSERIES Software can be used with several upTEMP and upLED models in parallel, allowing for complex setups.
Instrument drivers for LabVIEW®, CVI, C, C++, and C# are installed with the software for user-defined applications; refer to the manual for details.
Contents
upTEMP™ USB Temperature Data Logger
With the upSERIES software package, the temperature measurements detected by negative temperature coefficient (NTC) thermistors or resistive temperature detector (RTD) sensors can be monitored, saved, and evaluated using the intuitive, easy-to-use graphical interface. Ideal for complex systems, this software can be used to measure signals from multiple upTEMP modules, and each module can handle up to eight NTC thermistors or four RTD sensors. Data can be saved to the internal memory of the upTEMP device or to the PC.
The GUI features a configuration section, which allows the user to edit measurement parameters, including sensor type, temperature offset, and measurement delay. For real-time temperature monitoring, there is an option to display temperature measurements graphically in a time trace. Data analysis options, such as displaying single temperature values, are also included. Data saved to the PC will be saved as a .csv file with the following information: time and date; sensor type and number (according to list in the software); temperature scale; and calculated and displayed temperature values.
Click to Enlarge
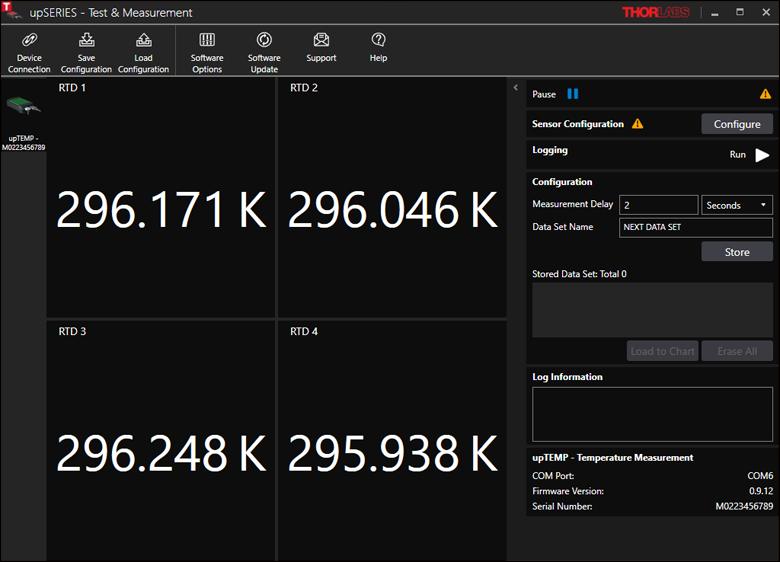
The upSERIES software automatically recognizes a connected upTEMP temperature logger. The connected upTEMP device is listed in the left panel and configuration options are on the right. The center panel shows the temperature readings for each connected temperature sensor.
Click to Enlarge
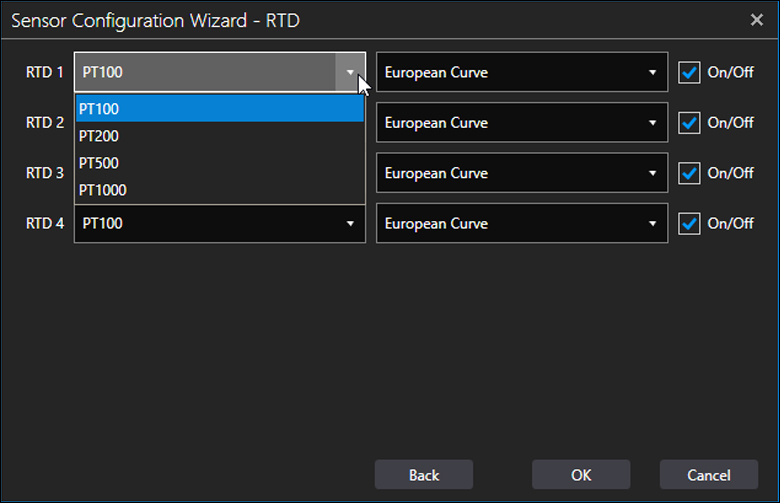
The category, which is based on the resistance at 0 °C (labelled as PTxxx), and the calibration curve can be set for connected RTD sensors.

Click to Enlarge
For connected NTC thermistors, the temperature coefficents and operating temperature ranges can be set. The Thermistor Model Manager also allows new NTC thermistors to be added, and they can be configured using the Steinhart-Hart equation or beta function.
Click to Enlarge
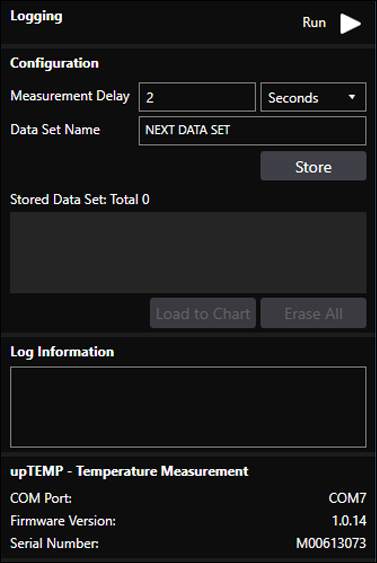
Measurement parameters can be configured in the right panel of the main GUI screen. Measurement delay, which is the update rate of the measured data on the screen, can be set, as well as the data set name. Also, options for saving the data can be set in this panel.
Click to Enlarge
The live data can be displayed in the main GUI window. Also available are basic data analysis tools, including the capability to zoom into data sets and read the temperature for single data points. Time references for each data point can also be read out.
upLED™ Constant Current USB LED Driver
When using the upSERIES Software with the constant current upLED™ LED Driver, the forward current can be precisely set and saved for later applications. Additionally, software configurations allow the use of LEDs without Thorlabs EEPROMs, as well as automatic power-up options. This software can be used to drive multiple upLED modules and each upLED can drive a single LED.
Click to Enlarge
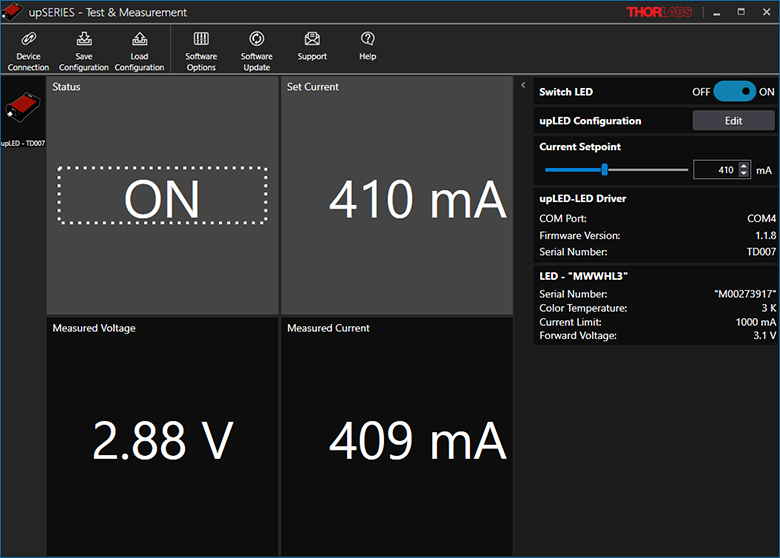
The upSERIES software automatically recognizes a connected upLED LED driver, provided an LED and power supply are already connected. The connected upLED is listed on the left panel, while the right panel shows configuration options. The LED status and current set point are shown in the center panel, as well as the measured voltage and current as reported by the upLED.
Click to Enlarge
Additional information about each setting can be found by clicking on the blue icon next to the setting. The upLED can be set up for more hands-off operation; LEDs can automatically power on after connection to a power supply (see center image) or repower after being disconnected and reconnected. If an LED is disconnected during operation, the internal memory of the upLED will immediately resupply the next-connected LED with the last set of parameters.

Click to Enlarge
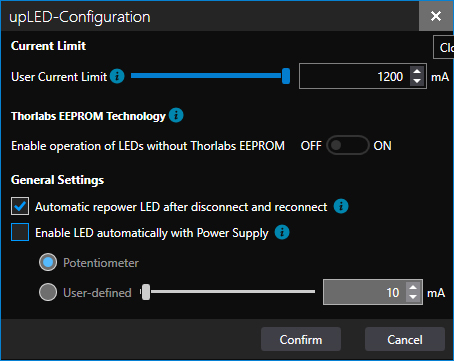
The configuration window allows the user to customize the upLED driver settings. Ideal for Thorlabs LEDs, the current limit is automatically set by the LED EEPROM. To use non-Thorlabs LEDs, toggle the switch under Thorlabs EEPROM Technology and set the current limit. The current source can be set as either the potentiometer or user-defined.
| Posted Comments: | |
Alastair Curnock
(posted 2023-10-04 15:17:34.06) Could you consider adding the option for the upTEMP software to display the input values in sensor units (ie Ohms) as well as the temperature units currently offered.
Also, do you offer a calibration service for these instruments
Thanks hkarpenko
(posted 2023-10-09 09:08:23.0) Dear Alastair,
thank you for your kind feedback.
We will consider to implement the resistance units in Ohm aswell during our next software revision. Regarding the calibration I will contact you directly to discuss this further with you. Dave Langstaff
(posted 2023-06-26 16:03:32.55) Hi,
I have some of your upTemp devices. I ave installed the upSeries software and the accompanying labview drivers.
I can communicate with the devices using the upSeries software, but am having problems connecting using Labview.
I am using Labview 2023Q1 (64 bit)
The TLUP Initialize.vi instrument, when called always reports error 0xBFFC0011 (Identification Query Failed), even if the "Id Query" toggle is set to "No".
In addition it does not seem possible to collect temperaures from the device using Labview.
Have you an updated library beyond the one I am using? (up_Series_Installer_1.2)
regards
dave Langstaff GBoedecker
(posted 2023-06-27 08:01:45.0) Dear Dave, thank you for your feedback! I contacted you directly for troubleshooting. user
(posted 2023-06-13 12:45:04.94) no Labview example for UpLED. just library GBoedecker
(posted 2023-06-21 12:02:22.0) Thank you for your feedback! Please apologize the missing example. We will upload it as soon as possible. Young Ho Park
(posted 2023-03-21 19:30:39.617) Hi, I'v been struggling with LabVIEW code getting temperature values from UPTEMP logger.
I'd like you to supply a simple LabVIEW example code that can read temperature from a thermister in channel 1.
Although the operation manual says that a LabVIEW example code is packed in the container file (TLUP.LLB) together with the driver VIs, I couldn't find any example code in it. I am using LabVIEW 2015 version. Thank you in advance. mdiekmann
(posted 2023-03-21 10:40:57.0) Thank you for contacting us. We have reached out to you by email to provide a LabView example. Meanwhile, our software team is working on adding the example to the software installation to align with the description in the manual. We expect a software update including the example to be available within the next few days. Kevin Xie
(posted 2021-07-05 16:43:17.197) Hello, I am using this temperature logger to monitor the temperatures in chiller lines. Therefore, I would like to have the ability to output warnings if a thermistor's temperature reads too high. The upSERIES software doesn't seem to have this feature so I would like to interface with the logger directly using a Raspberry Pi and build my own monitoring software. Is there an SDK or something like that available for this device?
Thank you. MKiess
(posted 2021-07-08 08:45:19.0) Dear Kevin, thank you very much for your inquiry. The suggestion to implement such a warning in the software is very good and is still missing in the software. We will implement it in our next software version. So thank you very much for this feedback. Drivers, an overview of the functions and programming examples are included in the software download. I have contacted you directly to discuss further details. |

 Zoom
Zoom| Key Specsa | |
|---|---|
| Compatible Temperature Sensors |
Negative Temperature Coefficient (NTC) Resistance Temperature Detectors (RTD) |
| Sensor Channel Count | NTC: 8 (Max) RTD: 4 (Max) |
| Measurement Rate (Sum of All Channels) |
5 Samples per Second (Max) |
| Built-In Non-Volatile Flash Memory |
128 MBit |
| Maximum Data Points (Sum of All Channels) |
100,000 Data Points |
- USB-Controlled Multichannel Temperature Logger
- Compatible with:
- Up to Eight Negative Temperature Coefficient (NTC) Thermistors
- Up to Four Resistive Temperature Detector (RTD) Sensors
- USB-ABL-60 USB 2.0 Type-A to Mini-B Cable with M2.5 Locking Screw Included
- Includes upSERIES® Software
Thorlabs' upTEMP™ Multichannel Temperature Logger is a compact, USB-powered device that can read up to eight negative temperature coefficient (NTC) thermistors or four resistive temperature detector (RTD) sensors. The sensor output is read with ±0.5 °C accuracy at 25 °C and ±1 °C accuracy over the -10 °C to 70 °C temperature range1. This temperature logger is powered using a USB and controlled using the included upSERIES software.
For applications that require more than the eight sensor connections provided by one device, several modules can be used in parallel. When using several upTEMP temperature loggers, the devices can be stacked using the connection channels at the corners. This creates a stable assembly that retains the compact footprint of a single device (86.7 mm x 52.5 mm). For secure mounting to an optical table or breadboard, we recommend using the upBASE base plate sold below.
1These modules offer a high resolution of 10 mK. Note that the resolution is not the relative measurement accuracy, which depends on the measurement range and the sensor used.

 Zoom
Zoom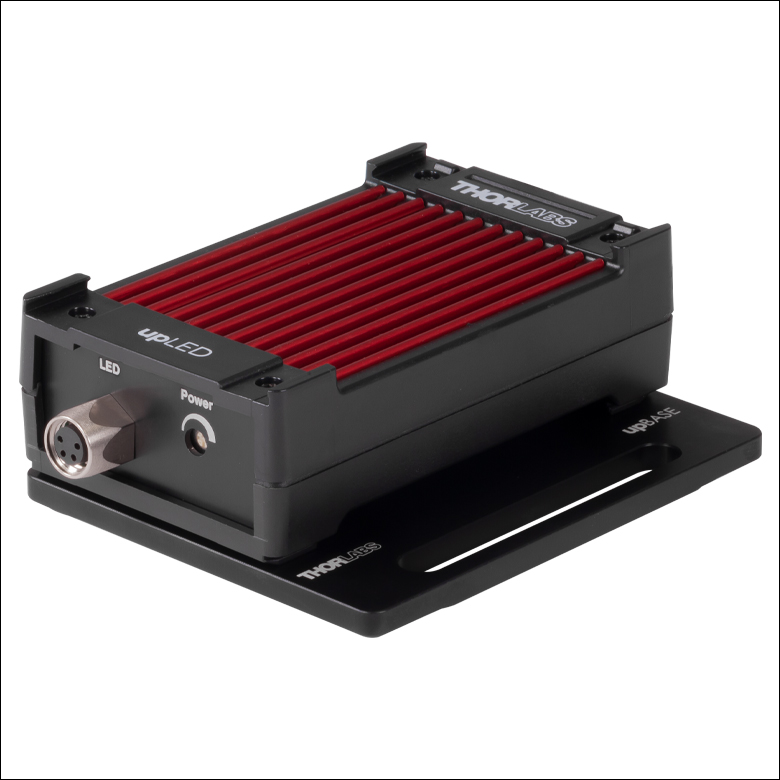
Click to Enlarge
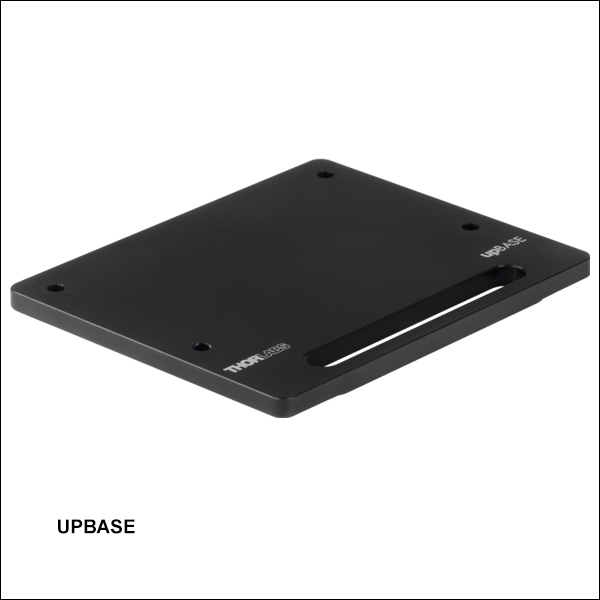
An upLED module mounted onto the upBASE base plate.
- Four M3 Countersunk Holes for Mounting to an upSERIES® Device
- Mounts to an Optical Table or Breadboard via a Slot for 1/4" (M6) Cap Screws
- Four M3 x 0.5 Countersunk Screws (2 mm Hex) are Included
The upBASE Base Plate securely mounts an upSERIES module to an optical table or breadboard. A slotted hole for 1/4" and M6 cap screws provides compatibility with both imperial and metric hole patterns. The bottom of the upSERIES module is connected to the base plate using the four included M3 x 0.5 countersunk screws. Fabricated from black anodized aluminum, the bottom of this base has three contact pads for stable mounting; one contact pad is located around the slotted hole and the other two are around the countersunk holes at the opposite end of the plate.
The upBASE base plate increases the footprint of an upSERIES device to 86.7 mm x 70.0 mm (3.41" x 2.76").