 Products Home
2-Color Combiners
- Combine Two Input Wavelengths into a Single Output
- Excellent for Confocal, Raman, or Laser Scanning Microscopy and Multi-Color Fluorescence Imaging
- FC/PC or FC/APC Leads
GB11A1
488 nm / 532 nm (Blue/Green)
Combiner with FC/APC Connectors
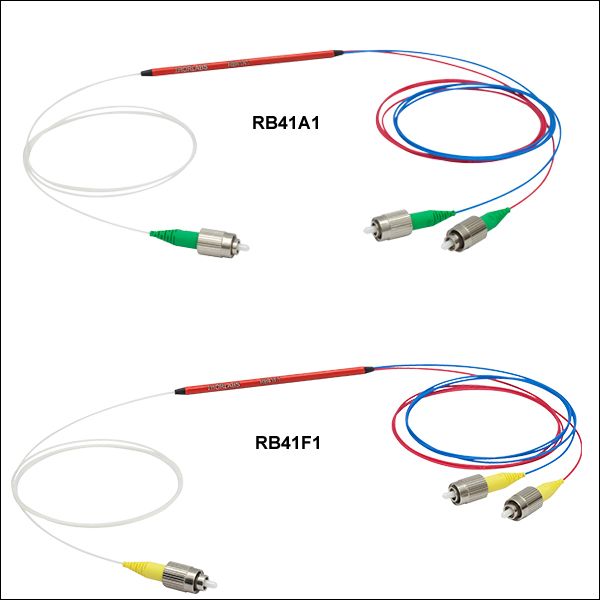
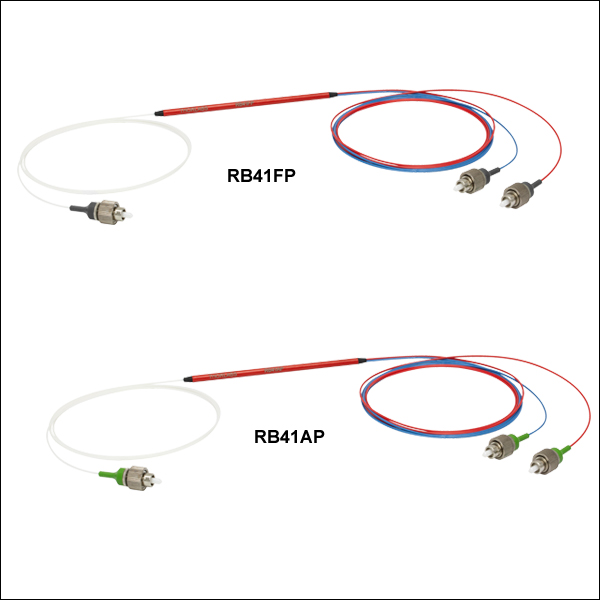
RB41FP
488 nm / 640 nm (Blue/Red)
PM Combiner with FC/PC Connectors
Use with Microscopy Systems to Create Two-Color Fluorescence Images


Please Wait
| Quick Links | |
|---|---|
| Blue/Green | 473 nm / 532 nm |
| 473 nm / 561 nm | |
| 488 nm / 532 nm | |
| 488 nm / 561 nm | |
| Blue/Red | 473 nm / 633 nm |
| 473 nm / 640 nm | |
| 473 nm / 670 nm | |
| 488 nm / 633 nm | |
| 488 nm / 640 nm | |
| 488 nm / 640 nm Polarization Maintaining |
|
| 488 nm / 670 nm | |
| Green/Red | 532 nm / 640 nm |
| 532 nm / 670 nm | |
| 561 nm / 640 nm | |
| 561 nm / 670 nm | |
| Green/NIR | 532 nm / 785 nm |
| 561 nm / 785 nm | |
| Red/NIR | 633 nm / 785 nm |
| 640 nm / 785 nm | |
| 670 nm / 785 nm | |
Click for Details
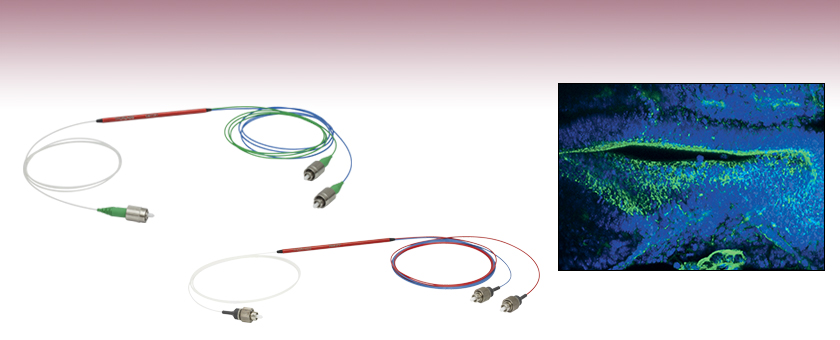
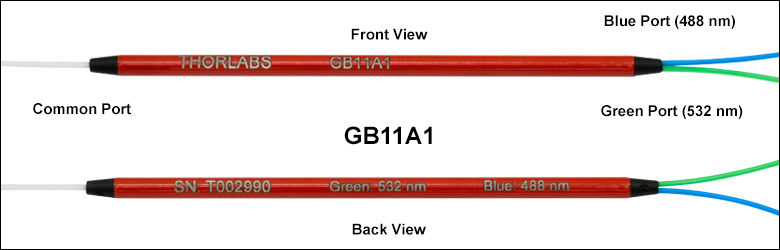
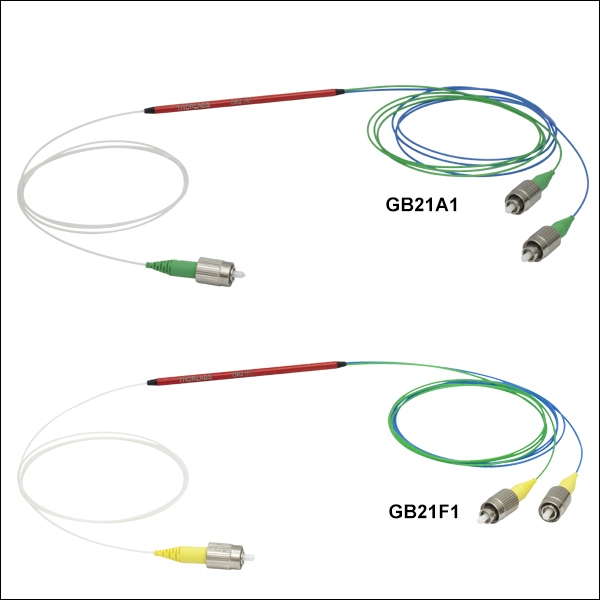
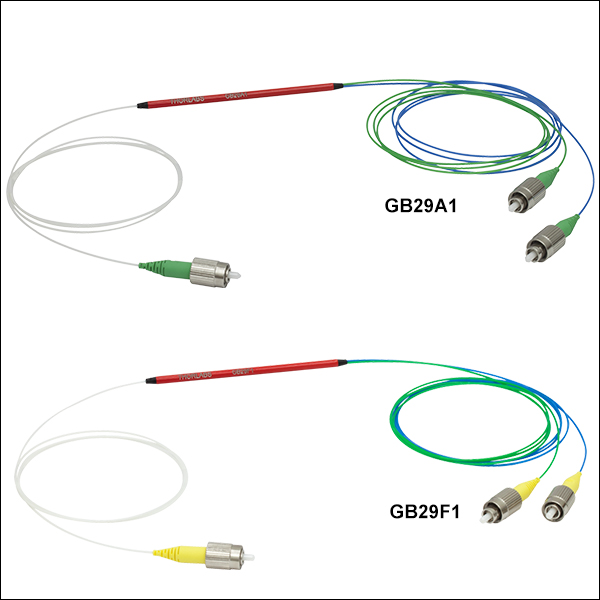
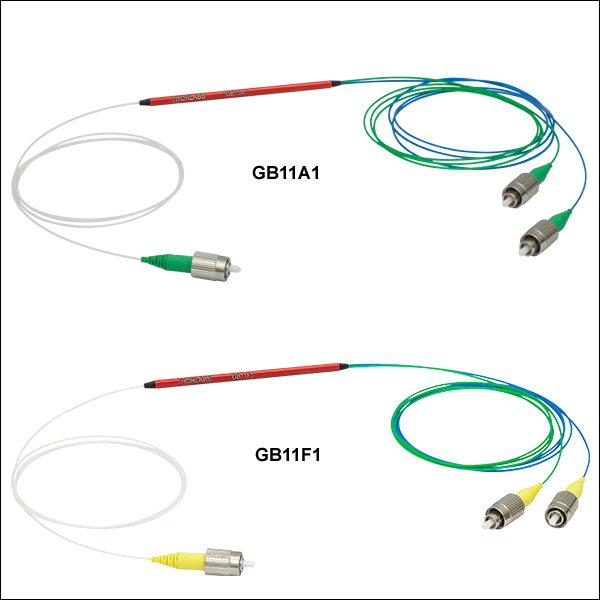
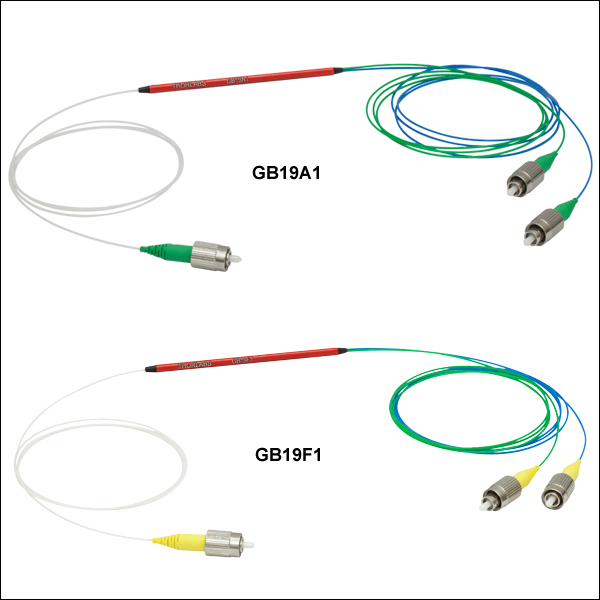
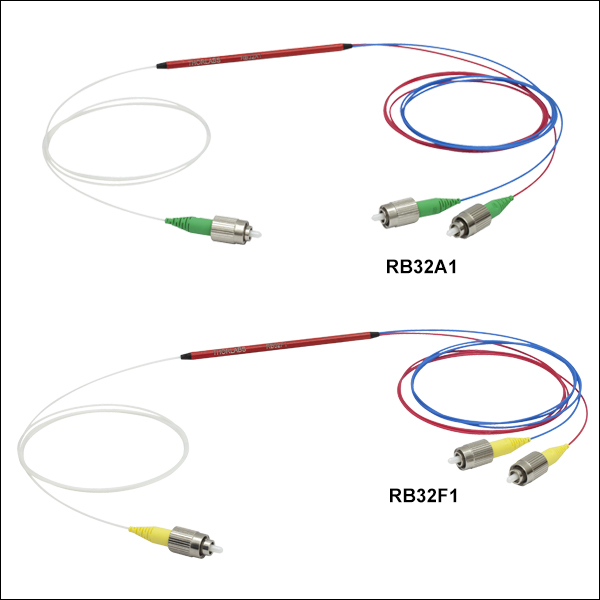
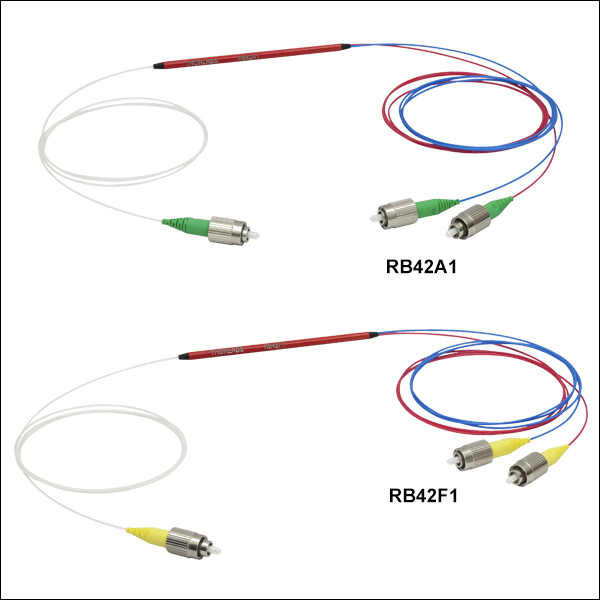
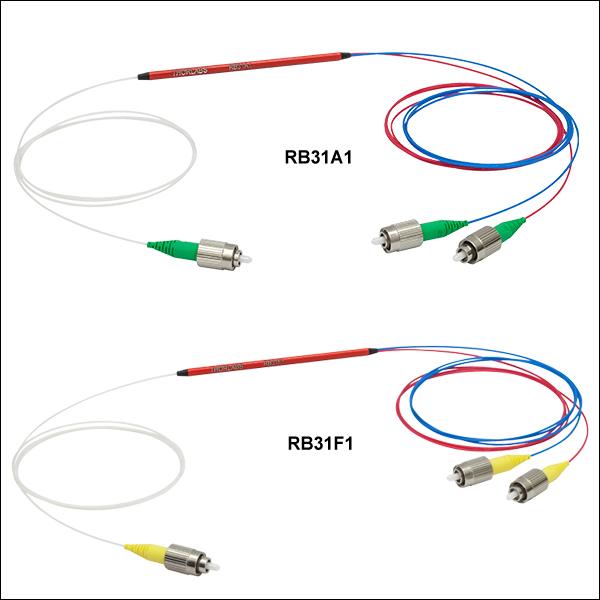
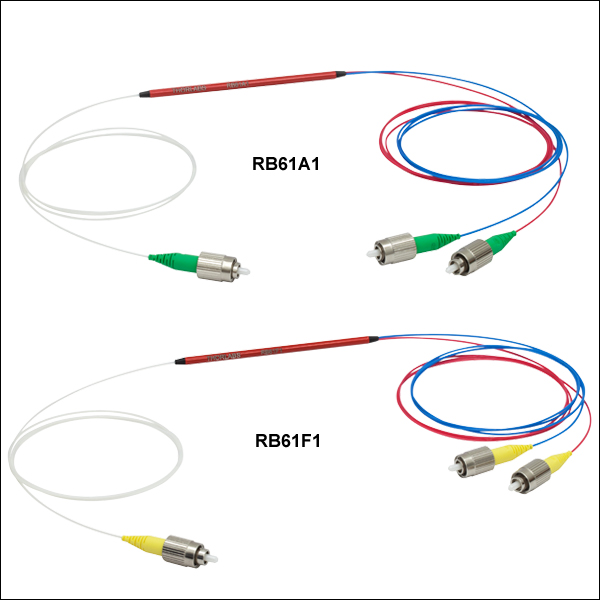
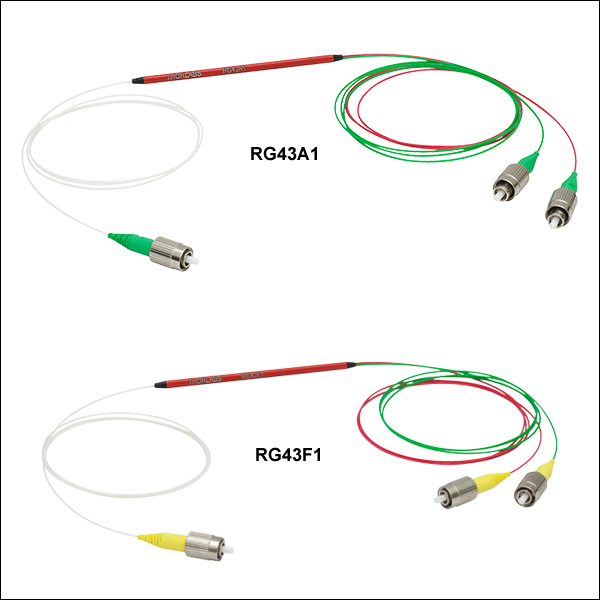
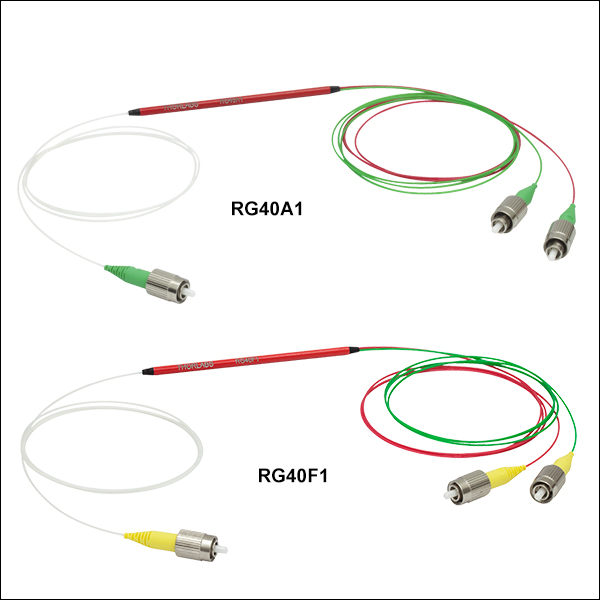
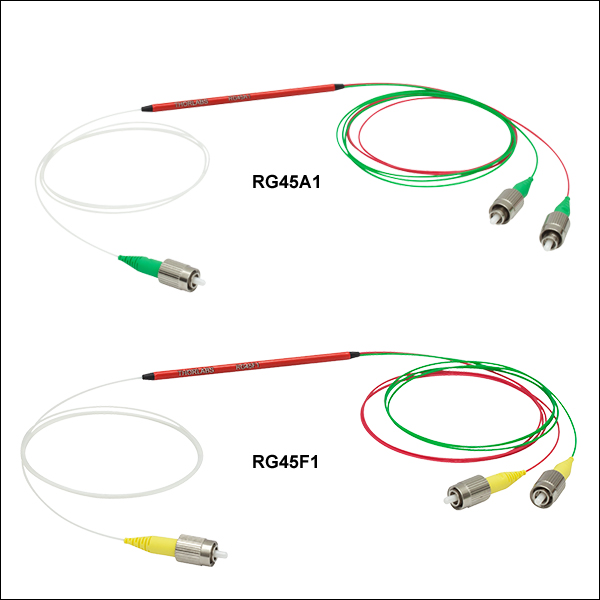
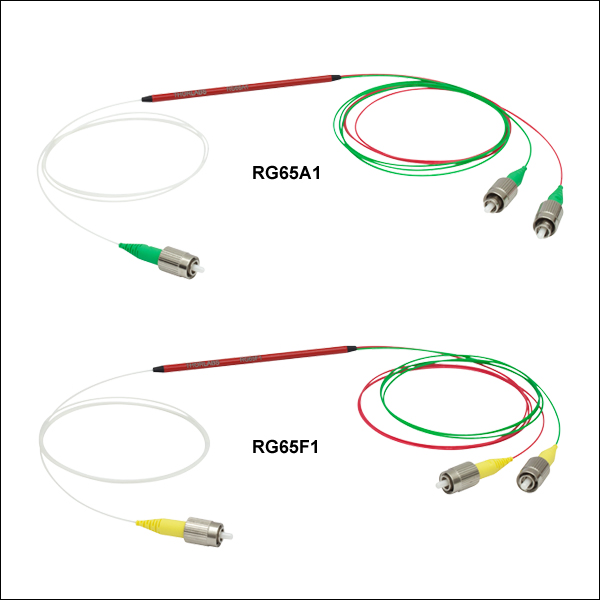
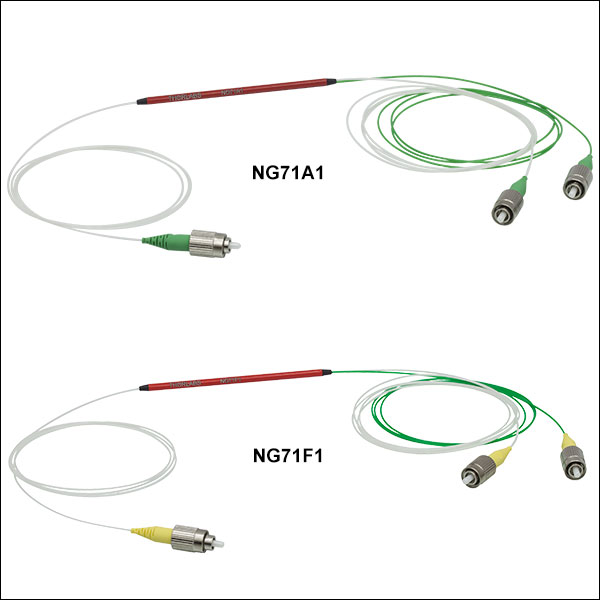
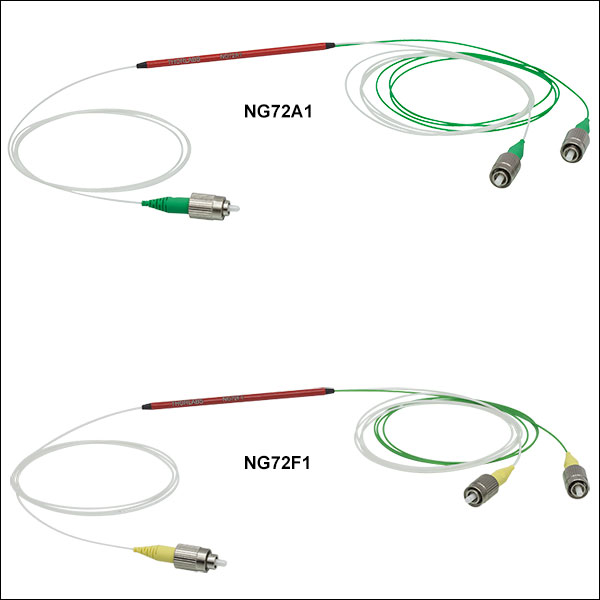
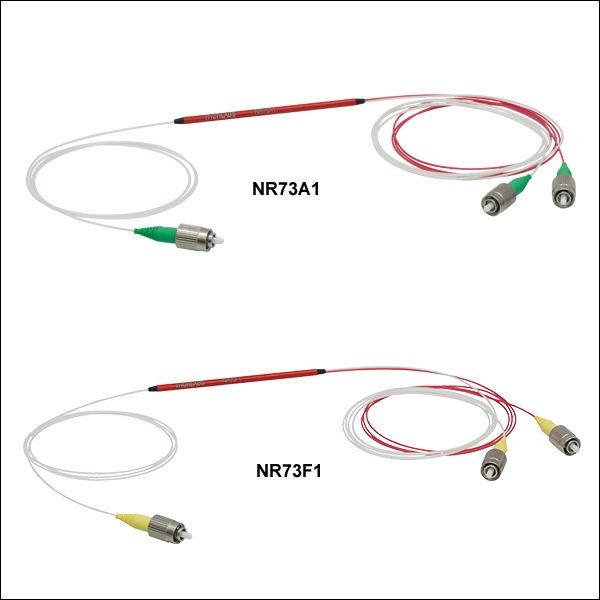
The fiber leads have color-coded jackets. The common port is located on the single fiber side and has a white jacket. Wavelength combiner housings are engraved with an Item # and the port wavelengths.
Features
- Combine Two Colors/Wavelengths into a Single Fiber Output
- Reversible: Can Also be Used to Split 2 Input Colors
- Designed for Laser Lines Commonly Used in Confocal, Laser Scanning, Fluorescence, or Raman Microscopy
- Choose from 20 Combinations (See Table to the Right for Options)
- SM and PM Fiber Options Available
- Color-Coded Inputs for Easy Identification
- Available with 2.0 mm Narrow Key FC/PC or FC/APC Connectors
- Contact Us for Custom Wavelength Combinations, Fiber Lengths, and/or Connectors
- Combiners are Shipped with an Item-Specific Data Sheet (See Below for Samples)
Thorlabs' 2-Color Fused Fiber Combiners, also known as wavelength division multiplexers (WDMs), consist of two separate input fibers that each accept a different wavelength of light and a single, common output fiber accepting both input wavelengths. Designed for laser lines commonly used in life science applications, these 2-color combiners are ideal for dual-color fluorescence imaging using confocal microscopy or laser scanning microscopy setups. Thorlabs also offers 2-color combiners with a 785 nm channel that are designed for near-IR applications such as Raman microscopy. Also available is a WDM containing polarization maintaining fiber. In total, 20 different combinations of combiners are available; please refer to the table to the right for a list of available combinations. Because 2-color combiners are reversible, they can also be used to split two colors entering the common port into two separate output ports.
The fused fiber region of the combiner is packaged within a compact Ø0.12" x 2.95" (Ø3.2 mm x 75.0 mm) tube that is engraved with the operating wavelengths and Item # (see the image above). The Ø900 µm loose Hytrel®* tube on each 0.8 m long fiber leg is color coded; the common port is located on the single fiber side and has a white jacket. These combiners are offered from stock with 2.0 mm narrow key FC/PC or FC/APC connectors. For applications sensitive to connector losses, we recommend splicing the fiber combiners into a setup because FC/PC and FC/APC connectors may not ideally align the small cores of these single mode fibers. Other fiber types and select wavelength combinations are available upon request. If a custom connector configuration is needed, one-day turnaround is possible for small orders if the order is placed before 12 PM EST. Please contact Technical Support with inquiries.
The 2-color combiners are tested during the manufacturing process to ensure that they meet specifications within their specified operating range. The graphs below (provided for each color combination) show the typical insertion loss and transmission in each channel as a function of wavelength. Light at the operating wavelength of a channel will have an insertion loss close to zero, indicating high transmission of the desired signal, while light at the operating wavelength of the other channel will have higher insertion loss, indicating lower transmission of that signal. By suppressing the other channel's signals by at least 13 dB for the SM combiners and 17 dB for the PM combiners, they provide good isolation, minimizing crosstalk between the two channels. A detailed test report is included with each combiner; sample data sheets for each wavelength combination can be viewed below. Our couplers have undergone extensive testing to ensure they meet or surpass Telcordia requirements; please see the Reliability Testing tab for details.
For combining three colors into a single fiber output, please see our line of RGB combiners.
*Hytrel® is a registered trademark of DuPont Polymers, Inc.
Wavelength Division Multiplexer Design
Thorlabs' Wavelength Division Multiplexers (WDMs) are designed to combine or split light at two different wavelengths. Thorlabs offers a variety of multiplexers with wavelength combinations spanning the visible, near-IR, and IR regions of the spectrum. Our visible wavelength division multiplexers are also known as "wavelength combiners" as they are commonly used in microscopy applications to generate multi-color composite images.
The animation to the right illustrates the basic operating principles of a 1x2 WDM. When combining light, the wavelength-specific ports will transmit light within a specified bandwidth region and combine them into a multi-wavelength signal output at the common port, with minimal loss in signal.
Except where indicated, our WDMs are bidirectional; they can also split a two-wavelength signal that is inserted into the common port into the component wavelengths. For optimal combining/splitting performance, the input signal(s) should contain only the wavelengths specified for the WDM. An insertion loss graph can help estimate the transmission and coupling performance within and outside the specified bandwidth. For our WDMs which have a red, engraved housing, this data is included with the item-specific datasheet that ships with each coupler.
Click to Enlarge
The shaded regions in the plot indicate the bandwidth where each port meets the specified performance.
Insertion Loss and Isolation
WDM performance is typically quantified using insertion loss. As seen in the definition below, insertion loss (measured in dB) is the ratio of the input power to the output power from each leg of the WDM. For optical systems, the definition of insertion loss is given as:
where Pin and Pout are the input and output powers (in mW).
Each port of the coupler is designed to have low insertion loss (i.e., high transmission) at the desired wavelength while suppressing the signal at the specified wavelength of the other port, which minimizes cross talk between the ports. Therefore, isolation is specified as the insertion loss of these undesired wavelengths. High dB values of isolation are ideal for signal separation applications using a WDM. For example, in the graph shown to the right, the long wavelength port (shown using a red dashed line) has a low insertion loss around 640 nm (indicated by the red shaded region), but exhibits high isolation (>25 dB) in the region specified for the short wavelength port (indicated by the light blue shaded region).
Wavelength Division Multiplexer Manufacturing Process
This section details the steps used in manufacturing and verifying the performance of our wavelength division multiplexers.
Click to Enlarge
In the diagram, the fibers are color-coded; blue for the short wavelength port and red for the long wavelength port.
Step 1
At the first stage, two fibers are fused on a manufacturing station so that the two fiber cores are in close proximity. This allows light to propagate between the two fiber cores over the fused region in a process known as evanescent coupling. The fusing process is stopped once the desired insertion loss and isolation specifications are achieved.
The output from the short wavelength port is monitored during the fusing process using a broadband source on one side and an optical spectrum analyzer (OSA) on the other. The insertion loss as a function of wavelength is calculated from the spectrum obtained from the OSA.
Click to Enlarge
In the diagram, the fibers are color-coded; blue for the short wavelength port and red for the long wavelength port.
Step 2
To verify the WDM performance, the output is measured in the long wavelength port using a broadband source and OSA. By combining the plots obtained in steps 1 and 2, the insertion loss and isolation in each channel can be calculated.
| Requirement Limits | |
|---|---|
| Parameter | Limit |
| Change in Insertion Loss (ΔIL) | ≤0.2 dB |
| Isolation | ≥30 dB |
GR-1221-CORE Testing
Our Single Mode Wavelength Division Multiplexers (WDMs) have undergone extensive testing to ensure they meet or surpass Telcordia requirements outlined in the regulation titled Generic Reliability Assurance Requirements for Passive Optical Components, Issue 2 (GR-1221-CORE). The results of this testing program qualify the WDMs and their manufacturing process for volume production. The selected test conditions are for uncontrolled environments and are considered to be some of the most stringent test conditions for passive components. To download a PDF of this test report, please click here.
 Click To Enlarge
Close-Up of Mechanical Shock Test Setup
 Click To Enlarge
SM-105 Mechanical Shock
Test Machine
Click To Enlarge
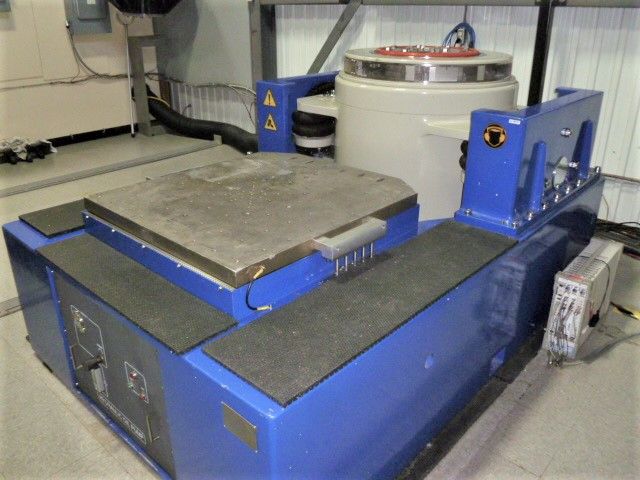
Vibration Test Setup
 Click To Enlarge
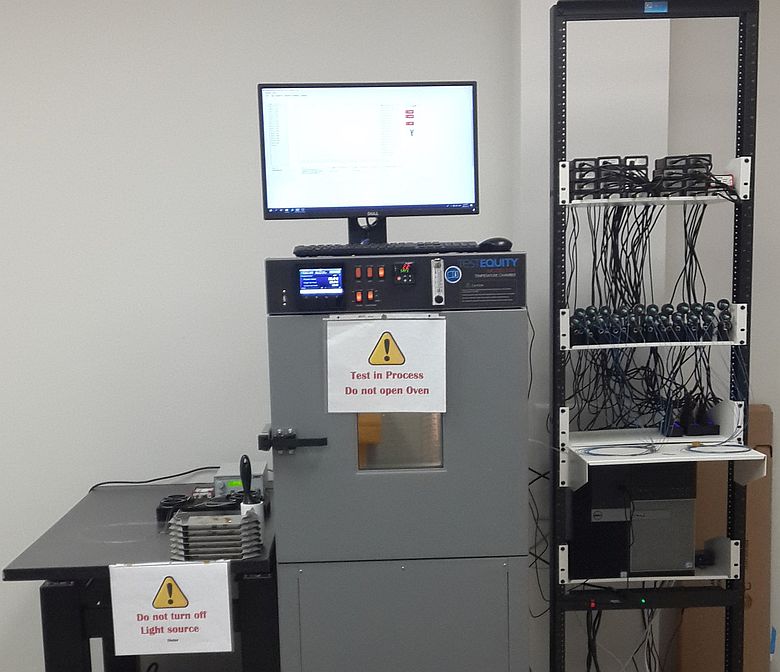
Damp Heat Testing Setup
Testing Conditions
This test program consisted of five test groups with a sample size of 11 per group. Testing was conducted with a 1310 nm laser source input into 980/1310 WDMs using a 1x16 waveguide coupler. The two outputs of every WDM were measured by a PM100USB power meter with an S154C sensor head.| Testing Conditions | ||
|---|---|---|
| Mechanical Testing (Group 1) | ||
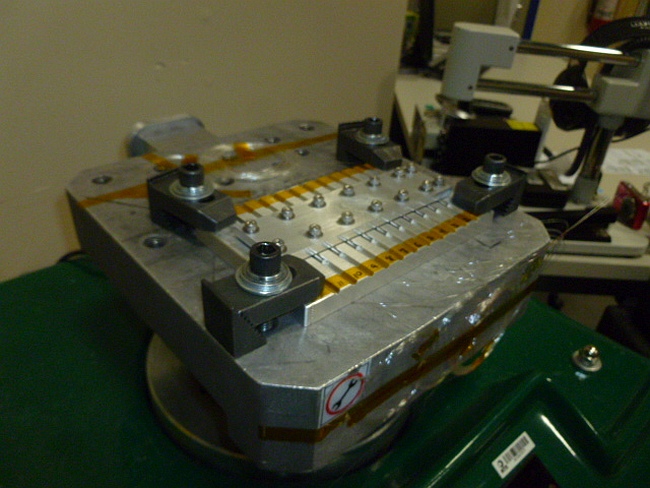
| These WDMs underwent three mechanical tests; the mechanical shock and vibration tests were conducted by the NTS Environmental and Mechanical Testing Laboratory while the fiber side pull tests were performed in-house. In one test, the WDMs were induced with mechanical shock using an Avex SM-105 mechanical shock test machine with a 3200B4 accelerometer. In another, they were induced with vibration using a Dynamic Solutions DS-2200VH/8-19 vibration system with a VT1436 vibration controller and a 356A01 accelerometer. The WDMs also underwent a fiber side pull in two directions with a weight of 0.23 kg at 90° for 5 seconds. | ||
| Test Parameter | Conditions | Reference |
| Mechanical Shock | Acceleration: 500 g Pulse Width: 1 ms Pulse Shape: Half-Sine # of Directions: 6 # of Shocks/Direction: 5 |
MIL-STD-993 Method 2002 |
| Vibration | Acceleration: 20 g Frequency Range: 20 Hz to 2000 Hz Duration: 4 min/cycle Number of Cycles/Axis: 4 Axes: X, Y, Z |
MIL-STD-883 Method 2007 Condition A |
| Fiber Side Pull | 0.23 kg, 90°, 5 sec, 2 directions | GR-1209-CORE |
| Click for Graphs:
|
||
| Damp Heat Storage (Group 2) | ||
| The performance of these WDMs was tested in damp heat at a Thorlabs facility. A Test Equity Model 115A Temperature Chamber was used to maintain an 85 °C ± 2 °C temperature with 85% ± 5% relative humidity for 2000 hours. | ||
| Test Parameter | Conditions | Reference |
| Damp Heat | 85 °C (±2 °C) 85% (±5%) Relative Humidity 2000 Hours |
MIL-STD-883 Method 103 |
| Click for Graphs:
|
||
| High Temperature Storage (Group 3) | ||
| The performance of these WDMs was tested in dry high temperatures in a Thorlabs facility. A Test Equity Model 115A Temperature Chamber was used to maintain an 85 °C ± 2 °C temperature with <40% Relative Humidity for 2000 hours. | ||
| Test Parameter | Conditions | Reference |
| High Temperature Storage (Dry Heat) | 85 °C (±2 °C) <40% Relative Humidity 2000 Hours |
EIA/TIA-455-4A |
| Click for Graphs:
|
||
| Low Temperature Storage (Group 4) | ||
| The performance of these WDMs was tested in damp heat at a Thorlabs facility. A Test Equity Model 115A Temperature Chamber was used to maintain a -40 °C ± 5 °C temperature with uncontrolled relative humidity for 2000 hours. | ||
| Test Parameter | Conditions | Reference |
| Low Temperature Storage | -40 °C (±5 °C) Uncontrolled Relative Humidity 2000 Hours |
EIA/TIA-455-4A |
| Click for Graphs:
|
||
| Temperature Cycling (Group 5) | ||
| At a Thorlabs facility, the performance of these WDMs was tested during temperature cycling of their environment. The temperature varied from -40 °C to 85 °C (±2 °C) through 500 cycles with a 10 minutes pause at room temperature at each cycle. | ||
| Test Parameter | Conditions | Reference |
| Temperature Cycling | -40 °C to 85 °C (±2 °C) 500 Cycles with 10 Minute Pause at Room Temperature |
MIL-STD-883 Method 1010 |
| Click for Graphs:
|
||
 Click to Enlarge
 Click to Enlarge
 Click to Enlarge
 Click to Enlarge
 Click to Enlarge
 Click to Enlarge
 Click to Enlarge
 Click to Enlarge
 Click to Enlarge
 Click to Enlarge
| Quick Links |
|---|
| Damage at the Air / Glass Interface |
| Intrinsic Damage Threshold |
| Preparation and Handling of Optical Fibers |
Laser-Induced Damage in Silica Optical Fibers
The following tutorial details damage mechanisms relevant to unterminated (bare) fiber, terminated optical fiber, and other fiber components from laser light sources. These mechanisms include damage that occurs at the air / glass interface (when free-space coupling or when using connectors) and in the optical fiber itself. A fiber component, such as a bare fiber, patch cable, or fused coupler, may have multiple potential avenues for damage (e.g., connectors, fiber end faces, and the device itself). The maximum power that a fiber can handle will always be limited by the lowest limit of any of these damage mechanisms.
While the damage threshold can be estimated using scaling relations and general rules, absolute damage thresholds in optical fibers are very application dependent and user specific. Users can use this guide to estimate a safe power level that minimizes the risk of damage. Following all appropriate preparation and handling guidelines, users should be able to operate a fiber component up to the specified maximum power level; if no maximum is specified for a component, users should abide by the "practical safe level" described below for safe operation of the component. Factors that can reduce power handling and cause damage to a fiber component include, but are not limited to, misalignment during fiber coupling, contamination of the fiber end face, or imperfections in the fiber itself. For further discussion about an optical fiber’s power handling abilities for a specific application, please contact Thorlabs’ Tech Support.
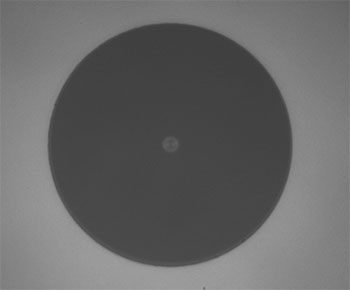
Click to Enlarge
Undamaged Fiber End
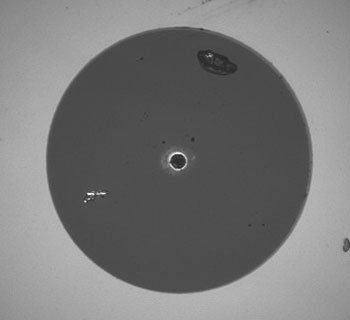
Click to Enlarge
Damaged Fiber End
Damage at the Air / Glass Interface
There are several potential damage mechanisms that can occur at the air / glass interface. Light is incident on this interface when free-space coupling or when two fibers are mated using optical connectors. High-intensity light can damage the end face leading to reduced power handling and permanent damage to the fiber. For fibers terminated with optical connectors where the connectors are fixed to the fiber ends using epoxy, the heat generated by high-intensity light can burn the epoxy and leave residues on the fiber facet directly in the beam path.
| Estimated Optical Power Densities on Air / Glass Interfacea | ||
|---|---|---|
| Type | Theoretical Damage Thresholdb | Practical Safe Levelc |
| CW (Average Power) |
~1 MW/cm2 | ~250 kW/cm2 |
| 10 ns Pulsed (Peak Power) |
~5 GW/cm2 | ~1 GW/cm2 |
Damage Mechanisms on the Bare Fiber End Face
Damage mechanisms on a fiber end face can be modeled similarly to bulk optics, and industry-standard damage thresholds for UV Fused Silica substrates can be applied to silica-based fiber. However, unlike bulk optics, the relevant surface areas and beam diameters involved at the air / glass interface of an optical fiber are very small, particularly for coupling into single mode (SM) fiber. therefore, for a given power density, the power incident on the fiber needs to be lower for a smaller beam diameter.
The table to the right lists two thresholds for optical power densities: a theoretical damage threshold and a "practical safe level". In general, the theoretical damage threshold represents the estimated maximum power density that can be incident on the fiber end face without risking damage with very good fiber end face and coupling conditions. The "practical safe level" power density represents minimal risk of fiber damage. Operating a fiber or component beyond the practical safe level is possible, but users must follow the appropriate handling instructions and verify performance at low powers prior to use.
Calculating the Effective Area for Single Mode Fibers
The effective area for single mode (SM) fiber is defined by the mode field diameter (MFD), which is the cross-sectional area through which light propagates in the fiber; this area includes the fiber core and also a portion of the cladding. To achieve good efficiency when coupling into a single mode fiber, the diameter of the input beam must match the MFD of the fiber.
As an example, SM400 single mode fiber has a mode field diameter (MFD) of ~Ø3 µm operating at 400 nm, while the MFD for SMF-28 Ultra single mode fiber operating at 1550 nm is Ø10.5 µm. The effective area for these fibers can be calculated as follows:
SM400 Fiber: Area = Pi x (MFD/2)2 = Pi x (1.5 µm)2 = 7.07 µm2 = 7.07 x 10⁻⁸ cm2
SMF-28 Ultra Fiber: Area = Pi x (MFD/2)2 = Pi x (5.25 µm)2 = 86.6 µm2 = 8.66 x 10⁻⁷ cm2
To estimate the power level that a fiber facet can handle, the power density is multiplied by the effective area. Please note that this calculation assumes a uniform intensity profile, but most laser beams exhibit a Gaussian-like shape within single mode fiber, resulting in a higher power density at the center of the beam compared to the edges. Therefore, these calculations will slightly overestimate the power corresponding to the damage threshold or the practical safe level. Using the estimated power densities assuming a CW light source, we can determine the corresponding power levels as:
SM400 Fiber: 7.07 x 10⁻⁸ cm2 x 1 MW/cm2 = 7.1 x 10⁻⁸ MW = 71 mW (Theoretical Damage Threshold)
7.07 x 10⁻⁸ cm2 x 250 kW/cm2 = 1.8 x 10⁻⁵ kW = 18 mW (Practical Safe Level)
SMF-28 Ultra Fiber: 8.66 x 10⁻⁷ cm2 x 1 MW/cm2 = 8.7 x 10⁻⁷ MW = 870 mW (Theoretical Damage Threshold)
8.66 x 10⁻⁷ cm2 x 250 kW/cm2 = 2.1 x 10⁻⁴ kW = 210 mW (Practical Safe Level)
Effective Area of Multimode Fibers
The effective area of a multimode (MM) fiber is defined by the core diameter, which is typically far larger than the MFD of an SM fiber. For optimal coupling, Thorlabs recommends focusing a beam to a spot roughly 70 - 80% of the core diameter. The larger effective area of MM fibers lowers the power density on the fiber end face, allowing higher optical powers (typically on the order of kilowatts) to be coupled into multimode fiber without damage.
Damage Mechanisms Related to Ferrule / Connector Termination
 Click to Enlarge
Plot showing approximate input power that can be incident on a single mode silica optical fiber with a termination. Each line shows the estimated power level due to a specific damage mechanism. The maximum power handling is limited by the lowest power level from all relevant damage mechanisms (indicated by a solid line).
Fibers terminated with optical connectors have additional power handling considerations. Fiber is typically terminated using epoxy to bond the fiber to a ceramic or steel ferrule. When light is coupled into the fiber through a connector, light that does not enter the core and propagate down the fiber is scattered into the outer layers of the fiber, into the ferrule, and the epoxy used to hold the fiber in the ferrule. If the light is intense enough, it can burn the epoxy, causing it to vaporize and deposit a residue on the face of the connector. This results in localized absorption sites on the fiber end face that reduce coupling efficiency and increase scattering, causing further damage.
For several reasons, epoxy-related damage is dependent on the wavelength. In general, light scatters more strongly at short wavelengths than at longer wavelengths. Misalignment when coupling is also more likely due to the small MFD of short-wavelength SM fiber that also produces more scattered light.
To minimize the risk of burning the epoxy, fiber connectors can be constructed to have an epoxy-free air gap between the optical fiber and ferrule near the fiber end face. Our high-power multimode fiber patch cables use connectors with this design feature.
Determining Power Handling with Multiple Damage Mechanisms
When fiber cables or components have multiple avenues for damage (e.g., fiber patch cables), the maximum power handling is always limited by the lowest damage threshold that is relevant to the fiber component. In general, this represents the highest input power that can be incident on the patch cable end face and not the coupled output power.
As an illustrative example, the graph to the right shows an estimate of the power handling limitations of a single mode fiber patch cable due to damage to the fiber end face and damage via an optical connector. The total input power handling of a terminated fiber at a given wavelength is limited by the lower of the two limitations at any given wavelength (indicated by the solid lines). A single mode fiber operating at around 488 nm is primarily limited by damage to the fiber end face (blue solid line), but fibers operating at 1550 nm are limited by damage to the optical connector (red solid line).
In the case of a multimode fiber, the effective mode area is defined by the core diameter, which is larger than the effective mode area for SM fiber. This results in a lower power density on the fiber end face and allows higher optical powers (on the order of kilowatts) to be coupled into the fiber without damage (not shown in graph). However, the damage limit of the ferrule / connector termination remains unchanged and as a result, the maximum power handling for a multimode fiber is limited by the ferrule and connector termination.
Please note that these are rough estimates of power levels where damage is very unlikely with proper handling and alignment procedures. It is worth noting that optical fibers are frequently used at power levels above those described here. However, these applications typically require expert users and testing at lower powers first to minimize risk of damage. Even still, optical fiber components should be considered a consumable lab supply if used at high power levels.
Intrinsic Damage Threshold
In addition to damage mechanisms at the air / glass interface, optical fibers also display power handling limitations due to damage mechanisms within the optical fiber itself. These limitations will affect all fiber components as they are intrinsic to the fiber itself. Two categories of damage within the fiber are damage from bend losses and damage from photodarkening.
Bend Losses
Bend losses occur when a fiber is bent to a point where light traveling in the core is incident on the core/cladding interface at an angle higher than the critical angle, making total internal reflection impossible. Under these circumstances, light escapes the fiber, often in a localized area. The light escaping the fiber typically has a high power density, which burns the fiber coating as well as any surrounding furcation tubing.
A special category of optical fiber, called double-clad fiber, can reduce the risk of bend-loss damage by allowing the fiber’s cladding (2nd layer) to also function as a waveguide in addition to the core. By making the critical angle of the cladding/coating interface higher than the critical angle of the core/clad interface, light that escapes the core is loosely confined within the cladding. It will then leak out over a distance of centimeters or meters instead of at one localized spot within the fiber, minimizing the risk of damage. Thorlabs manufactures and sells 0.22 NA double-clad multimode fiber, which boasts very high, megawatt range power handling.
Photodarkening
A second damage mechanism, called photodarkening or solarization, can occur in fibers used with ultraviolet or short-wavelength visible light, particularly those with germanium-doped cores. Fibers used at these wavelengths will experience increased attenuation over time. The mechanism that causes photodarkening is largely unknown, but several fiber designs have been developed to mitigate it. For example, fibers with a very low hydroxyl ion (OH) content have been found to resist photodarkening and using other dopants, such as fluorine, can also reduce photodarkening.
Even with the above strategies in place, all fibers eventually experience photodarkening when used with UV or short-wavelength light, and thus, fibers used at these wavelengths should be considered consumables.
Preparation and Handling of Optical Fibers
General Cleaning and Operation Guidelines
These general cleaning and operation guidelines are recommended for all fiber optic products. Users should still follow specific guidelines for an individual product as outlined in the support documentation or manual. Damage threshold calculations only apply when all appropriate cleaning and handling procedures are followed.
-
All light sources should be turned off prior to installing or integrating optical fibers (terminated or bare). This ensures that focused beams of light are not incident on fragile parts of the connector or fiber, which can possibly cause damage.
-
The power-handling capability of an optical fiber is directly linked to the quality of the fiber/connector end face. Always inspect the fiber end prior to connecting the fiber to an optical system. The fiber end face should be clean and clear of dirt and other contaminants that can cause scattering of coupled light. Bare fiber should be cleaved prior to use and users should inspect the fiber end to ensure a good quality cleave is achieved.
-
If an optical fiber is to be spliced into the optical system, users should first verify that the splice is of good quality at a low optical power prior to high-power use. Poor splice quality may increase light scattering at the splice interface, which can be a source of fiber damage.
-
Users should use low power when aligning the system and optimizing coupling; this minimizes exposure of other parts of the fiber (other than the core) to light. Damage from scattered light can occur if a high power beam is focused on the cladding, coating, or connector.
Tips for Using Fiber at Higher Optical Power
Optical fibers and fiber components should generally be operated within safe power level limits, but under ideal conditions (very good optical alignment and very clean optical end faces), the power handling of a fiber component may be increased. Users must verify the performance and stability of a fiber component within their system prior to increasing input or output power and follow all necessary safety and operation instructions. The tips below are useful suggestions when considering increasing optical power in an optical fiber or component.
-
Splicing a fiber component into a system using a fiber splicer can increase power handling as it minimizes possibility of air/fiber interface damage. Users should follow all appropriate guidelines to prepare and make a high-quality fiber splice. Poor splices can lead to scattering or regions of highly localized heat at the splice interface that can damage the fiber.
-
After connecting the fiber or component, the system should be tested and aligned using a light source at low power. The system power can be ramped up slowly to the desired output power while periodically verifying all components are properly aligned and that coupling efficiency is not changing with respect to optical launch power.
-
Bend losses that result from sharply bending a fiber can cause light to leak from the fiber in the stressed area. When operating at high power, the localized heating that can occur when a large amount of light escapes a small localized area (the stressed region) can damage the fiber. Avoid disturbing or accidently bending fibers during operation to minimize bend losses.
-
Users should always choose the appropriate optical fiber for a given application. For example, large-mode-area fibers are a good alternative to standard single mode fibers in high-power applications as they provide good beam quality with a larger MFD, decreasing the power density on the air/fiber interface.
-
Step-index silica single mode fibers are normally not used for ultraviolet light or high-peak-power pulsed applications due to the high spatial power densities associated with these applications.
| Posted Comments: | |
chang.chen
(posted 2018-07-11 10:23:51.5) Hello,
I'm looking for a 2-color fiber combiners for 670 nm and 785 nm, but the laser sources are multi-mode fibers with different connectors. 670 nm has a SMA end (100 um core) and 785 nm has a FC/APC end (100 um core). Is it possible to combine them together in one MM fiber?
Thanks,
Chang YLohia
(posted 2018-07-11 11:57:32.0) Hello Chang, we may able to offer a customized version of TM105R5S2B with one of the input connectors being FC/APC (the other being SMA by default). You will have to place a fiber optic light trap on one of the output ends and there will be a 50% loss in your signal. We will reach out to you directly to discuss your application further. |
")
 Zoom
Zoom
Click to Enlarge
Click Here for Raw Data
This plot shows an example measurement of the spectral performance of a GB21 wavelength combiner. The lines represent the spectral response of each channel, while the colored regions denote the bandwidth around the center wavelengths. This data is typical; performance may vary from unit to unit within the combiner specifications. Data was obtained without connectors.
| GB21 Specifications | |||
|---|---|---|---|
| Port Jacket Color | Blue | Green | |
| Wavelength | 473 nm | 532 nm | |
| Bandwidtha | ±5 nm | ±5 nm | |
| Insertion Lossa,b | ≤0.4 dB | ≤0.4 dB | |
| Transmissiona,b | ≥91% | ≥91% | |
| Isolationa,c | @ 473 nm | N/A | ≥13 dB |
| @ 532 nm | ≥13 dB | N/A | |
| Polarization-Dependent Lossa | ≤0.2 dB | ||
| Optical Return Lossa | ≥60 dB | ||
| Fiber Typed | 460HP | ||
| Max Power Levele | 100 mW (Spliced) |
||
| Fiber Lead Length and Tolerance | 0.8 m +0.075 m/-0.0 m | ||
| Jacket | Ø900 µm Loose Hytrel®f Tube | ||
| Pigtail Tensile Load | 10 N | ||
| Package Dimensions | Ø0.12" x 2.95" (Ø3.2 mm x 75.0 mm) |
||
| Operating Temperature | -40 to 85 °C | ||
| Storage Temperature | -40 to 85 °C | ||
Each GB21 wavelength combiner is shipped with a detailed test report that includes transmission and isolation measurements as well as an insertion loss plot.
")
 Zoom
Zoom
Click to Enlarge
Click Here for Raw Data
This plot shows an example measurement of the spectral performance of a GB29 wavelength combiner. The lines represent the spectral response of each channel, while the colored regions denote the bandwidth around the center wavelengths. This data is typical; performance may vary from unit to unit within the combiner specifications. Data was obtained without connectors.
| GB29 Specifications | |||
|---|---|---|---|
| Port Jacket Color | Blue | Green | |
| Wavelength | 473 nm | 561 nm | |
| Bandwidtha | ±5 nm | ±5 nm | |
| Insertion Lossa,b | ≤0.4 dB | ≤0.4 dB | |
| Transmissiona,b | ≥91% | ≥91% | |
| Isolationa,c | @ 473 nm | N/A | ≥13 dB |
| @ 561 nm | ≥13 dB | N/A | |
| Polarization-Dependent Lossa | ≤0.2 dB | ||
| Optical Return Lossa | ≥60 dB | ||
| Fiber Typed | 460HP | ||
| Max Power Levele | 100 mW (Spliced) |
||
| Fiber Lead Length and Tolerance | 0.8 m +0.075 m/-0.0 m | ||
| Jacket | Ø900 µm Loose Hytrel®f Tube | ||
| Pigtail Tensile Load | 10 N | ||
| Package Dimensions | Ø0.12" x 2.95" (Ø3.2 mm x 75.0 mm) |
||
| Operating Temperature | -40 to 85 °C | ||
| Storage Temperature | -40 to 85 °C | ||
Each GB29 wavelength combiner is shipped with a detailed test report that includes transmission and isolation measurements as well as an insertion loss plot.
")
 Zoom
Zoom
Click to Enlarge
Click Here for Raw Data
This plot shows an example measurement of the spectral performance of a GB11 wavelength combiner. The lines represent the spectral response of each channel, while the colored regions denote the bandwidth around the center wavelengths. This data is typical; performance may vary from unit to unit within the combiner specifications. Data was obtained without connectors.
| GB11 Specifications | |||
|---|---|---|---|
| Port Jacket Color | Blue | Green | |
| Wavelength | 488 nm | 532 nm | |
| Bandwidtha | ±5 nm | ±5 nm | |
| Insertion Lossa,b | ≤0.4 dB | ≤0.4 dB | |
| Transmissiona,b | ≥91% | ≥91% | |
| Isolationa,c | @ 488 nm | N/A | ≥13 dB |
| @ 532 nm | ≥13 dB | N/A | |
| Polarization-Dependent Lossa | ≤0.2 dB | ||
| Optical Return Lossa | ≥60 dB | ||
| Fiber Typed | 460HP | ||
| Max Power Levele | 100 mW (Spliced) |
||
| Fiber Lead Length and Tolerance | 0.8 m +0.075 m/-0.0 m | ||
| Jacket | Ø900 µm Loose Hytrel®f Tube | ||
| Pigtail Tensile Load | 10 N | ||
| Package Dimensions | Ø0.12" x 2.95" (Ø3.2 mm x 75.0 mm) |
||
| Operating Temperature | -40 to 85 °C | ||
| Storage Temperature | -40 to 85 °C | ||
Each GB11 wavelength combiner is shipped with a detailed test report that includes transmission and isolation measurements as well as an insertion loss plot.
")
 Zoom
Zoom
Click to Enlarge
Click Here for Raw Data
This plot shows an example measurement of the spectral performance of a GB19 wavelength combiner. The lines represent the spectral response of each channel, while the colored regions denote the bandwidth around the center wavelengths. This data is typical; performance may vary from unit to unit within the combiner specifications. Data was obtained without connectors.
| GB19 Specifications | |||
|---|---|---|---|
| Port Jacket Color | Blue | Green | |
| Wavelength | 488 nm | 561 nm | |
| Bandwidtha | ±5 nm | ±5 nm | |
| Insertion Lossa,b | ≤0.3 dB | ≤0.3 dB | |
| Transmissiona,b | ≥93% | ≥93% | |
| Isolationa,c | @ 488 nm | N/A | ≥15 dB |
| @ 561 nm | ≥15 dB | N/A | |
| Polarization-Dependent Lossa | ≤0.2 dB | ||
| Optical Return Lossa | ≥60 dB | ||
| Fiber Typed | 460HP | ||
| Max Power Levele | 100 mW (Spliced) |
||
| Fiber Lead Length and Tolerance | 0.8 m +0.075 m/-0.0 m | ||
| Jacket | Ø900 µm Loose Hytrel®f Tube | ||
| Pigtail Tensile Load | 10 N | ||
| Package Dimensions | Ø0.12" x 2.95" (Ø3.2 mm x 75.0 mm) |
||
| Operating Temperature | -40 to 85 °C | ||
| Storage Temperature | -40 to 85 °C | ||
Each GB19 wavelength combiner is shipped with a detailed test report that includes transmission and isolation measurements as well as an insertion loss plot.
")
 Zoom
Zoom
Click to Enlarge
Click Here for Raw Data
This plot shows an example measurement of the spectral performance of a RB32 wavelength combiner. The lines represent the spectral response of each channel, while the colored regions denote the bandwidth around the center wavelengths. This data is typical; performance may vary from unit to unit within the combiner specifications. Data was obtained without connectors.
| RB32 Specifications | |||
|---|---|---|---|
| Port Jacket Color | Blue | Red | |
| Wavelength | 473 nm | 633 nm | |
| Bandwidtha | ±5 nm | ±5 nm | |
| Insertion Lossa,b | ≤0.3 dB | ≤0.3 dB | |
| Transmissiona,b | ≥93% | ≥93% | |
| Isolationa,c | @ 473 nm | N/A | ≥13 dB |
| @ 633 nm | ≥13 dB | N/A | |
| Polarization-Dependent Lossa | ≤0.2 dB | ||
| Optical Return Lossa | ≥60 dB | ||
| Fiber Typed | 460HP | ||
| Max Power Levele | 100 mW (Spliced) |
||
| Fiber Lead Length and Tolerance | 0.8 m +0.075 m/-0.0 m | ||
| Jacket | Ø900 µm Loose Hytrel®f Tube | ||
| Pigtail Tensile Load | 10 N | ||
| Package Dimensions | Ø0.12" x 2.95" (Ø3.2 mm x 75.0 mm) |
||
| Operating Temperature | -40 to 85 °C | ||
| Storage Temperature | -40 to 85 °C | ||
Each RB32 wavelength combiner is shipped with a detailed test report that includes transmission and isolation measurements as well as an insertion loss plot.
")
 Zoom
Zoom
Click to Enlarge
Click Here for Raw Data
This plot shows an example measurement of the spectral performance of a RB42 wavelength combiner. The lines represent the spectral response of each channel, while the colored regions denote the bandwidth around the center wavelengths. This data is typical; performance may vary from unit to unit within the combiner specifications. Data was obtained without connectors.
| RB42 Specifications | |||
|---|---|---|---|
| Port Jacket Color | Blue | Red | |
| Wavelength | 473 nm | 640 nm | |
| Bandwidtha | ±5 nm | ±5 nm | |
| Insertion Lossa,b | ≤0.3 dB | ≤0.3 dB | |
| Transmissiona,b | ≥93% | ≥93% | |
| Isolationa,c | @ 473 nm | N/A | ≥13 dB |
| @ 640 nm | ≥13 dB | N/A | |
| Polarization-Dependent Lossa | ≤0.2 dB | ||
| Optical Return Lossa | ≥60 dB | ||
| Fiber Typed | 460HP | ||
| Max Power Levele | 100 mW (Spliced) |
||
| Fiber Lead Length and Tolerance | 0.8 m +0.075 m/-0.0 m | ||
| Jacket | Ø900 µm Loose Hytrel®f Tube | ||
| Pigtail Tensile Load | 10 N | ||
| Package Dimensions | Ø0.12" x 2.95" (Ø3.2 mm x 75.0 mm) |
||
| Operating Temperature | -40 to 85 °C | ||
| Storage Temperature | -40 to 85 °C | ||
Each RB42 wavelength combiner is shipped with a detailed test report that includes transmission and isolation measurements as well as an insertion loss plot.
")
 Zoom
Zoom
Click to Enlarge
Click Here for Raw Data
This plot shows an example measurement of the spectral performance of a RB62 wavelength combiner. The lines represent the spectral response of each channel, while the colored regions denote the bandwidth around the center wavelengths. This data is typical; performance may vary from unit to unit within the combiner specifications. Data was obtained without connectors.
| RB62 Specifications | |||
|---|---|---|---|
| Port Jacket Color | Blue | Red | |
| Wavelength | 473 nm | 670 nm | |
| Bandwidtha | ±5 nm | ±5 nm | |
| Insertion Lossa,b | ≤0.3 dB | ≤0.3 dB | |
| Transmissiona,b | ≥93% | ≥93% | |
| Isolationa,c | @ 473 nm | N/A | ≥15 dB |
| @ 670 nm | ≥15 dB | N/A | |
| Polarization-Dependent Lossa | ≤0.2 dB | ||
| Optical Return Lossa | ≥60 dB | ||
| Fiber Typed | 460HP | ||
| Max Power Levele | 100 mW (Spliced) |
||
| Fiber Lead Length and Tolerance | 0.8 m +0.075 m/-0.0 m | ||
| Jacket | Ø900 µm Loose Hytrel®f Tube | ||
| Pigtail Tensile Load | 10 N | ||
| Package Dimensions | Ø0.12" x 2.95" (Ø3.2 mm x 75.0 mm) |
||
| Operating Temperature | -40 to 85 °C | ||
| Storage Temperature | -40 to 85 °C | ||
Each RB62 wavelength combiner is shipped with a detailed test report that includes transmission and isolation measurements as well as an insertion loss plot.
")
 Zoom
Zoom
Click to Enlarge
Click Here for Raw Data
This plot shows an example measurement of the spectral performance of a RB31 wavelength combiner. The lines represent the spectral response of each channel, while the colored regions denote the bandwidth around the center wavelengths. This data is typical; performance may vary from unit to unit within the combiner specifications. Data was obtained without connectors.
| RB31 Specifications | |||
|---|---|---|---|
| Port Jacket Color | Blue | Red | |
| Wavelength | 488 nm | 633 nm | |
| Bandwidtha | ±5 nm | ±5 nm | |
| Insertion Lossa,b | ≤0.4 dB | ≤0.4 dB | |
| Transmissiona,b | ≥91% | ≥91% | |
| Isolationa,c | @ 488 nm | N/A | ≥13 dB |
| @ 633 nm | ≥13 dB | N/A | |
| Polarization-Dependent Lossa | ≤0.2 dB | ||
| Optical Return Lossa | ≥60 dB | ||
| Fiber Typed | 460HP | ||
| Max Power Levele | 100 mW (Spliced) |
||
| Fiber Lead Length and Tolerance | 0.8 m +0.075 m/-0.0 m | ||
| Jacket | Ø900 µm Loose Hytrel®f Tube | ||
| Pigtail Tensile Load | 10 N | ||
| Package Dimensions | Ø0.12" x 2.95" (Ø3.2 mm x 75.0 mm) |
||
| Operating Temperature | -40 to 85 °C | ||
| Storage Temperature | -40 to 85 °C | ||
Each RB31 wavelength combiner is shipped with a detailed test report that includes transmission and isolation measurements as well as an insertion loss plot.
")
 Zoom
Zoom
Click to Enlarge
Click Here for Raw Data
This plot shows an example measurement of the spectral performance of a RB41 wavelength combiner. The lines represent the spectral response of each channel, while the colored regions denote the bandwidth around the center wavelengths. This data is typical; performance may vary from unit to unit within the combiner specifications. Data was obtained without connectors.
| RB41 Specifications | |||
|---|---|---|---|
| Port Jacket Color | Blue | Red | |
| Wavelength | 488 nm | 640 nm | |
| Bandwidtha | ±5 nm | ±5 nm | |
| Insertion Lossa,b | ≤0.3 dB | ≤0.3 dB | |
| Transmissiona,b | ≥93% | ≥93% | |
| Isolationa,c | @ 488 nm | N/A | ≥16 dB |
| @ 640 nm | ≥16 dB | N/A | |
| Polarization-Dependent Lossa | ≤0.2 dB | ||
| Optical Return Lossa | ≥60 dB | ||
| Fiber Typed | 460HP | ||
| Max Power Levele | 100 mW (Spliced) |
||
| Fiber Lead Length and Tolerance | 0.8 m +0.075 m/-0.0 m | ||
| Jacket | Ø900 µm Loose Hytrel®f Tube | ||
| Pigtail Tensile Load | 10 N | ||
| Package Dimensions | Ø0.12" x 2.95" (Ø3.2 mm x 75.0 mm) |
||
| Operating Temperature | -40 to 85 °C | ||
| Storage Temperature | -40 to 85 °C | ||
Each RB41 wavelength combiner is shipped with a detailed test report that includes transmission and isolation measurements as well as an insertion loss plot.
")
 Zoom
Zoom
Click to Enlarge
Click Here for Raw Data
This plot shows an example measurement of the spectral performance of a RB41 PM wavelength combiner. The lines represent the spectral response of each channel, while the colored regions denote the bandwidth around the center wavelengths. This data is typical; performance may vary from unit to unit within the combiner specifications. Data was obtained without connectors.
| RB41 PM Specifications | |||
|---|---|---|---|
| Port Jacket Color | Blue | Red | |
| Design Wavelength | 488 nm | 640 nm | |
| Operating Range | 473 - 532 nm | 630 - 650 nm | |
| Insertion Lossa,b | ≤0.7 dB @ 488 nm |
≤0.7 dB @ 640 nm |
|
| Transmissiona,b | ≥85% @ 488 nm |
≥85% @ 640 nm |
|
| Polarization Extinction Ratioc | ≥20.0 dB | ≥20.0 dB | |
| Isolationa,d | @ 488 nm | N/A | ≥17 dB |
| @ 640 nm | ≥17 dB | N/A | |
| Optical Return Lossa | ≥60 dB | ||
| Fiber Typee | Thorlabs Custom PANDA Fiber | ||
| Max Power Levelf | 100 mW (Spliced) |
||
| Fiber Lead Length and Tolerance | 0.8 m +0.075 m/-0.0 m | ||
| Jacket | Ø900 µm Loose Hytrel®g Tube | ||
| Pigtail Tensile Load | 10 N | ||
| Package Dimensions | Ø0.12" x 2.95" (Ø3.2 mm x 75.0 mm) |
||
| Operating Temperature | -40 to 85 °C | ||
| Storage Temperature | -40 to 85 °C | ||
- Values are specified with a slow axis launch at room temperature without connectors through the common port.
- Transmission is calculated from the measured insertion loss; both values are provided here for convenience.
- Specified with a slow axis launch at room temperature with connectors and measured at 488 nm and 640 nm respectively through the common port.
- Isolation represents the maximum crosstalk between the channels.
- Click the red docs (
 ) icon below to see the spec sheet for full specifications.
 - Specifies the total maximum power allowed through the component. Coupler performance and reliability under high power conditions must be determined within the user's setup.
- Hytrel® is a registered trademark of DuPont Polymers, Inc.
Each RB41 PM wavelength combiner is shipped with a detailed test report that includes transmission and isolation measurements as well as an insertion loss plot.
")
 Zoom
Zoom
Click to Enlarge
Click Here for Raw Data
This plot shows an example measurement of the spectral performance of a RB61 wavelength combiner. The lines represent the spectral response of each channel, while the colored regions denote the bandwidth around the center wavelengths. This data is typical; performance may vary from unit to unit within the combiner specifications. Data was obtained without connectors.
| RB61 Specifications | |||
|---|---|---|---|
| Port Jacket Color | Blue | Red | |
| Wavelength | 488 nm | 670 nm | |
| Bandwidtha | ±5 nm | ±5 nm | |
| Insertion Lossa,b | ≤0.3 dB | ≤0.3 dB | |
| Transmissiona,b | ≥93% | ≥93% | |
| Isolationa,c | @ 488 nm | N/A | ≥16 dB |
| @ 670 nm | ≥16 dB | N/A | |
| Polarization-Dependent Lossa | ≤0.2 dB | ||
| Optical Return Lossa | ≥60 dB | ||
| Fiber Typed | 460HP | ||
| Max Power Levele | 100 mW (Spliced) |
||
| Fiber Lead Length and Tolerance | 0.8 m +0.075 m/-0.0 m | ||
| Jacket | Ø900 µm Loose Hytrel®f Tube | ||
| Pigtail Tensile Load | 10 N | ||
| Package Dimensions | Ø0.12" x 2.95" (Ø3.2 mm x 75.0 mm) |
||
| Operating Temperature | -40 to 85 °C | ||
| Storage Temperature | -40 to 85 °C | ||
Each RB61 wavelength combiner is shipped with a detailed test report that includes transmission and isolation measurements as well as an insertion loss plot.
")
 Zoom
Zoom
Click to Enlarge
Click Here for Raw Data
This plot shows an example measurement of the spectral performance of a RG43 wavelength combiner. The lines represent the spectral response of each channel, while the colored regions denote the bandwidth around the center wavelengths. This data is typical; performance may vary from unit to unit within the combiner specifications. Data was obtained without connectors.
| RG43 Specifications | |||
|---|---|---|---|
| Port Jacket Color | Green | Red | |
| Wavelength | 532 nm | 640 nm | |
| Bandwidtha | ±5 nm | ±5 nm | |
| Insertion Lossa,b | ≤0.3 dB | ≤0.3 dB | |
| Transmissiona,b | ≥93% | ≥93% | |
| Isolationa,c | @ 532 nm | N/A | ≥16 dB |
| @ 640 nm | ≥16 dB | N/A | |
| Polarization-Dependent Lossa | ≤0.2 dB | ||
| Optical Return Lossa | ≥60 dB | ||
| Fiber Typed | 460HP | ||
| Max Power Levele | 250 mW (Spliced) |
||
| Fiber Lead Length and Tolerance | 0.8 m +0.075 m/-0.0 m | ||
| Jacket | Ø900 µm Loose Hytrel®f Tube | ||
| Pigtail Tensile Load | 10 N | ||
| Package Dimensions | Ø0.12" x 2.95" (Ø3.2 mm x 75.0 mm) |
||
| Operating Temperature | -40 to 85 °C | ||
| Storage Temperature | -40 to 85 °C | ||
Each RG43 wavelength combiner is shipped with a detailed test report that includes transmission and isolation measurements as well as an insertion loss plot.
")
 Zoom
Zoom
Click to Enlarge
Click Here for Raw Data
This plot shows an example measurement of the spectral performance of a RG40 wavelength combiner. The lines represent the spectral response of each channel, while the colored regions denote the bandwidth around the center wavelengths. This data is typical; performance may vary from unit to unit within the combiner specifications. Data was obtained without connectors.
| RG40 Specifications | |||
|---|---|---|---|
| Port Jacket Color | Green | Red | |
| Wavelength | 532 nm | 670 nm | |
| Bandwidtha | ±5 nm | ±5 nm | |
| Insertion Lossa,b | ≤0.3 dB | ≤0.3 dB | |
| Transmissiona,b | ≥93% | ≥93% | |
| Isolationa,c | @ 532 nm | N/A | ≥15 dB |
| @ 670 nm | ≥15 dB | N/A | |
| Polarization-Dependent Lossa | ≤0.2 dB | ||
| Optical Return Lossa | ≥60 dB | ||
| Fiber Typed | 460HP | ||
| Max Power Levele | 250 mW (Spliced) |
||
| Fiber Lead Length and Tolerance | 0.8 m +0.075 m/-0.0 m | ||
| Jacket | Ø900 µm Loose Hytrel®f Tube | ||
| Pigtail Tensile Load | 10 N | ||
| Package Dimensions | Ø0.12" x 2.95" (Ø3.2 mm x 75.0 mm) |
||
| Operating Temperature | -40 to 85 °C | ||
| Storage Temperature | -40 to 85 °C | ||
Each RG40 wavelength combiner is shipped with a detailed test report that includes transmission and isolation measurements as well as an insertion loss plot.
")
 Zoom
Zoom
Click to Enlarge
Click Here for Raw Data
This plot shows an example of the spectral performance of a RG45 wavelength combiner. The lines represent the spectral response of each channel, while the colored regions denote the bandwidth around the center wavelengths. This data is typical; performance may vary from unit to unit within the combiner specifications. Data was obtained without connectors.
| RG45 Specifications | |||
|---|---|---|---|
| Port Jacket Color | Green | Red | |
| Wavelength | 561 nm | 640 nm | |
| Bandwidtha | ±5 nm | ±5 nm | |
| Insertion Lossa,b | ≤0.3 dB | ≤0.3 dB | |
| Transmissiona,b | ≥93% | ≥93% | |
| Isolationa,c | @ 561 nm | N/A | ≥16 dB |
| @ 640 nm | ≥16 dB | N/A | |
| Polarization-Dependent Lossa | ≤0.2 dB | ||
| Optical Return Lossa | ≥60 dB | ||
| Fiber Typed | 460HP | ||
| Max Power Levele | 250 mW (Spliced) |
||
| Fiber Lead Length and Tolerance | 0.8 m +0.075 m/-0.0 m | ||
| Jacket | Ø900 µm Loose Hytrel®f Tube | ||
| Pigtail Tensile Load | 10 N | ||
| Package Dimensions | Ø0.12" x 2.95" (Ø3.2 mm x 75.0 mm) |
||
| Operating Temperature | -40 to 85 °C | ||
| Storage Temperature | -40 to 85 °C | ||
Each RG45 wavelength combiner is shipped with a detailed test report that includes transmission and isolation measurements as well as an insertion loss plot.
")
 Zoom
Zoom
Click to Enlarge
Click Here for Raw Data
This plot shows an example of the spectral performance of a RG65 wavelength combiner. The lines represent the spectral response of each channel, while the colored regions denote the bandwidth around the center wavelengths. This data is typical; performance may vary from unit to unit within the combiner specifications. Data was obtained without connectors.
| RG65 Specifications | |||
|---|---|---|---|
| Port Jacket Color | Green | Red | |
| Wavelength | 561 nm | 670 nm | |
| Bandwidtha | ±5 nm | ±5 nm | |
| Insertion Lossa,b | ≤0.3 dB | ≤0.3 dB | |
| Transmissiona,b | ≥93% | ≥93% | |
| Isolationa,c | @ 561 nm | N/A | ≥16 dB |
| @ 670 nm | ≥16 dB | N/A | |
| Polarization-Dependent Lossa | ≤0.2 dB | ||
| Optical Return Lossa | ≥60 dB | ||
| Fiber Typed | 460HP | ||
| Max Power Levele | 250 mW (Spliced) |
||
| Fiber Lead Length and Tolerance | 0.8 m +0.075 m/-0.0 m | ||
| Jacket | Ø900 µm Loose Hytrel®f Tube | ||
| Pigtail Tensile Load | 10 N | ||
| Package Dimensions | Ø0.12" x 2.95" (Ø3.2 mm x 75.0 mm) |
||
| Operating Temperature | -40 to 85 °C | ||
| Storage Temperature | -40 to 85 °C | ||
Each RG65 wavelength combiner is shipped with a detailed test report that includes transmission and isolation measurements as well as an insertion loss plot.
")
 Zoom
Zoom
Click to Enlarge
Click Here for Raw Data
This plot shows an example of the spectral performance of an NG71 wavelength combiner. The lines represent the spectral response of each channel, while the colored regions denote the bandwidth around the center wavelengths. This data is typical; performance may vary from unit to unit within the combiner specifications. Data was obtained without connectors.
| NG71 Specifications | |||
|---|---|---|---|
| Port Jacket Color | Green | White (NIR)a | |
| Wavelength | 532 nm | 785 nm | |
| Bandwidthb | ±5 nm | ±5 nm | |
| Insertion Lossb,c | ≤0.3 dB | ≤0.3 dB | |
| Transmissionb,c | ≥93% | ≥93% | |
| Isolationb,d | @ 532 nm | N/A | ≥15 dB |
| @ 785 nm | ≥15 dB | N/A | |
| Polarization-Dependent Lossb | ≤0.2 dB | ||
| Optical Return Lossb | ≥60 dB | ||
| Fiber Typee | 630HP | ||
| Max Power Levelf | 250 mW (Spliced) |
||
| Fiber Lead Length and Tolerance | 0.8 m +0.075 m/-0.0 m | ||
| Jacket | Ø900 µm Loose Hytrel®g Tube | ||
| Pigtail Tensile Load | 10 N | ||
| Package Dimensions | Ø0.12" x 2.95" (Ø3.2 mm x 75.0 mm) |
||
| Operating Temperature | -40 to 85 °C | ||
| Storage Temperature | -40 to 85 °C | ||
Each NG71 wavelength combiner is shipped with a detailed test report that includes transmission and isolation measurements as well as an insertion loss plot.
")
 Zoom
Zoom
Click to Enlarge
Click Here for Raw Data
This plot shows an example of the spectral performance of an NG72 wavelength combiner. The lines represent the spectral response of each channel, while the colored regions denote the bandwidth around the center wavelengths. This data is typical; performance may vary from unit to unit within the combiner specifications. Data was obtained without connectors.
| NG72 Specifications | |||
|---|---|---|---|
| Port Jacket Color | Green | White (NIR)a | |
| Wavelength | 561 nm | 785 nm | |
| Bandwidthb | ±5 nm | ±5 nm | |
| Insertion Lossb,c | ≤0.3 dB | ≤0.3 dB | |
| Transmissionb,c | ≥93% | ≥93% | |
| Isolationb,d | @ 561 nm | N/A | ≥13 dB |
| @ 785 nm | ≥13 dB | N/A | |
| Polarization-Dependent Lossb | ≤0.2 dB | ||
| Optical Return Lossb | ≥60 dB | ||
| Fiber Typee | 630HP | ||
| Max Power Levelf | 250 mW (Spliced) |
||
| Fiber Lead Length and Tolerance | 0.8 m +0.075 m/-0.0 m | ||
| Jacket | Ø900 µm Loose Hytrel®g Tube | ||
| Pigtail Tensile Load | 10 N | ||
| Package Dimensions | Ø0.12" x 2.95" (Ø3.2 mm x 75.0 mm) |
||
| Operating Temperature | -40 to 85 °C | ||
| Storage Temperature | -40 to 85 °C | ||
Each NG72 wavelength combiner is shipped with a detailed test report that includes transmission and isolation measurements as well as an insertion loss plot.
")
 Zoom
Zoom
Click to Enlarge
Click Here for Raw Data
This plot shows an example of the spectral performance of an NR73 wavelength combiner. The lines represent the spectral response of each channel, while the colored regions denote the bandwidth around the center wavelengths. This data is typical; performance may vary from unit to unit within the combiner specifications. Data was obtained without connectors.
| NR73 Specifications | |||
|---|---|---|---|
| Port Jacket Color | Red | White (NIR)a | |
| Wavelength | 633 nm | 785 nm | |
| Bandwidthb | ±5 nm | ±5 nm | |
| Insertion Lossb,c | ≤0.3 dB | ≤0.3 dB | |
| Transmissionb,c | ≥93% | ≥93% | |
| Isolationb,d | @ 633 nm | N/A | ≥16 dB |
| @ 785 nm | ≥16 dB | N/A | |
| Polarization-Dependent Lossb | ≤0.2 dB | ||
| Optical Return Lossb | ≥60 dB | ||
| Fiber Typee | 630HP | ||
| Max Power Levelf | 500 mW (Spliced) |
||
| Fiber Lead Length and Tolerance | 0.8 m +0.075 m/-0.0 m | ||
| Jacket | Ø900 µm Loose Hytrel®g Tube | ||
| Pigtail Tensile Load | 10 N | ||
| Package Dimensions | Ø0.12" x 2.95" (Ø3.2 mm x 75.0 mm) |
||
| Operating Temperature | -40 to 85 °C | ||
| Storage Temperature | -40 to 85 °C | ||
Each NR73 wavelength combiner is shipped with a detailed test report that includes transmission and isolation measurements as well as an insertion loss plot.
")
 Zoom
Zoom
Click to Enlarge
Click Here for Raw Data
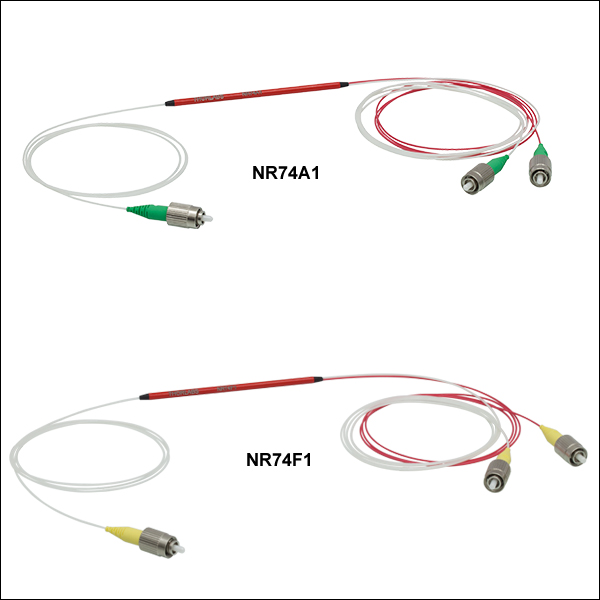
This plot shows an example of the spectral performance of an NR74 wavelength combiner. The lines represent the spectral response of each channel, while the colored regions denote the bandwidth around the center wavelengths. This data is typical; performance may vary from unit to unit within the combiner specifications. Data was obtained without connectors.
| NR74 Specifications | |||
|---|---|---|---|
| Port Jacket Color | Red | White (NIR)a | |
| Wavelength | 640 nm | 785 nm | |
| Bandwidthb | ±5 nm | ±5 nm | |
| Insertion Lossb,c | ≤0.3 dB | ≤0.3 dB | |
| Transmissionb,c | ≥93% | ≥93% | |
| Isolationb,d | @ 640 nm | N/A | ≥16 dB |
| @ 785 nm | ≥16 dB | N/A | |
| Polarization-Dependent Lossb | ≤0.2 dB | ||
| Optical Return Lossb | ≥60 dB | ||
| Fiber Typee | 630HP | ||
| Max Power Levelf | 500 mW (Spliced) |
||
| Fiber Lead Length and Tolerance | 0.8 m +0.075 m/-0.0 m | ||
| Jacket | Ø900 µm Loose Hytrel®g Tube | ||
| Pigtail Tensile Load | 10 N | ||
| Package Dimensions | Ø0.12" x 2.95" (Ø3.2 mm x 75.0 mm) |
||
| Operating Temperature | -40 to 85 °C | ||
| Storage Temperature | -40 to 85 °C | ||
Each NR74 wavelength combiner is shipped with a detailed test report that includes transmission and isolation measurements as well as an insertion loss plot.
")
 Zoom
Zoom
Click to Enlarge
Click Here for Raw Data
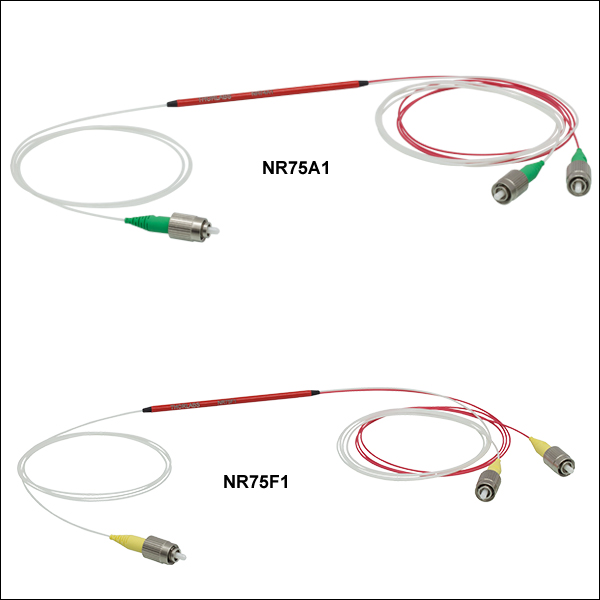
This plot shows an example of the spectral performance of an NR75 wavelength combiner. The lines represent the spectral response of each channel, while the colored regions denote the bandwidth around the center wavelengths. This data is typical; performance may vary from unit to unit within the combiner specifications. Data was obtained without connectors.
| NR75 Specifications | |||
|---|---|---|---|
| Port Jacket Color | Red | White (NIR)a | |
| Wavelength | 670 nm | 785 nm | |
| Bandwidthb | ±5 nm | ±5 nm | |
| Insertion Lossb,c | ≤0.3 dB | ≤0.3 dB | |
| Transmissionb,c | ≥93% | ≥93% | |
| Isolationb,d | @ 670 nm | N/A | ≥16 dB |
| @ 785 nm | ≥16 dB | N/A | |
| Polarization-Dependent Lossb | ≤0.2 dB | ||
| Optical Return Lossb | ≥60 dB | ||
| Fiber Typee | 630HP | ||
| Max Power Levelf | 500 mW (Spliced) |
||
| Fiber Lead Length and Tolerance | 0.8 m +0.075 m/-0.0 m | ||
| Jacket | Ø900 µm Loose Hytrel®g Tube | ||
| Pigtail Tensile Load | 10 N | ||
| Package Dimensions | Ø0.12" x 2.95" (Ø3.2 mm x 75.0 mm) |
||
| Operating Temperature | -40 to 85 °C | ||
| Storage Temperature | -40 to 85 °C | ||
Each NR75 wavelength combiner is shipped with a detailed test report that includes transmission and isolation measurements as well as an insertion loss plot.