 Products Home / Detectors / Amplified Detectors / Si Amplified Detectors / Si Fiber-Coupled Amplified Photodetectors
Si Fiber-Coupled Amplified Photodetectors
- Wavelength Range from 400 - 1000 nm
- High Signal-to-Noise Ratio
- Fixed or Switchable Gain Versions
- Ultrafast Up to 1.5 GHz
FPD510-FC-VIS
Fixed Gain
250 MHz Max Bandwidth
FPD310-FC-VIS
Switchable Gain
1500 MHz Max Bandwidth
FPD610-FC-VIS
Fixed Gain
600 MHz Max Bandwidth


Please Wait
Applications |
|
| FPD310-FC-VIS | FPD510-FC-VIS & FPD610-FC-VIS |
|
|
Features
- Sensitive to Wavelengths from 400 nm to 1000 nm
- Easy-to-Use, OEM Package with FC/PC Fiber-Coupled Input
- Integrated Low-Noise Amplifier
- Power Supply Included
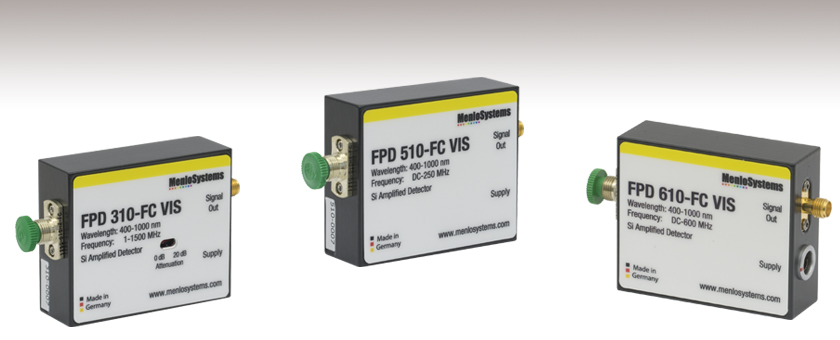
Menlo Systems' high-sensitivity Silicon (Si) PIN photodetectors are easy-to-use photodetectors with an integrated high-gain, low-noise RF (FPD310-FC-VIS) or transimpedance (FPD510-FC-VIS and FPD610-FC-VIS) amplifier.
The FPD310-FC-VIS is optimized for high gain, high bandwidths, extremely short rise times, and high signal-to-noise ratio. The gain can be switched between two settings, which allows optimal performance for many applications. The 3 dB bandwidth of this AC-coupled device is 5 - 1000 MHz.
The FPD510-FC-VIS and FPD610-FC-VIS photodetectors are optimized for maximum signal-to-noise-ratio for detection of low-level optical beat signals and pulse shapes at frequencies up to 250 MHz and 600 MHz, respectively. Both detectors have a fixed gain. The FPD510-FC-VIS has a rise time of 2 ns, while the FPD610-FC-VIS has a 1 ns rise time. The 3 dB bandwidth of these DC-coupled devices is 200 MHz for the FPD510-FC-VIS and 500 MHz for the FPD610-FC-VIS.
The compact design of these detectors allows for easy OEM integration. These detectors feature a FC/PC input for fiber-coupled applications and include a power supply that has a universal AC input. To view Si detectors with free-space input, click here.
| Item # | FPD310-FC-VIS | FPD510-FC-VIS | FPD610-FC-VIS |
|---|---|---|---|
| Optical Input | FC/PC connector | ||
| Spectral Range | 400 - 1000 nm | ||
| Saturation Limit | <200 µW | <100 µW | <100 µW |
| Damage Threshold | 2 mW | 3 mW | 3 mW |
| Detector Diameter | 0.25 mm | 0.25 mm | 0.25 mm |
| Frequency Range | 1 - 1500 MHz | DC - 250 MHz | DC - 600 MHz |
| 3 dB Bandwidth | 5 - 1000 MHz | DC - 200 MHz | DC - 500 MHz |
| Rise Time | 0.5 ns | 2 ns | 1 ns |
| Gain (fs Pulsed Input)a | Setting 1: 2 x 10⁴ Vpp/W Setting 2: 2 x 10³ Vpp/W |
1.5 x 10⁵ Vpp/W | 2 x 10⁶ Vpp/W |
| Gain (CW Input)a | Setting 1: 1.3 x 10³ Vpp/W Setting 2: 1.3 x 10² Vpp/W |
2.5 x 10⁴ Vpp/W | 2.5 x 10⁵ Vpp/W |
| Dark State Noise Level | -100 dBm/Hz1/2 (up to 5 MHz) -130 dBm/Hz1/2 (5 to 1500 MHz) |
-110 dBm/Hz1/2 (up to 5 MHz) -135 dBm/Hz1/2 (5 to 250 MHz) |
-80 dBm/Hz1/2 (up to 5 MHz) -100 dBm/Hz1/2 (5 to 600 MHz) |
| NEP (calculated) | 25.5 pW/Hz1/2 | 6.4 pW/Hz1/2 | 11.9 pW/Hz1/2 |
| Output Impedance | 50 Ω | 50 Ω | 50 Ω |
| Output Coupling | AC | DC | DC |
| Output Signal | ~1 V | 0 to 1 V | 0 to 1 V |
| Supply Voltage / Max. Current Consumption | +12 VDC / 100 mA | +12 VDC / 50 mA -12 VDC / 20 mA |
+5 VDC / <250 mA -12 VDC / <50 mA |
| Typical Performance Graphs | |||
| Output Connector | SMA female | ||
| Operating Temperature | 10 to 40 °C | ||
| Storage Temperature | -20 to +85 °C | ||
| Storage Humidity (RH) |
10% to 90% | ||
| Device Dimensions | 60 mm x 50 mm x 20 mm (2.4" x 2.0" x 0.79") | ||
Signal Out- SMA Female (Photodetector)
For connection to a suitable monitoring device, e.g. oscilloscope or RF-spectrum-analyzer, with 50 Ω impedance.
Female (Power Cables)
Male Power IN (Photodetector)
Pulsed Laser Emission: Power and Energy Calculations

Determining whether emission from a pulsed laser is compatible with a device or application can require referencing parameters that are not supplied by the laser's manufacturer. When this is the case, the necessary parameters can typically be calculated from the available information. Calculating peak pulse power, average power, pulse energy, and related parameters can be necessary to achieve desired outcomes including:
- Protecting biological samples from harm.
- Measuring the pulsed laser emission without damaging photodetectors and other sensors.
- Exciting fluorescence and non-linear effects in materials.
Pulsed laser radiation parameters are illustrated in Figure 1 and described in the table. For quick reference, a list of equations are provided below. The document available for download provides this information, as well as an introduction to pulsed laser emission, an overview of relationships among the different parameters, and guidance for applying the calculations.
|
Equations: |
||||
 |
and |  |
||
 |
||||
 |
||||
 |
||||
Peak power and average power calculated from each other: |
||||
 |
and |  |
||
| Peak power calculated from average power and duty cycle*: | ||||
 |
*Duty cycle ( ) is the fraction of time during which there is laser pulse emission. ) is the fraction of time during which there is laser pulse emission. |
|||
Click to Enlarge
Figure 1: Parameters used to describe pulsed laser emission are indicated in the plot (above) and described in the table (below). Pulse energy (E) is the shaded area under the pulse curve. Pulse energy is, equivalently, the area of the diagonally hashed region.
| Parameter | Symbol | Units | Description | ||
|---|---|---|---|---|---|
| Pulse Energy | E | Joules [J] | A measure of one pulse's total emission, which is the only light emitted by the laser over the entire period. The pulse energy equals the shaded area, which is equivalent to the area covered by diagonal hash marks. | ||
| Period | Δt | Seconds [s] | The amount of time between the start of one pulse and the start of the next. | ||
| Average Power | Pavg | Watts [W] | The height on the optical power axis, if the energy emitted by the pulse were uniformly spread over the entire period. | ||
| Instantaneous Power | P | Watts [W] | The optical power at a single, specific point in time. | ||
| Peak Power | Ppeak | Watts [W] | The maximum instantaneous optical power output by the laser. | ||
| Pulse Width |  |
Seconds [s] | A measure of the time between the beginning and end of the pulse, typically based on the full width half maximum (FWHM) of the pulse shape. Also called pulse duration. | ||
| Repetition Rate | frep | Hertz [Hz] | The frequency with which pulses are emitted. Equal to the reciprocal of the period. | ||
Example Calculation:
Is it safe to use a detector with a specified maximum peak optical input power of 75 mW to measure the following pulsed laser emission?
- Average Power: 1 mW
- Repetition Rate: 85 MHz
- Pulse Width: 10 fs
The energy per pulse:

seems low, but the peak pulse power is:

It is not safe to use the detector to measure this pulsed laser emission, since the peak power of the pulses is >5 orders of magnitude higher than the detector's maximum peak optical input power.
| Posted Comments: | |
adarsh jain
(posted 2019-12-18 04:27:18.7) Kindly let me know the min. average optical i/p power that can be detected faithfully with this detector. asundararaj
(posted 2020-02-04 10:42:52.0) Thank you for contacting Thorlabs. The minimum detectable power by detectors would depend on the NEP of the detector and the repetition rate of your laser. ali.mirvakili
(posted 2013-01-30 17:13:05.57) Hello,
I have the PDA10A, but I need the photodetector which has higher bandwidth and also high gain; I came across the FPD310-FV and FDP510-FV; I could not see the transimpedance gain (V/A)in their spec compare to the spec of PDA10A; does it mean that these two detectors does not have the gain stage inside?
My other question is related to this sentence given in the Overview of FPD310-FV:"This photodetector is not suitable for pulses longer than 30 ns or continuous light levels." I do need to test the pulses with the pulse width of 100 ns to 10 ns, so it means that this detector is not gonna work for me, right? Do you have any detector with the same bandwidth (around 1GHz)which also has a high gain of around 40dB?
Thanks, jlow
(posted 2013-02-06 16:26:00.0) Response from Jeremy at Thorlabs: The gain is given at 750nm (which has a responsivity of about 0.5A/W). Therefore, the gain for setting 1 would be about 10^5 V/A and for setting 2 would be about 10^3 V/A. The FPD310-FV has a 3dB bandwidth of 10-900MHz, which is where the 30ns number come from. I will contact you directly to discuss about your application requirements. |